


1. Introduction
The Fishbone Diagram, also known as the Ishikawa Diagram or Cause-and-Effect Diagram, is a used to identify the root causes of a specific issue. It was developed by Kaoru Ishikawa in the 1960s and has since become a staple in across industries.
 – Key Concepts, Examples, and the Role of AI-Powered Tools like Visual Paradigm")
In this case study, we explore:
- The key concepts of Fishbone Analysis.
- A real-world example using the provided diagram.
- How Visual Paradigm’s AI-powered diagram generator can enhance and streamline the analysis process.
2. Key Concepts of Fishbone Analysis
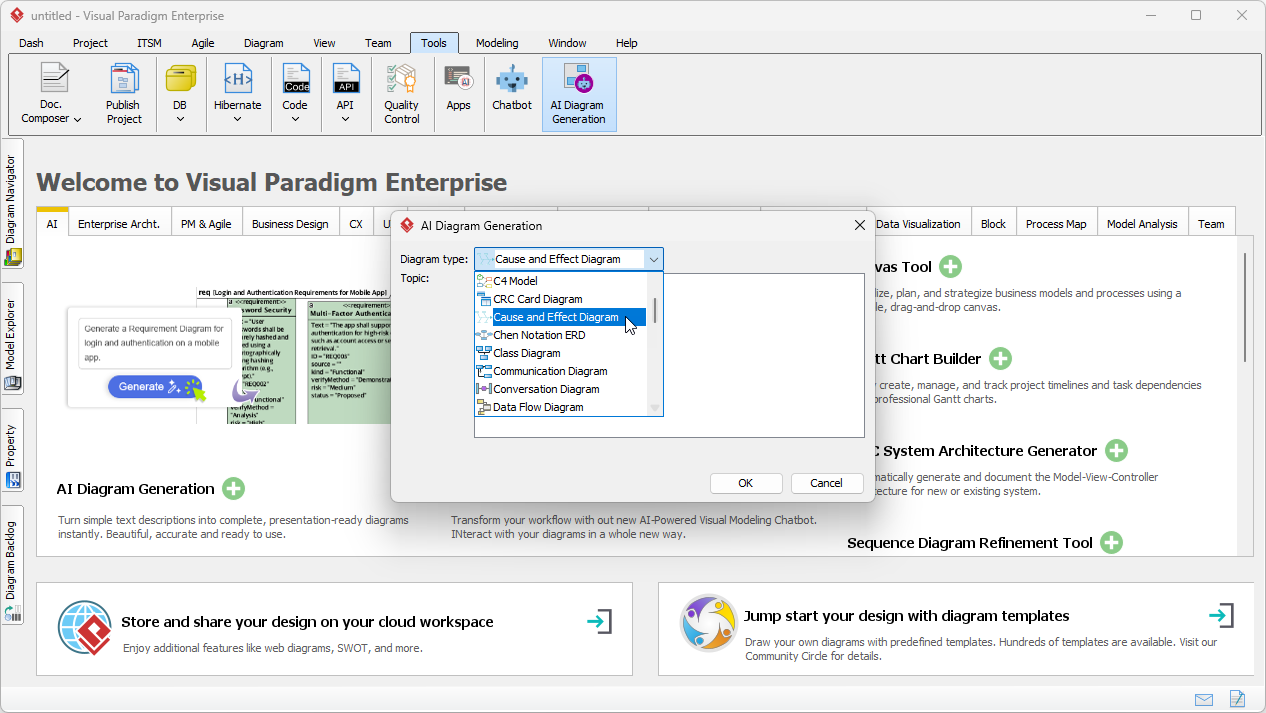
2.1 What is a Fishbone Diagram?
- A that visually maps out potential causes of a problem.
- The diagram resembles a fish skeleton, with the problem (effect) at the head and categories of causes branching out like bones.
2.2 Core Components
| Component | Description |
|---|---|
| Problem Statement (Head) | The effect or issue being analyzed (e.g., “Customer satisfaction declined”). |
| Main Categories (Bones) | Broad categories of potential causes (e.g., Communication, Pricing, Service Experience, Product Quality). |
| Sub-Causes (Branches) | Specific factors contributing to each main category (e.g., “Lack of transparent updates” under Communication). |
2.3 Common Categories ()
Fishbone diagrams often use the 6Ms to categorize causes:
- Manpower (People)
- Methods (Processes)
- Machines (Equipment)
- Materials (Inputs)
- Measurement (Data)
- Mother Nature (Environment)
In service industries, categories like Communication, Pricing, and Service Experience (as shown in the diagram) are more relevant.
3. Example: Analyzing Declining Customer Satisfaction
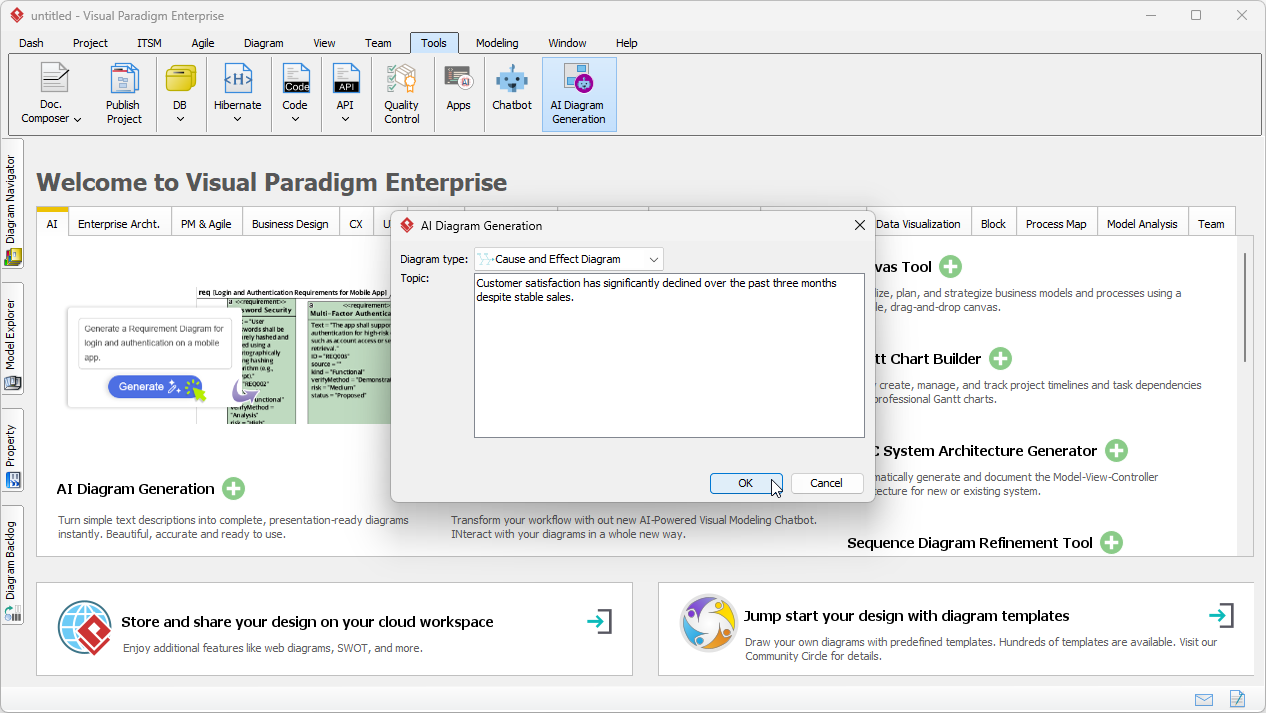
3.1 Problem Statement
“Customer satisfaction declined”
3.2 Fishbone Diagram Breakdown
The provided diagram identifies four main categories contributing to declining customer satisfaction:
3.2.1 Communication
- Lack of transparent updates → Customers feel uninformed about product changes or issues.
- Ineffective feedback channels → Customers struggle to voice concerns or suggestions.
3.2.2 Product Quality
- Increased defect rate in products → More products fail or require repairs.
- Inconsistent product performance → Products do not meet expected standards.
3.2.3 Pricing
- → Customers feel they are not getting value for money.
3.2.4 Service Experience
- Long wait times for support → Customers face delays in issue resolution.
- Poorly trained support staff → Support teams cannot address customer needs effectively.
3.3 Root Cause Identification
By analyzing the diagram, teams can prioritize actions such as:
- Improving communication transparency (e.g., regular updates, clear feedback channels).
- Enhancing product testing to reduce defects.
- Reviewing pricing strategies to align with customer expectations.
- Investing in support staff training to reduce wait times.
4. How Visual Paradigm’s AI-Powered Diagram Generator Enhances Fishbone Analysis
4.1 Traditional Challenges in Fishbone Analysis
- Time-Consuming: Manually creating diagrams can be slow, especially for complex problems.
- Subjectivity: Different team members may interpret causes differently.
- Lack of Standardization: Diagrams may vary in structure, making comparisons difficult.
4.2 Benefits of AI-Powered Diagram Generation
| Feature | Benefit |
|---|---|
| Automated Diagram Creation | AI generates diagrams instantly based on input, saving time and effort. |
| Smart Suggestions | AI recommends potential causes based on industry best practices. |
| Collaborative Editing | Teams can co-create and refine diagrams in real time. |
| Integration with Jira/Confluence | Diagrams can be synced directly to project management tools. |
| Consistency and Standardization | AI ensures diagrams follow a structured format, improving clarity. |
4.3 How It Streamlines the Analysis Process
-
Faster Brainstorming:
- Teams input the problem statement and main categories.
- AI suggests sub-causes, reducing the cognitive load on participants.
-
Data-Driven Insights:
- AI can analyze historical data (e.g., customer complaints, defect reports) to identify likely causes.
-
Dynamic Updates:
- As new information emerges, the diagram updates automatically, keeping the analysis current.
-
:
- Diagrams can be exported, shared, or embedded in reports, presentations, or project tools like Jira.
5. Why Visual Paradigm’s AI Tool is Useful for Businesses
5.1 For Product Teams
- Identify root causes of product issues quickly.
- Align cross-functional teams on problem-solving.
5.2 For Customer Support
- (e.g., long wait times, poor training).
- Improve response strategies based on visual insights.
5.3 For Quality Assurance
- and prioritize fixes.
- Standardize root cause analysis across projects.
5.4 For Executives
- Gain a holistic view of operational challenges.
- to improve customer satisfaction.
6. Summary and Key Takeaways
6.1 Fishbone Analysis in a Nutshell
- A structured, visual method to identify root causes.
- Encourages collaborative problem-solving.
- Applicable across manufacturing, services, healthcare, and more.
6.2 The Role of AI in Fishbone Diagrams
- Speeds up the creation and refinement process.
- Reduces bias by suggesting data-driven causes.
- Enhances collaboration with real-time updates.
6.3 Why Visual Paradigm Stands Out
- AI-powered suggestions make analysis smarter.
- Seamless integration with Agile tools like Jira.
- for both technical and non-technical users.
7. Conclusion
Fishbone Analysis is a powerful tool for root cause identification, but its effectiveness depends on how quickly and accurately teams can create and interpret diagrams. Visual Paradigm’s AI-powered diagram generator transforms this process by:
- Automating diagram creation.
- Enhancing collaboration and standardization.
- Integrating with existing workflows.
For businesses aiming to improve quality, customer satisfaction, and operational efficiency, leveraging AI-driven tools like Visual Paradigm is a .
Question for Discussion: How does your organization currently approach root cause analysis? Could AI-powered visual tools like Visual Paradigm help streamline your processes?
