


Introduction
Use case diagrams are essential for visualizing system functionality, but they often require detailed textual documentation to ensure clarity and understanding among stakeholders. Manually creating these reports is time-consuming and prone to errors. The by Visual Paradigm is an AI-powered tool that automates this process, transforming into structured, detailed reports.
This guide covers:
- Key concepts of use case diagrams and AI report generation
- Step-by-step guidelines for using the tool
- Tips and tricks for optimizing your workflow
- Practical examples to illustrate the process
Key Concepts
1. Use Case Diagrams
- Purpose: Visualize interactions between actors (users or systems) and use cases (system functionalities).
- Components:
- Actors: Entities interacting with the system (e.g., users, external systems).
- Use Cases: Specific functionalities or actions the system performs.
- Relationships: Connections between actors and use cases (e.g., associations, includes, extends).
2. PlantUML
- A text-based language for creating UML diagrams.
- Example:
@startuml

actor User

User -> (Login)

User -> (Logout)

@enduml
3. AI-Powered Report Generation
- How it works: The , renders the diagram, and generates a textual report detailing actors, use cases, and relationships.
- Benefits:
- Automation: Reduces manual effort and ensures consistency.
- Clarity: Provides structured explanations for technical and non-technical stakeholders.
- Visual Rendering: Displays the diagram alongside the report.
Step-by-Step Guidelines
1. Accessing the Tool
- For :
- Navigate to: Use Case Diagram Report Generator
- For Visual Paradigm Desktop Users:
- Open the desktop application.
- Go to Tools > App and select Use Case Diagram Report Generator.
2. Generating a Report
-
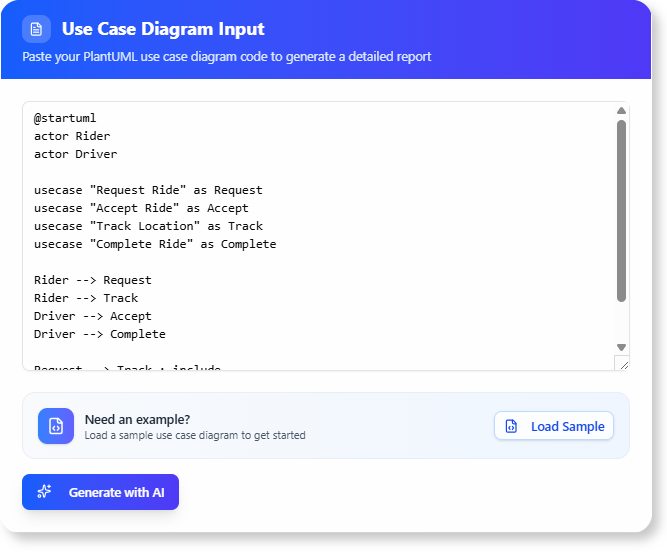
Input Your PlantUML Diagram:
- Paste your PlantUML code into the input area.
- Example:
@startuml

actor Customer

Customer -> (Place Order)

Customer -> (View Order History)

@enduml - The tool will render the diagram visually.
-
Generate the Report:
- Click the “Generate with AI” button.
- The AI will analyze the diagram and produce a detailed report.
-
Review and Export:
- Review the generated report.
- Export it as Markdown for further use.
Tips and Tricks
1. Optimizing PlantUML Code
- Use Clear Naming: Name actors and use cases descriptively (e.g.,
Admininstead ofUser1). - Leverage Relationships: Use
includesandextendsto show dependencies between use cases. - Add Notes: Use PlantUML notes (
note) to provide additional context.
2. Enhancing Report Quality
- Review Automatically Generated Content: Ensure the AI accurately interprets relationships.
- Customize Reports: Edit the generated report to add .
- Use Visuals: Include the rendered diagram in presentations or documentation.
3. Collaboration and Sharing
- Share Reports: Export reports as Markdown and share them with stakeholders.
- Integrate with Documentation: Embed reports in project documentation or wikis.
Practical Example
Example PlantUML Code
@startuml

actor Student

actor Professor
Student -> (Enroll in Course)
Student -> (View Grades)
Professor -> (Submit Grades)
(Enroll in Course) .> (View Grades) : includes
@enduml
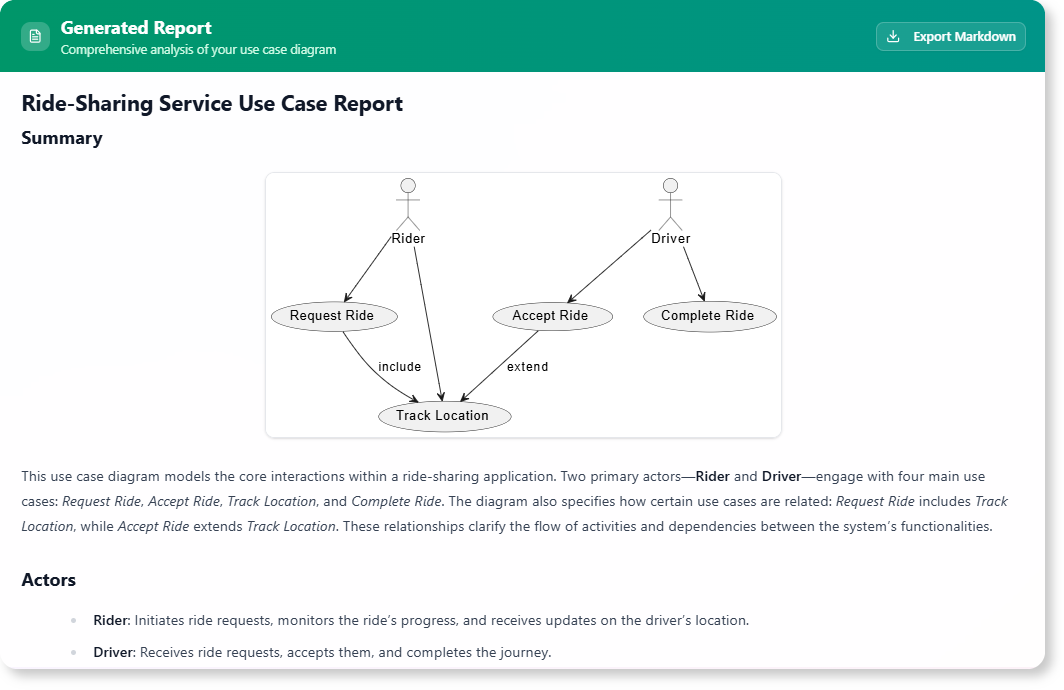
Generated Report (Excerpt)
- Actors:
- Student: Interacts with the system to enroll in courses and view grades.
- Professor: Submits grades for courses.
- Use Cases:
- Enroll in Course: Allows students to register for courses.
- View Grades: Enables students to check their academic performance.
- Submit Grades: Allows professors to input student grades.
- Relationships:
- Enroll in Course (students must enroll before viewing grades).
Conclusion
The Use Case Diagram Report Generator simplifies the documentation process, ensuring accuracy and clarity. By following this guide, you can:
- Automate report generation from PlantUML diagrams.
- Improve collaboration with .
- Save time and reduce manual errors.
Ready to try it out?
