


UML (Unified Modeling Language) Component Diagrams are a powerful tool in software architecture and design, particularly for modeling the structure of complex systems in terms of modular, reusable components. They focus on the “physical” aspects of a system, such as how software artifacts are organized, deployed, and interact with each other. This guide will cover the key concepts, notation, best practices, and provide multiple examples, including a detailed case study on an online banking system. By the end, you’ll understand how to create and use Component Diagrams effectively to architect robust, distributed applications.
What is a UML Component Diagram?
A UML Component Diagram is a static structure diagram that represents the organization and dependencies among a system’s components. Unlike Class Diagrams, which focus on logical classes and relationships, Component Diagrams emphasize deployable units—such as executables, libraries, or services—and their interfaces. They are especially useful in:
- Distributed Systems: Modeling microservices, client-server architectures, or cloud-based applications.
- Modular Design: Promoting reusability, replaceability, and scalability by defining clear contracts between parts.
- Deployment Views: Showing how components are packaged and interact at runtime.
Component Diagrams are part of the UML 2.x standard and are often used in the design phase of software development to bridge high-level architecture with implementation.
Key Concepts in UML Component Diagrams
Here are the core elements and concepts, explained with their notations and purposes:
- Component:
- A modular, replaceable unit of software that encapsulates implementation and exposes interfaces.
- Notation: A rectangle with the stereotype <<component>> or a small component icon (a rectangle with two small tabs on the left side).
- Purpose: Represents deployable artifacts like JAR files, DLLs, web services, or executables. Components can be nested (composite components) to show hierarchies.
- Interface:
- Defines a contract for services without specifying implementation.
- Provided Interface: Services a component offers to others (what it “provides”).
- Notation: A “lollipop” (circle on a stick) attached to the component, labeled with the interface name (e.g., IAuthService).
- Required Interface: Services a component needs from others (what it “requires”).
- Notation: A “socket” (semicircle) attached to the component, labeled with the interface name.
- Purpose: Interfaces ensure loose coupling—components interact via contracts, allowing easy swapping of implementations.
- Port:
- A connection point on a component for attaching interfaces.
- Notation: A small square on the component’s boundary, with interfaces connected to it.
- Purpose: Ports group related interfaces and specify interaction points, useful in complex systems like embedded or real-time applications.
- Dependency:
- Shows that one component relies on another.
- Notation: A dashed arrow with an open arrowhead from the dependent (requiring) component to the provider.
- Purpose: Indicates required interfaces or general dependencies (e.g., a component needs a library).
- Assembly Connector:
- Links a required interface of one component to a provided interface of another.
- Notation: A solid line connecting a socket to a lollipop.
- Purpose: Represents runtime connections, like method calls or API invocations.
- Delegation Connector:
- Used in composite components to delegate interfaces from inner to outer components.
- Notation: A solid line with an arrow from an inner port to an outer port.
- Purpose: Shows how internal implementations fulfill external contracts.
- Artifacts:
- Physical files or deployable units (e.g., .exe, .jar).
- Notation: A rectangle with <<artifact>> stereotype, often linked to components via deployment relationships.
- Purpose: Ties components to real-world deployment items.
- Stereotypes and Notes:
- Custom extensions like <<subsystem>> or <<executable>>.
- Notes (dashed boxes with text) for annotations.
Best Practices
- Keep it High-Level: Focus on architecture, not low-level details—avoid cluttering with too many classes.
- Define Clear Contracts: Always specify interfaces for interactions to promote testability and maintainability.
- Use for Change Management: Analyze dependencies to assess impacts of modifications.
- Tools: Use diagramming software like Visual Paradigm, Lucidchart, or PlantUML for creation and collaboration.
- Integration with Other Diagrams: Combine with Deployment Diagrams (for hardware mapping) or Use Case Diagrams (for functional context).
Case Study: Secure Online Banking System Using AI-Assisted Design
This case study illustrates how a solutions architect can use UML Component Diagrams to model a secure online banking application. It demonstrates iterative refinement and leverages AI tools for rapid prototyping. We’ll follow the phases described in a real-world scenario.
Phase 1: Initial Foundation
Start with core internal components: UserAuthentication and AccountManagement.
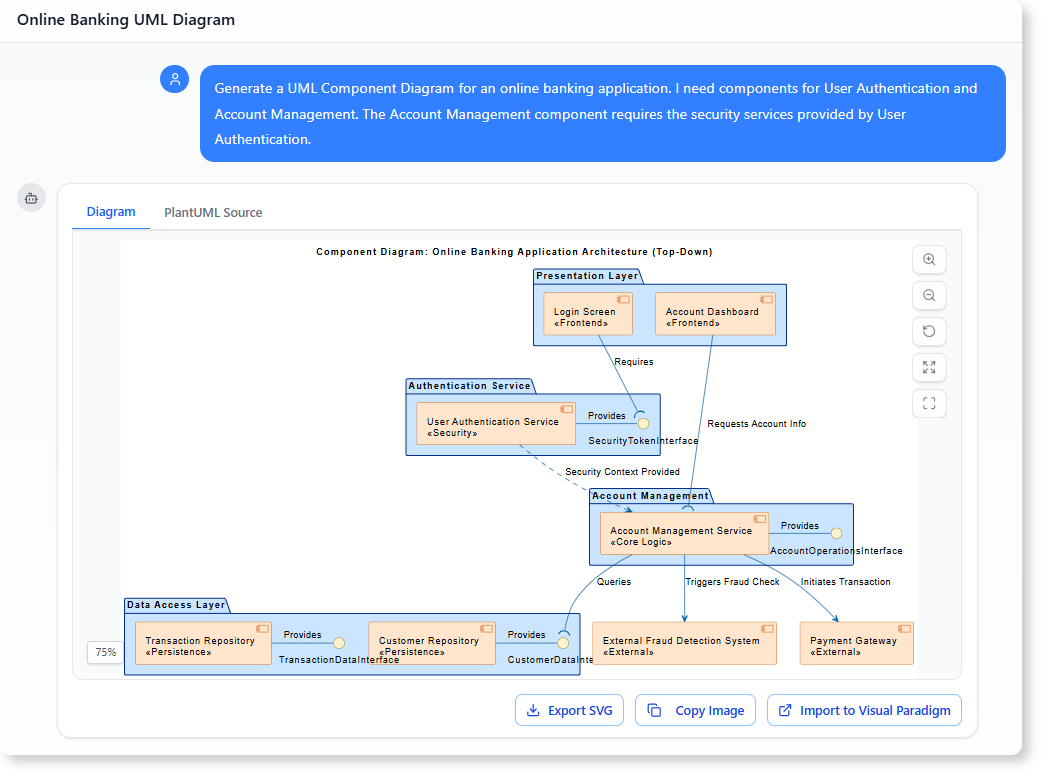
- Initial Prompt (for AI generation): “Generate a UML Component Diagram for an online banking application. I need components for User Authentication and Account Management. The Account Management component requires the security services provided by User Authentication.”
Resulting Diagram Key Elements:
- Components: PresentationLayer (e.g., Login Screen), UserAuthenticationService (provides IAuthService), AccountManagementService (requires IAuthService), DataAccessLayer (e.g., CustomerRepository).
- Dependencies: AccountManagementService –> UserAuthenticationService via assembly connector.
- Proactive Additions: AI might add external systems like EmailService for notifications.
Explanation: This establishes a layered architecture. The IAuthService (formerly SecurityTokenInterface) ensures secure token-based authentication, making the system modular and secure.
Phase 2: Refinement with External Dependencies
Refine by adding contracts for external services and standardizing names.
- Prompt 1: “Show the Account Management Service requiring an interface called IPayProcess from the Payment Gateway component to initiate transactions.”
- Adds: PaymentGateway (external component) providing IPayProcess.
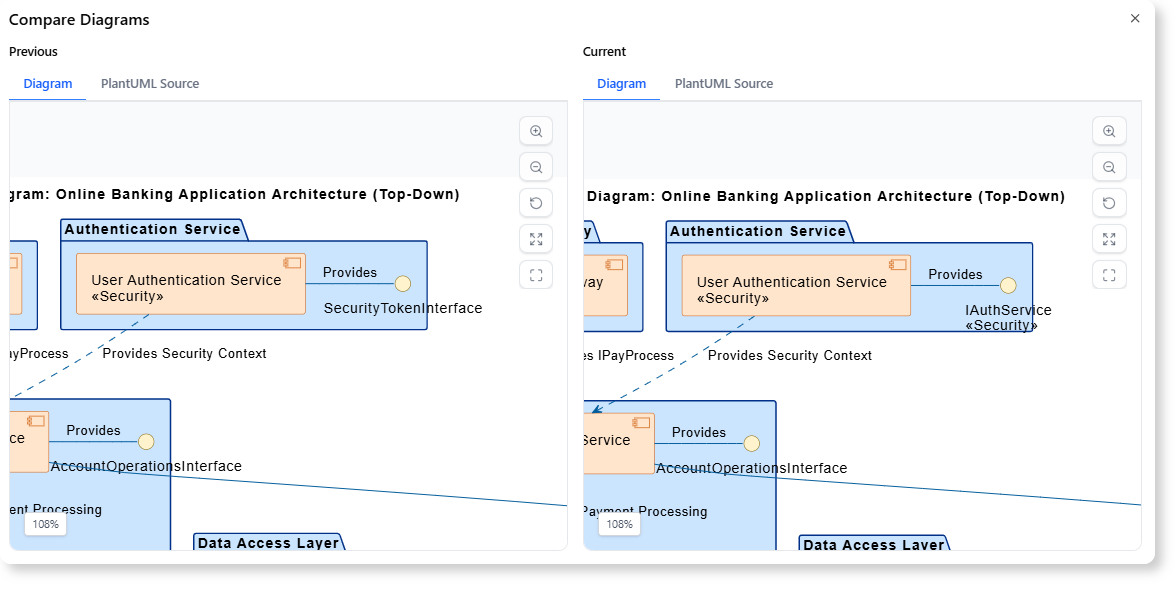
- Prompt 2: “Rename the provided interface SecurityTokenInterface to IAuthService to standardize the API contract.”
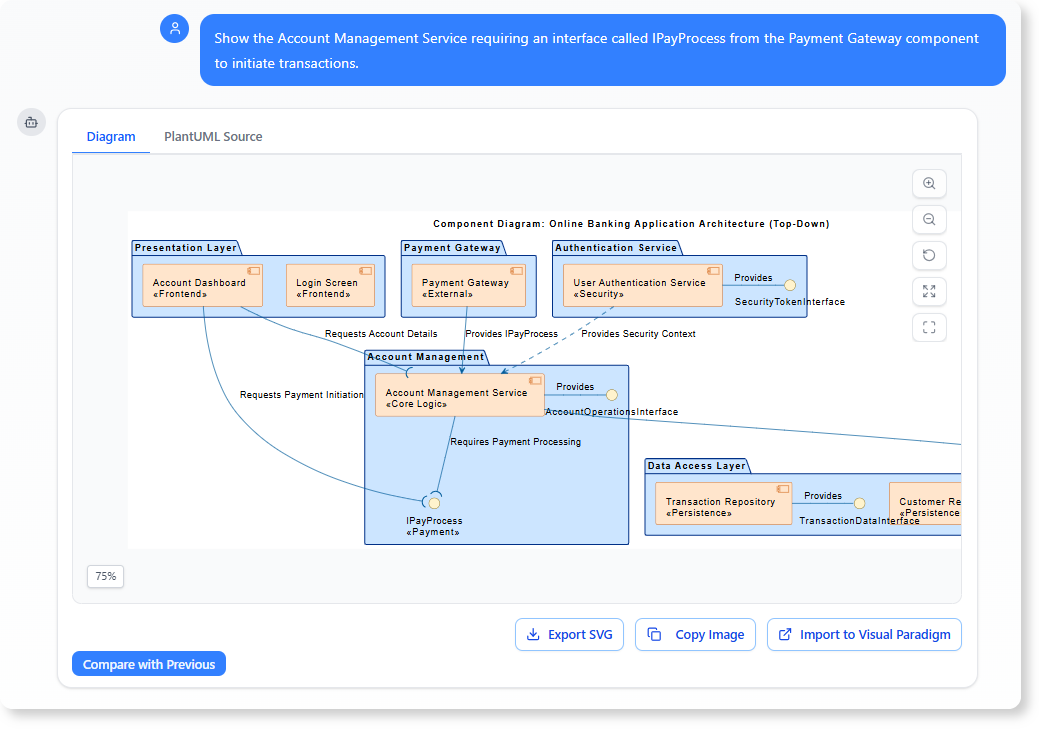
Updated Diagram:
- AccountManagementService requires IPayProcess from PaymentGateway.
- Standardized interfaces enforce consistency.
Benefit: Models third-party integrations clearly, reducing integration risks.
Phase 3: Analysis and Documentation
Use the diagram for downstream tasks.
-
Service Inventory Document: Prompt: “Generate a Service Inventory Document section listing every component in the diagram. For each component, list its name, and for its provided interfaces (lollipops), provide the interface name and a brief description of its function.”
Example Output (Table Format):
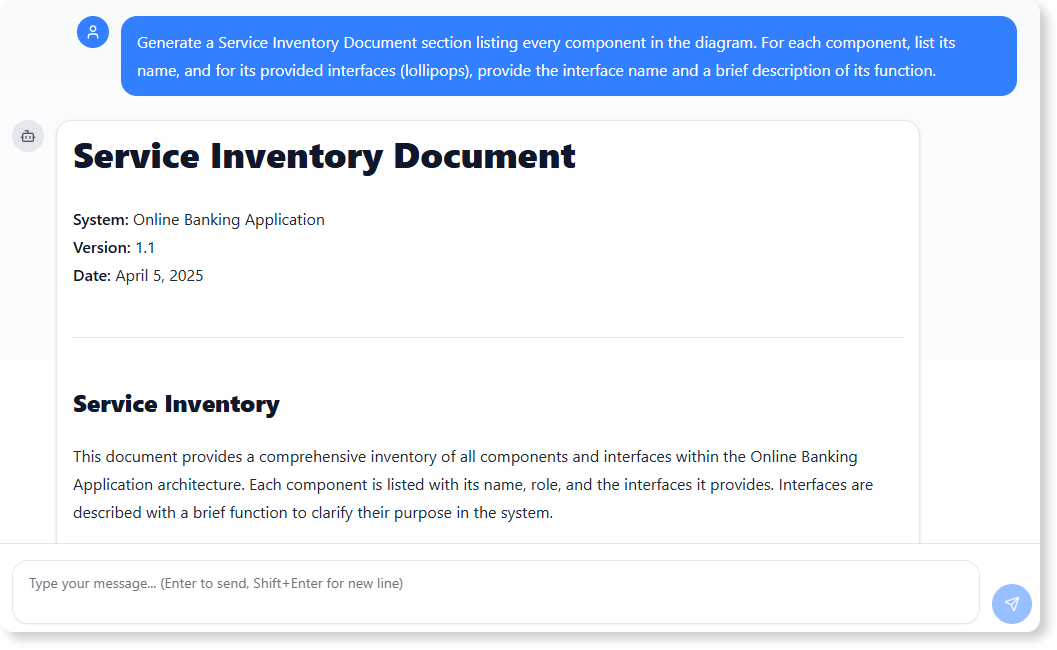
Component Name Provided Interface Description UserAuthenticationService IAuthService Handles user login and token generation for secure access. AccountManagementService IAccountService Manages account balances, transactions, and queries. PaymentGateway IPayProcess Processes payments and refunds with external banks. CustomerRepository IDataRepo Provides CRUD operations for customer data storage. -
Impact Analysis Report: Prompt: “Draft a short Impact Analysis Report on the effect of changing the contract for the IAuthService interface. Specifically, identify which components will be immediately affected by this change and need retesting.”
Example Report: Changing IAuthService (e.g., adding parameters to login methods) directly impacts consumers like AccountManagementService and PresentationLayer (Login Screen). These require retesting for compatibility. Downstream effects may include PaymentGateway if security tokens propagate. Risk: High—potential for authentication failures system-wide.
This case study shows how Component Diagrams serve as a “contract map” for teams, enabling quick iterations and risk assessments.
Additional Examples
- IoT System: Components like SensorHub (requires ICloudSync from CloudService), DeviceController (provides IDeviceControl).
- Enterprise Application: Nested components in a CRMSubsystem with delegated interfaces to sub-components like ContactManager.
- Game Engine: RenderingEngine requires IPhysicsEngine from an external library, using ports for multi-threaded interactions.
Tools and Recommendations
For creating UML Component Diagrams, consider AI-powered tools to accelerate design. I recommend Visual Paradigm’s AI Diagram Generation Feature, which allows conversational prompting to generate, refine, and analyze diagrams. As shown in the case study, it can build complex architectures from simple prompts, add dependencies, and even produce documentation. Explore it for efficient modeling in real projects—visit their UML resource hub for more resources.
Visual Paradigm offers a robust suite of AI-powered feature tools designed to streamline workflows, enhance creativity, and accelerate software design and documentation. Here are some of the most impactful AI-powered tools and features available as of late 2025:
1. AI-Powered Modeling & Diagramming
- What it does: Generates, refines, and analyzes diagrams (UML, ArchiMate, C4 models, SWOT, PESTLE, etc.) from simple text prompts. You describe what you need, and the AI creates the diagram for you.
- Use case: Ideal for software architects, business analysts, and project managers who need to quickly visualize complex systems or strategies.
- How to access: Available in both Visual Paradigm Online and desktop environments. Just type your requirements, and the AI generates the diagram for editing and export.
- Example: “Create a UML class diagram for an e-commerce system with user, product, and order classes.”
- What it does: Transforms unstructured problem descriptions (e.g., user stories, requirements documents) into structured design elements like domain models, use cases, and class diagrams.
- Use case: Accelerates the transition from requirements gathering to software design, reducing manual effort and improving accuracy.
- Example: Paste a paragraph describing a banking system, and the AI extracts entities, relationships, and attributes for a domain model.
- What it does: Automatically generates use case reports, flow of events, scenarios, and test cases from PlantUML base use case diagrams.
- Use case: Simplifies documentation and testing by converting visual diagrams into detailed, actionable reports.
2.
- What it does: Creates and edits interactive mind maps using AI-driven insights. The tool suggests ideas, organizes nodes, and allows real-time collaboration.
- Key features:
- Intuitive editing tools (add, delete, modify nodes).
- Export options: JSON (for data integration) or Markdown (for documentation).
- Hotkeys and automation to streamline workflows.
- Use case: Perfect for team brainstorming sessions, project planning, or organizing complex ideas.
3.
- What it does: Generates illustrated flipbooks or e-books from a topic, description, target audience, and page count. The AI drafts the book structure, content, and even suggests image placements.
- Key features:
- Quick setup with minimal input.
- Feature-rich Markdown editor for customization.
- AI selects images and styles that match your narrative.
- Use case: Great for educators, marketers, or content creators who need to produce engaging flipbooks or storybooks quickly.
4.
- What it does: Enhances, enlarges, and upscales images using AI to restore details, remove backgrounds, and unblur photos.
- Key features:
- One-click image enhancement.
- Professional-grade results for marketing, product displays, or creative projects.
- Free plan available for basic enhancement.
5.
- What it does: Transforms plain English descriptions into production-ready database models. The AI guides you through the process, from schema design to SQL generation.
- Use case: Ideal for database architects and developers who want to skip manual modeling and jump straight to implementation.
6.
- What it does: Creates stunning animated presentations and slideshows using generative AI. Merge your ideas with AI to produce visually appealing content.
- Use case: Useful for business presentations, educational materials, or marketing pitches.
7.
- What it does: Supports frameworks like Force Field Analysis, SWOT, and PESTLE to help teams evaluate strategic decisions.
- Use case: Valuable for business analysts, consultants, and project managers who need to assess risks, opportunities, and competitive landscapes.
How to Get Started
Most of these tools are accessible via the Visual Paradigm Online platform or as integrated features in the desktop application. Some tools, like the AI Chatbot, require an , while others (e.g., image enhancement) offer free tiers.
| Visual Paradigm AI Chatbot (Diagram Generation) | https://chat.visual-paradigm.com/ |
| AI Textual Analysis (Structured Design from Text) | https://www.visual-paradigm.com/features/ai-textual-analysis/ |
| AI Base Use Case Diagram Analyzer | https://www.visual-paradigm.com/features/ai-base-use-case-diagram-analyzer/ |
| AI-Powered UML & Software Design (Blog) | https://www.diagrams-ai.com/blog/uml-relevance-2025-ai-powered-modeling/ |
Which of these tools aligns most with your current workflow, Curtis? For example, are you looking to streamline software design, enhance creativity, or improve documentation?
