Framework View
Framework View.
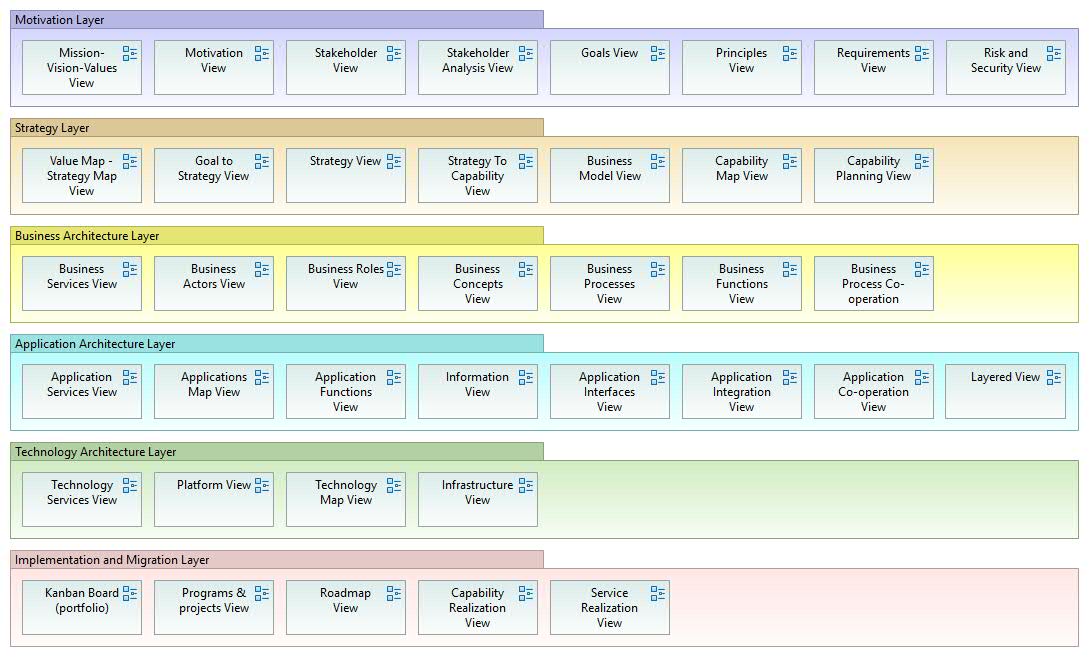
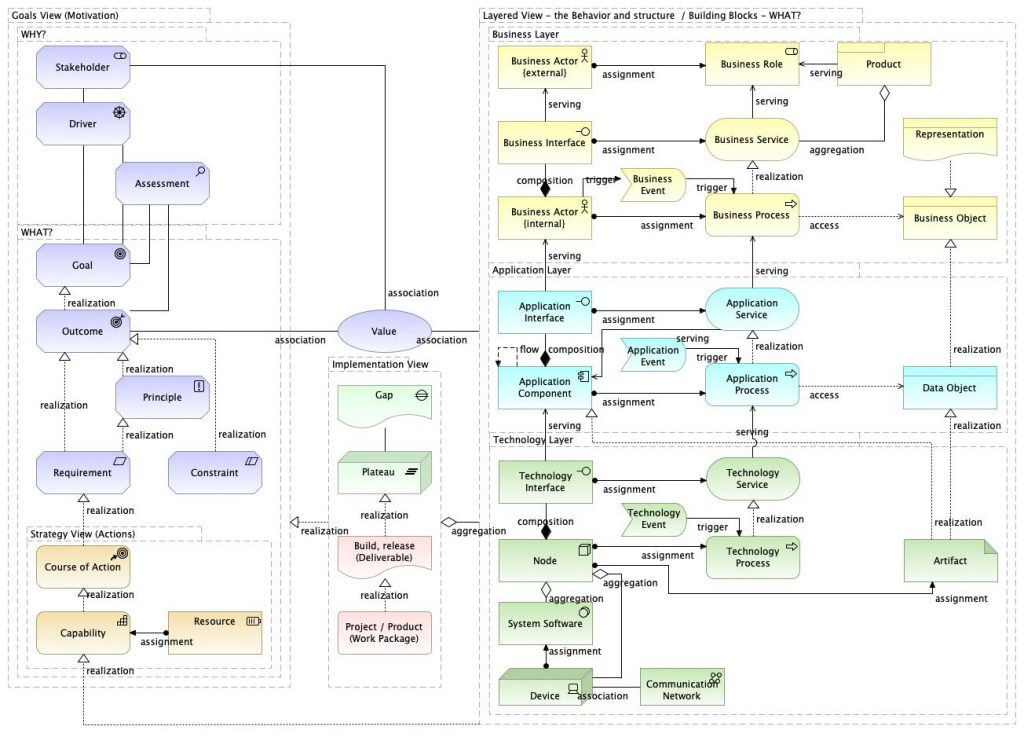
This view represents the framework for building all development aspects and related diagrams. The view can be modified according to the situation. Therefore, this view can be used for navigation between diagrams. This version of the view is applied from the ArchiMate (3) framework. Motivation is introduced here as a “layer” rather than an “aspect”.
Motivation Viewpoint
Motivation Viewpoint
Motivation Viewpoint.
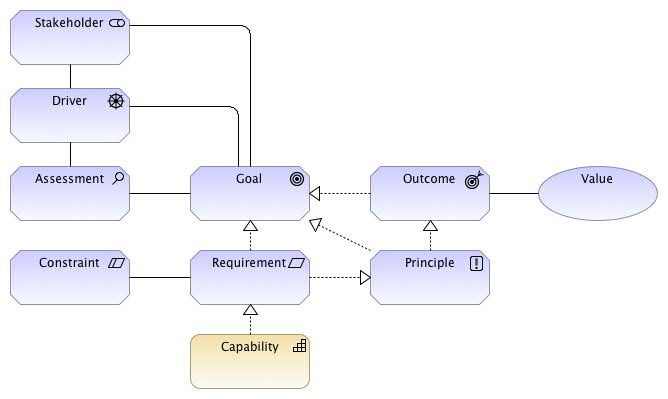
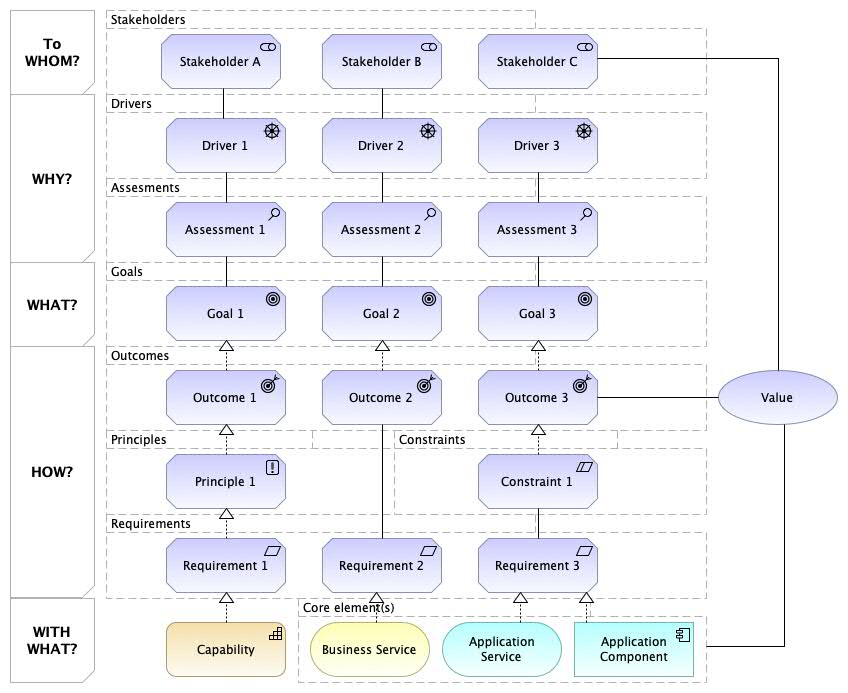
This view can be used to analyze the motivations or drivers that guide the organization and its enterprise architecture design or change. These motivation analyses are the starting point for all change activities or business transformations within the organization. The view represents the vision of the development work — whether the scope and scale covers the entire organization or a part of it (e.g., a business line) or a single program or project (solution level). Note: A Value can be added to e.g. Outcome (or any other ArchiMate element) to indicate what is the real added value!
Motivation elements are based on the Business Motivation Model (BMM) [specification v.1.3, 2015, OMG].
Mission – Vision – Values View
Mission – Vision – Values.
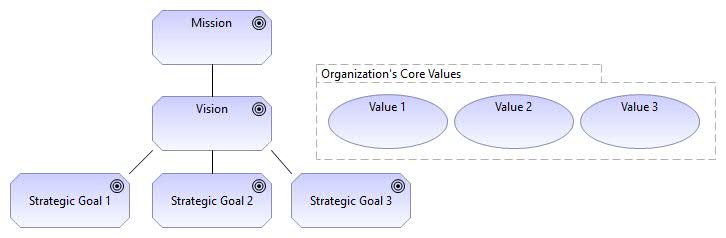
This view can be used to represent the organization’s mission, vision, and core values. The mission expresses, for example, “What is the purpose of the organization, what it actually does or intends to do, and what is the primary reason for its existence?” The vision is the future state the organization intends to develop toward. Core values are what support the vision, shape the culture, and reflect the organization’s values. To realize the organization’s vision, strategic goals need to be achieved.
Reference: Aldea, A. – Iacob, M.-E. – Hillegersberg, J. – Quartel, D. – Franken, H. (2015) Modeling Strategy with ArchiMate.
Strategic Value Map View
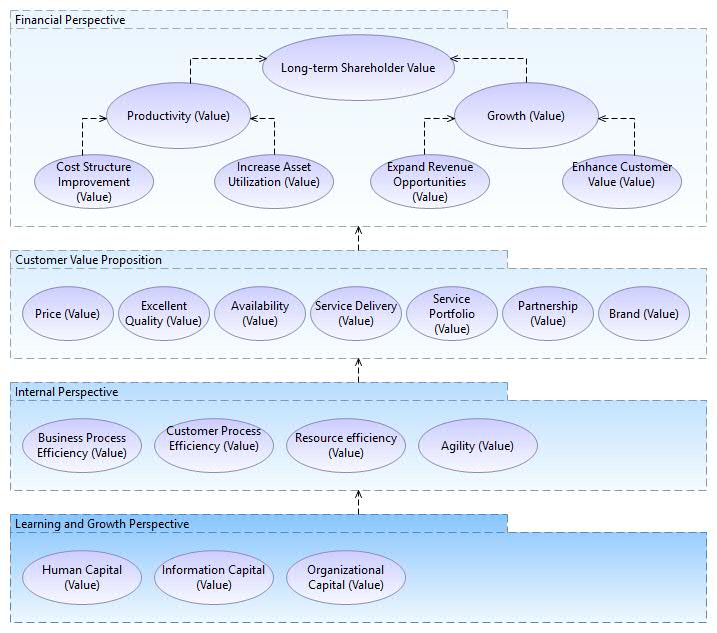
Value Map – Strategy Map View.
This view can be used to visualize the organization’s strategy. The view contains strategic value elements, and all development activities must be derived — directly or indirectly — from the strategic value elements. By visualizing strategic value, it is possible to trace all other elements related to the actual strategic execution. With this view, strategy can be made tangible: visualized, communicated, and linked to reality.
Stakeholder Analysis View
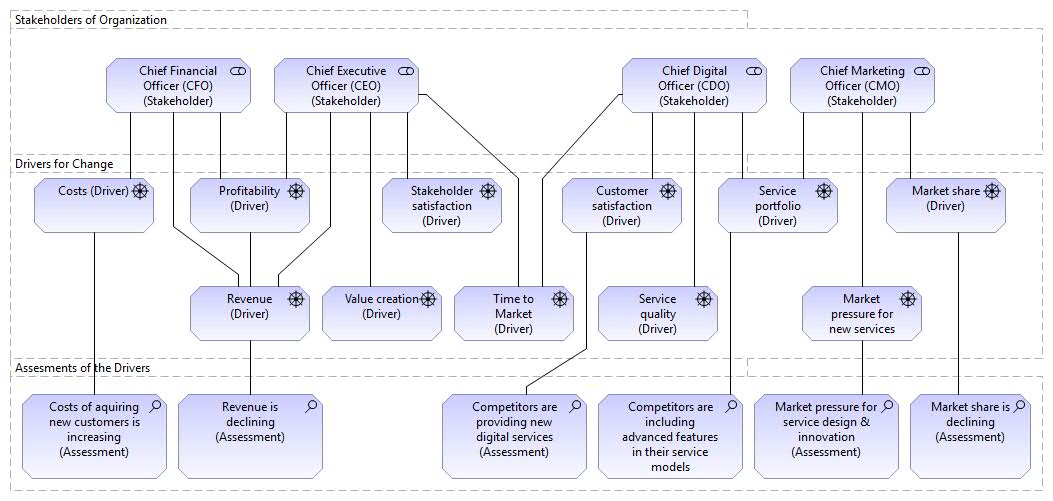
Stakeholder Analysis View.
This view can be used for stakeholder analysis for business development: what are the drivers of change? First, relevant stakeholders are identified, then drivers of change that align with their interests are determined. The “Assessment” concept can be used to analyze drivers in more detail, e.g. according to the SWOT (Strengths, Weaknesses, Opportunities, Threats) approach. Usually, different stakeholder views can be created from different viewpoints. Another reason for splitting the big picture into smaller ones is to keep the diagrams compact and readable — for simplicity.
Stakeholder Viewpoint
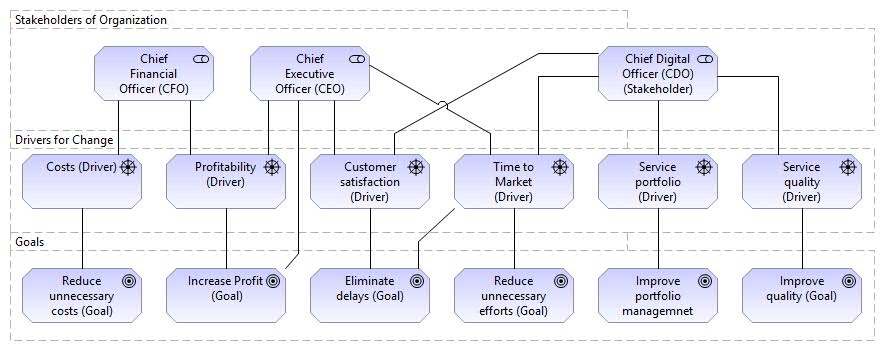
Stakeholder Viewpoint.
This view can be used to link stakeholders’ drivers to business goals. Goals are key elements of the organization’s development. All subsequent elements should trace back to these primary drivers of all change activities.
Principles View
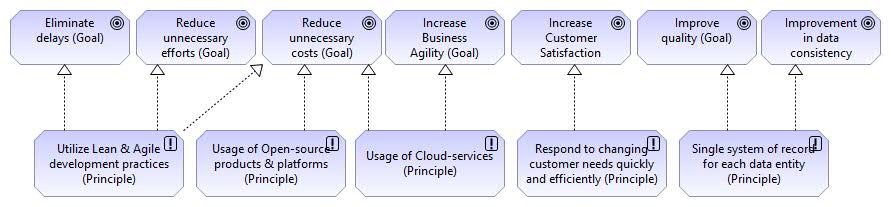
Principles View.
Risk & Security View
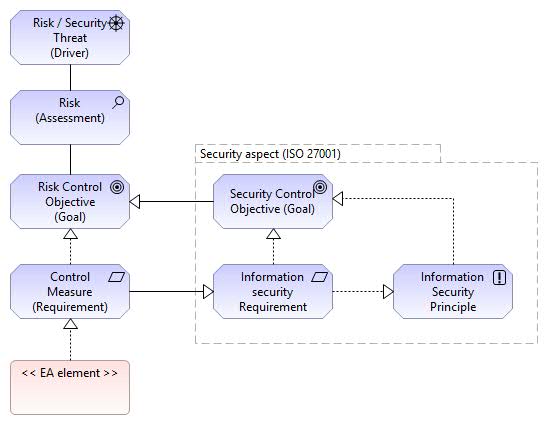
Risk and Security View. Mapping risk and security concepts to ArchiMate. Security and data protection issues are part of risk management. This modeling approach covers both.
References:
- How to Model Enterprise Risk Management and Security with the ArchiMate® Language, The Open Group, Document Number: W172, 2017.
- Modeling Enterprise Risk Management and Security with the ArchiMate® Language, The Open Group, 2015.
SWOT Analysis View
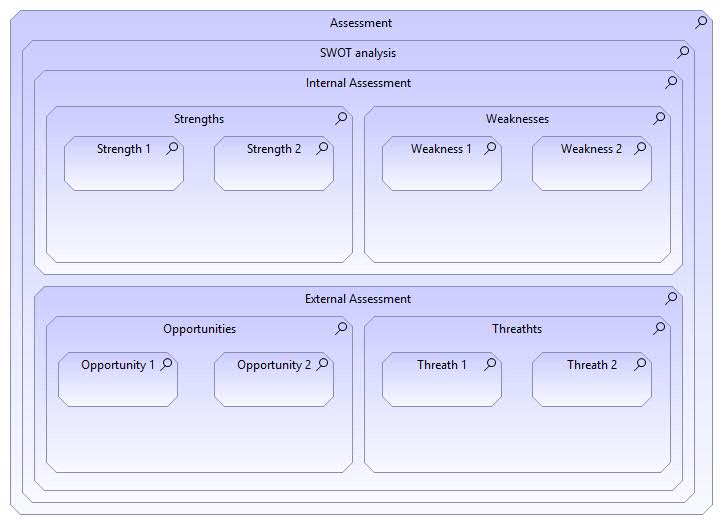
SWOT Analysis View.
Goals View
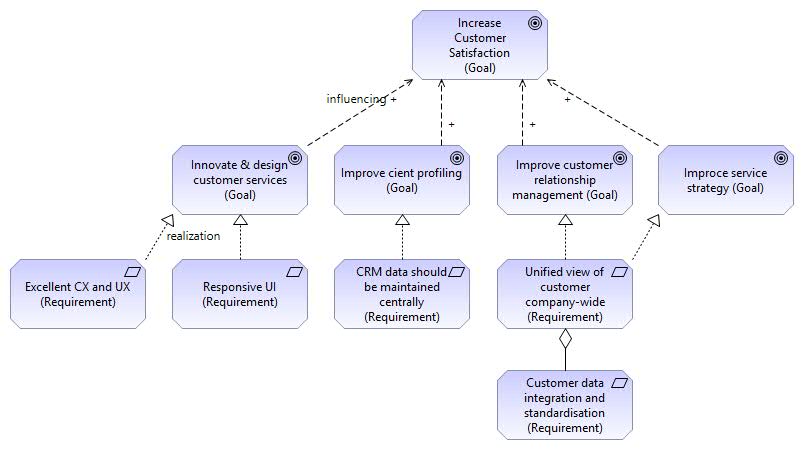
Goals View (with Value element).
Objectives and Key Results
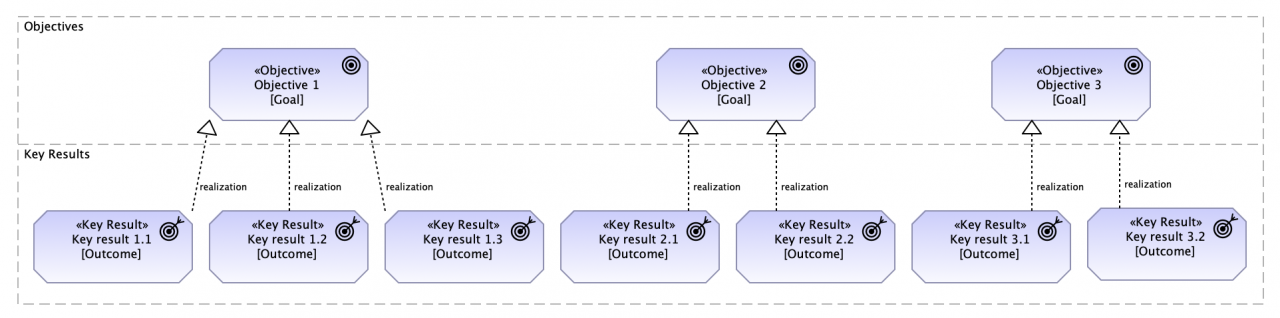
OKR Pattern.
OKR is a popular management strategy for defining objectives and tracking results. It helps create alignment and engagement around measurable goals. OKRs have two important parts: the Objective you want to achieve and the Key Results, which are how you measure achievement of the Objective.
Objective:
- A memorable, qualitative description of what you want to achieve. Objectives should be short, inspiring, and engaging. An Objective should motivate and challenge the team.
Key Results:
- A set of metrics that measure your progress toward the Objective. You should have 2–5 Key Results for each Objective. Not too many, or no one will remember them.
Another version of OKR is shown below.
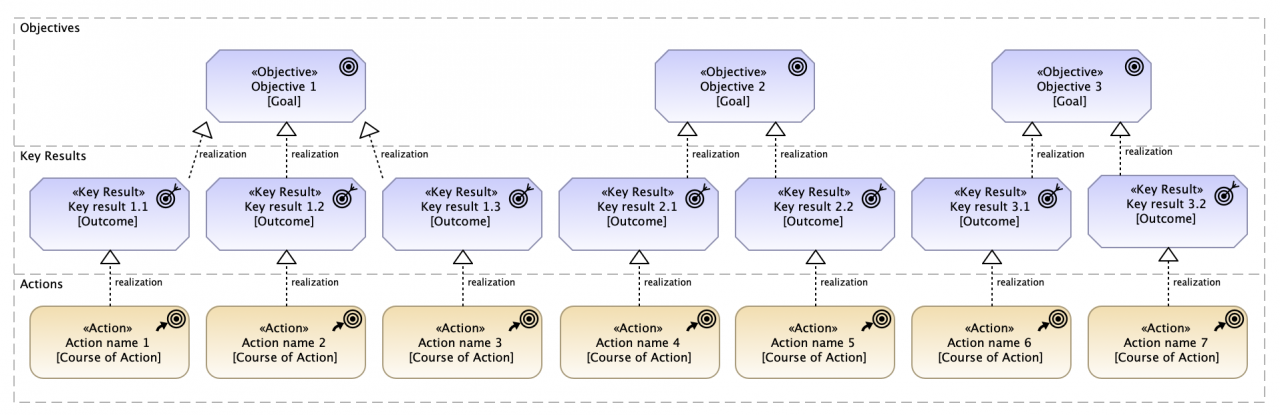
OKR Pattern (2).
Strategy Viewpoint
Strategy Layer View
Strategy View
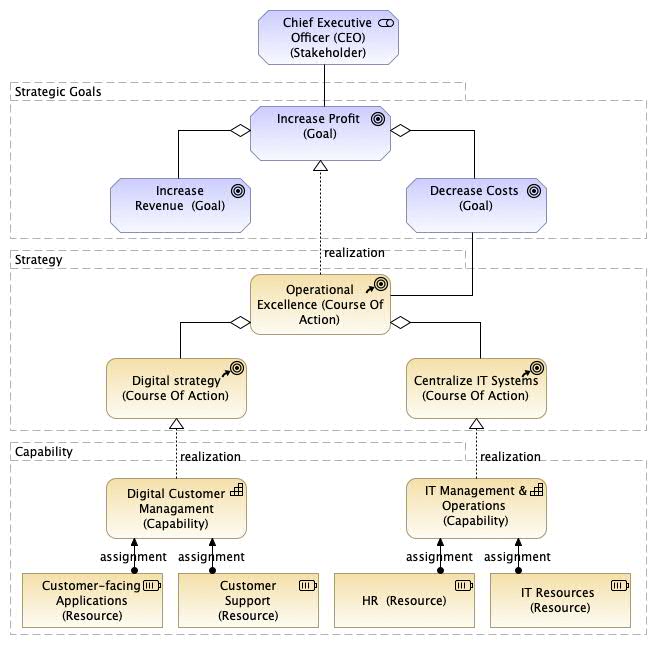
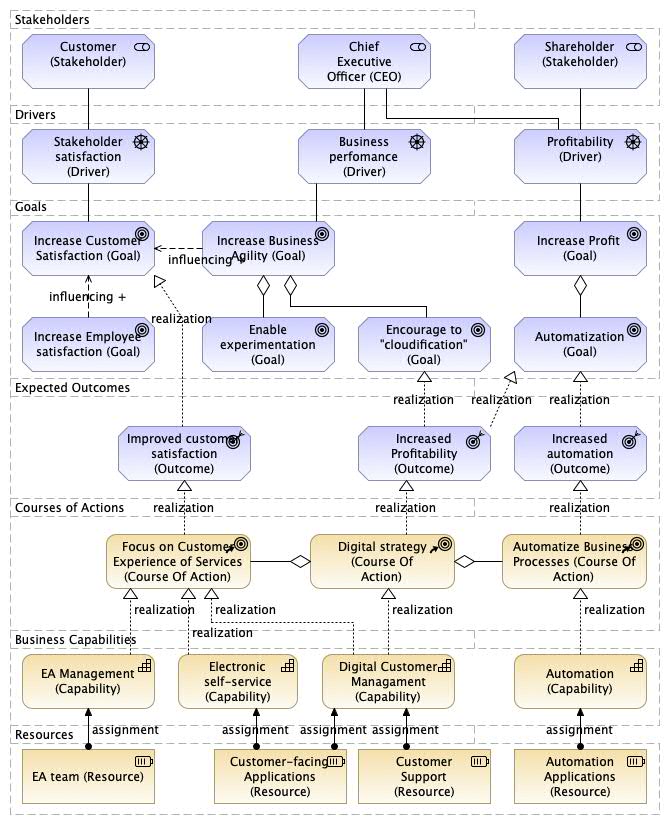
Strategy View.
ArchiMate version 3 now supports concepts related to business strategy, such as “Course of Action”, “Capability”, and “Resource”, which can be used to model an organization’s business strategy. The value and importance of this view lies in the fact that the organization’s goals can be linked to strategy, and how they are linked to enterprise architecture through capabilities. This view can be used to apply “Goal-based Strategic Modeling” (Azevedo et al. 2015), where goals form a hierarchy so that higher-level goals can be decomposed into lower-level goals.
Business Strategy View
Business Strategy.
Business Motivation Model (BMM) View
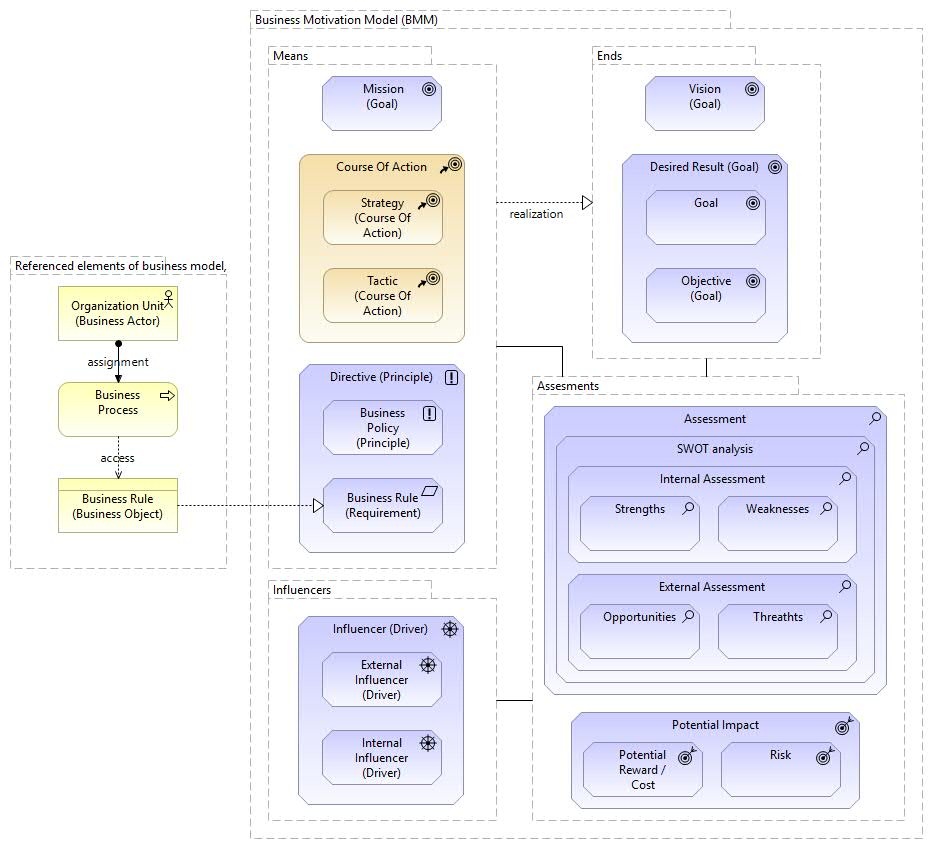
Business Motivation Model (BMM) View.
Requirements View
Requirements View.
This view can be used to collect requirements based on strategic goals. This links strategy to realization: strategy can be traced to execution.
Strategy to Capability View
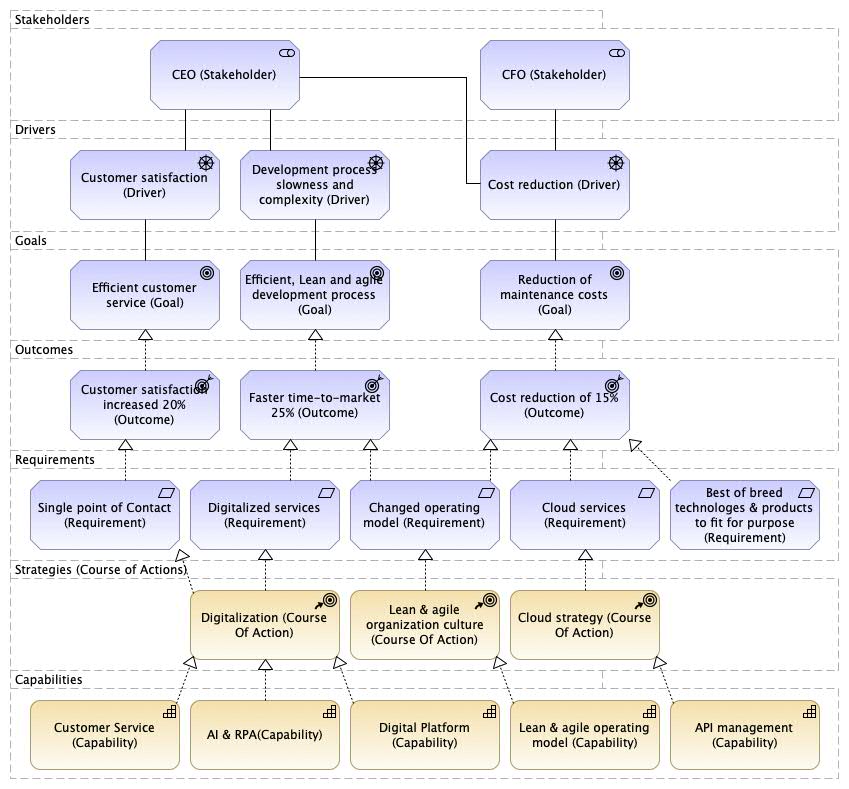
Strategy to Capability View.
This view can be used for e.g. Capability-Based Planning (CBP) purposes, as well as other ArchiMate concepts such as “Driver” and “Goal”, as shown in the figure below. This view can be used to support strategic planning (and execution) purposes. Thus, this view can be used for the Strategy-to-Capability phase, which can be included in IT4IT’s “Strategy-to-Portfolio”.
Capability Map View
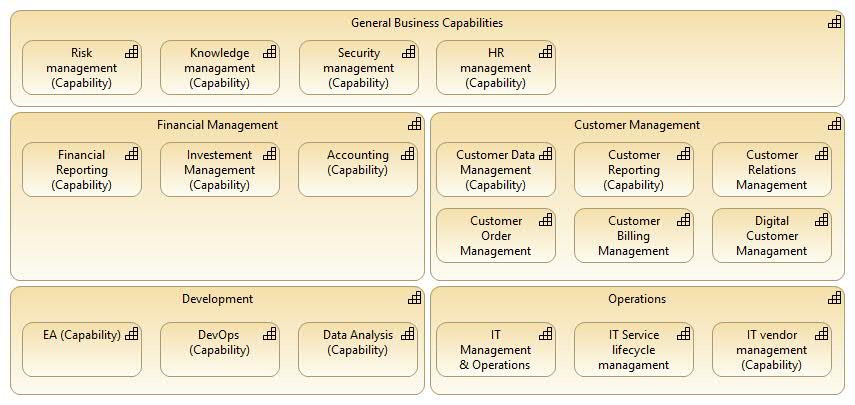
Capability Map View.
This view can be used to give an overview of the organization’s capabilities: what the organization does or can do.
Capability Planning View
Capability Planning View.
This view can be used e.g. for Capability-Based Planning (CBP) purposes, i.e. “the link between strategy and enterprise architecture”. The view can be used e.g. to map strategy to required capabilities, and capabilities to resources and other building blocks.
Capability Realization View
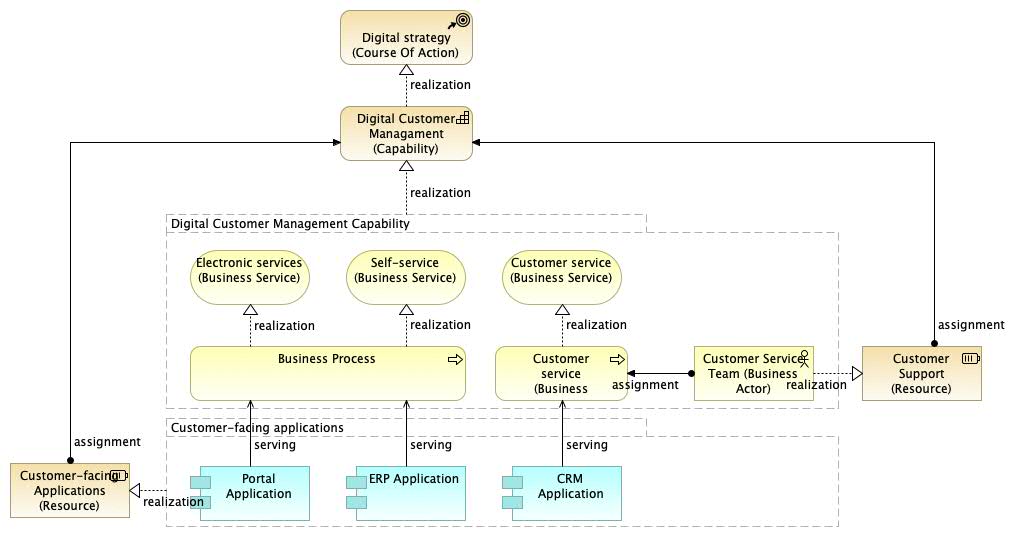
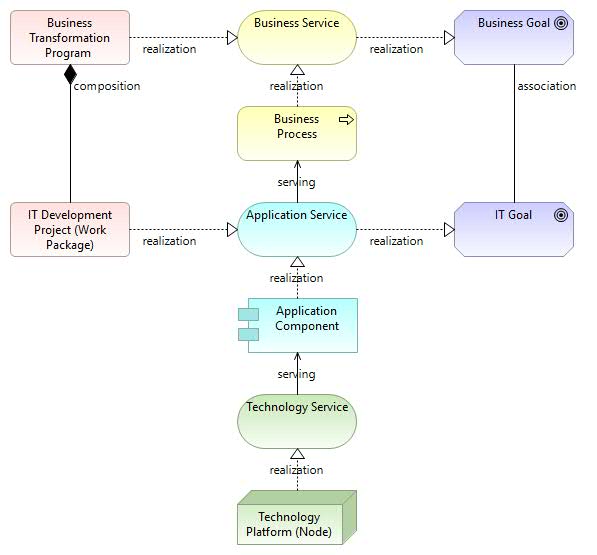
Capability Realization View.
Capability Realization View 2
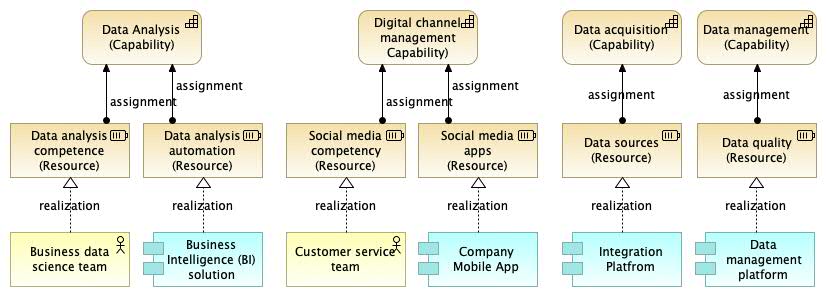
Another view defining how capabilities are realized by which elements…
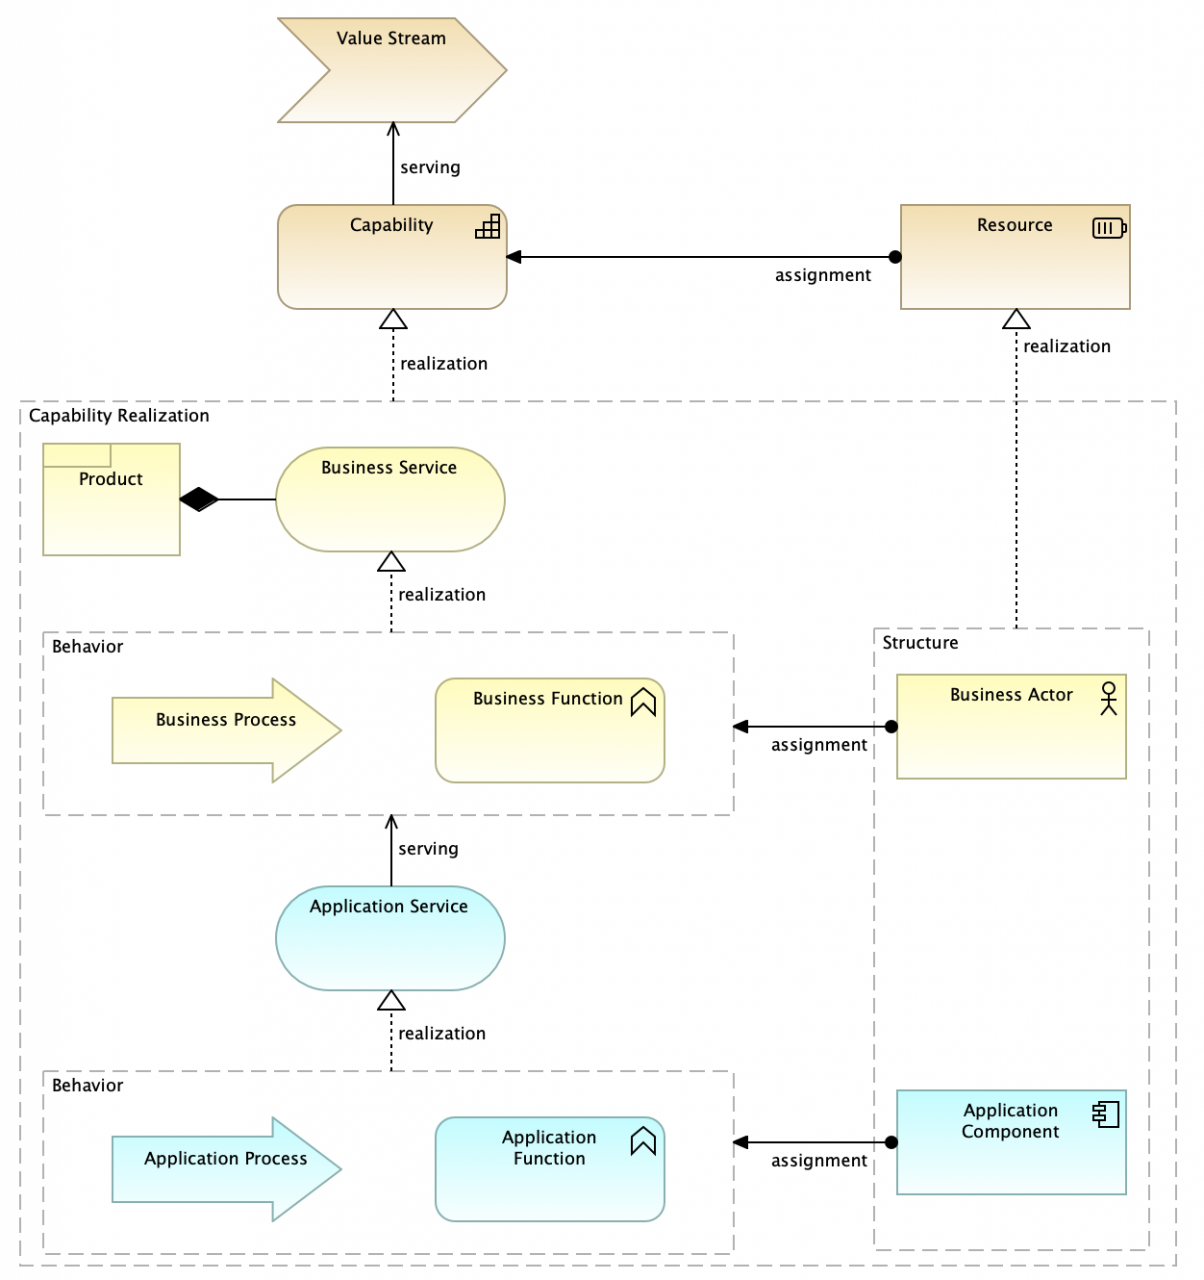
Capability Realization View 2.
Value Stream View
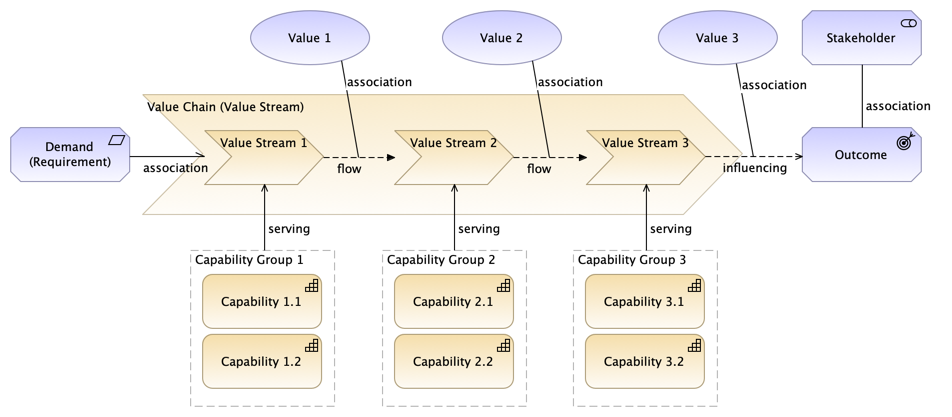
Value Stream View (pattern).
Note! “Directed association” used at the beginning of the value chain / value stream. A value stream can consist of value “stages”. Similarly, an overall, high-level value stream can be a “value chain”, which in turn consists of value streams. For example, IT4IT (link) introduces a value chain that consists of four value streams as follows: Portfolio Strategy, Deploy Demand, Fulfill Request, Detect-to-Correct (link).
Value Stream – Capability Cross-Mapping View
A simple example of a value delivery chain is shown below. Value chains, value networks, and value streams can be modeled using the ArchiMate Value Stream element, included in ArchiMate 3.1 version.
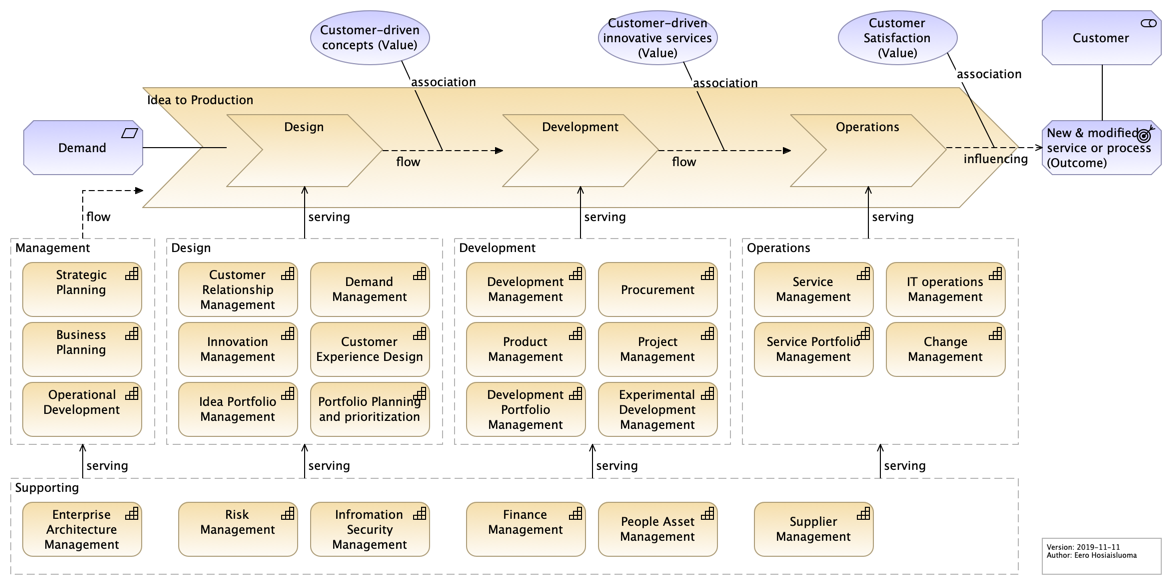
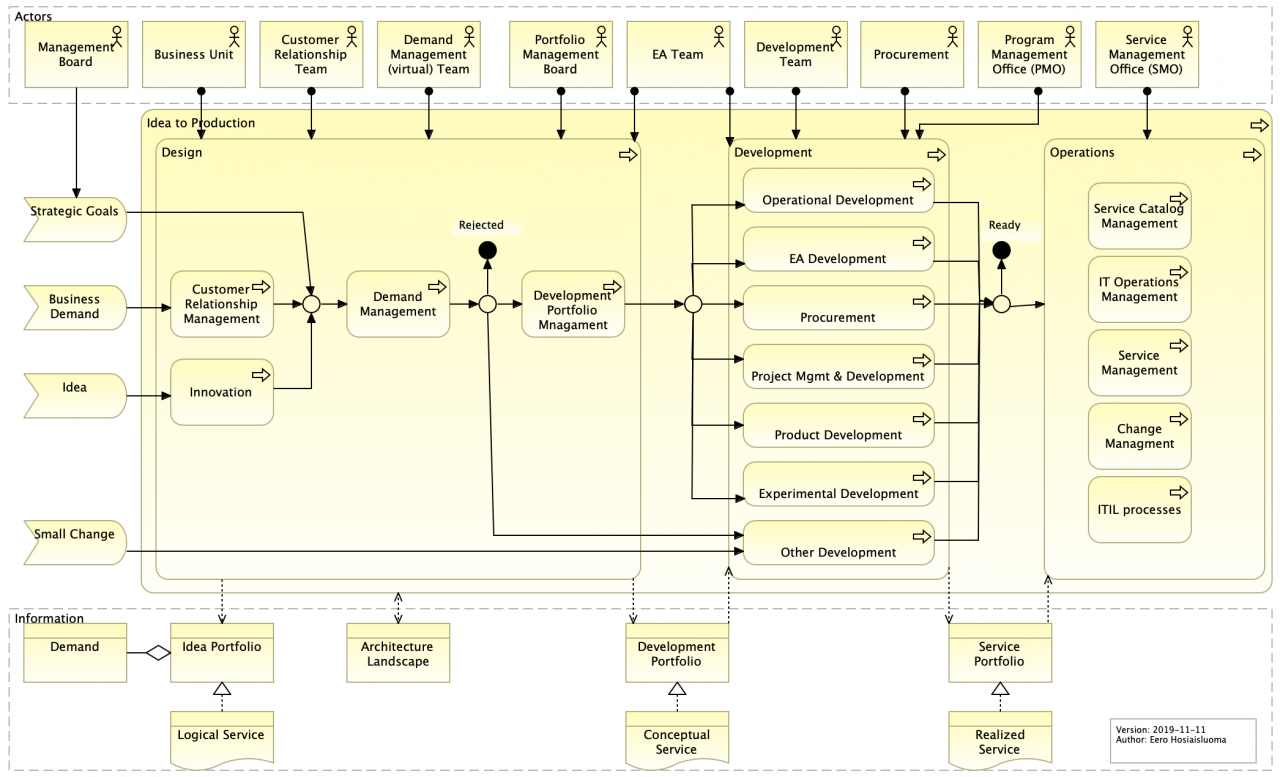
Idea to Production Value Chain Example View.
Value Delivery Chain. This is an extended example that illustrates how functions support (serve) the value stream. This view can be used to define what the organization does (business model), why capabilities are needed, and what their connection is to value creation.
This view is included in the Lean EA Framework (LEAF) reference implementation (link). Navigate to “Value Streams”, “Value Delivery Chain”.
Business Model Canvas View
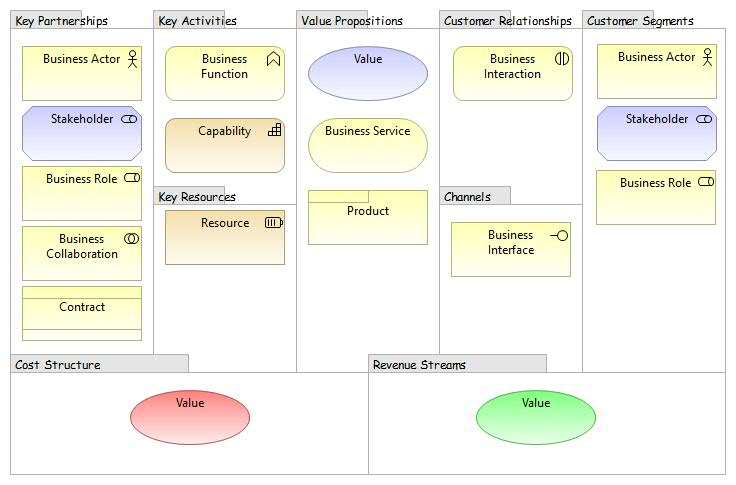
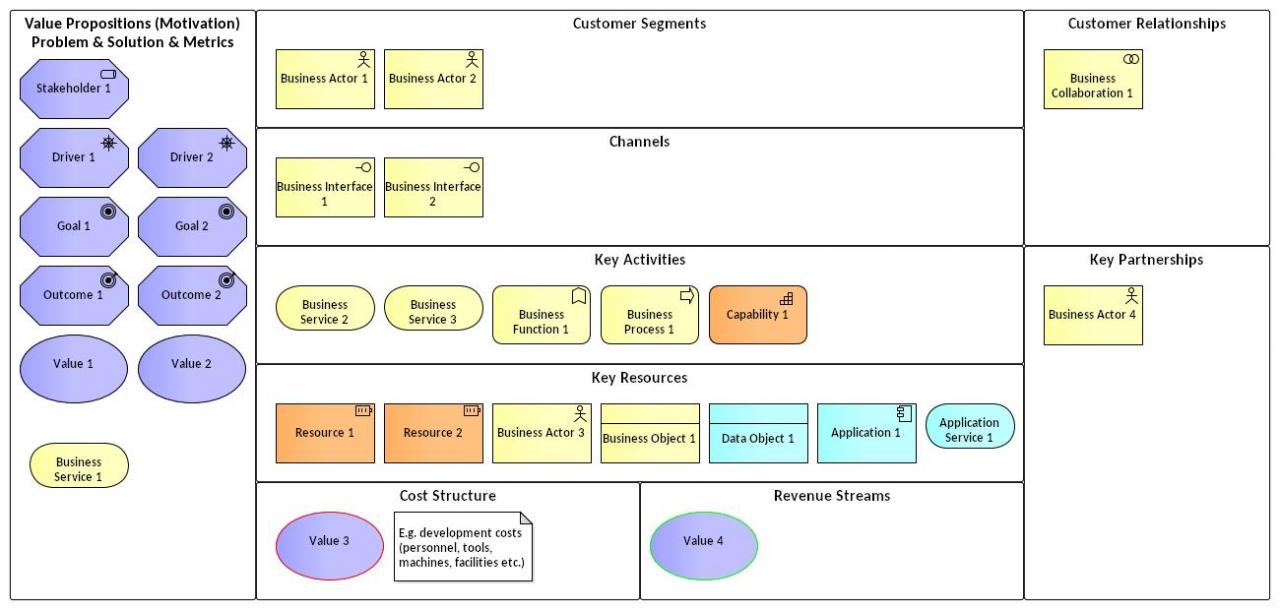
Business Model View.
This is the basic form of A. Osterwalder’s Business Model Canvas (BMC), but it can be varied according to the situation. There are also versioned approaches, such as “Service Model Canvas” or “Lean Canvas”. BMC can be used e.g. for business model design and innovation.
Modeling BMC with ArchiMate “helps trace requirements from business needs to design specifications. This helps discover the impact of business model changes on architectural design.” [LO Meertens et al.]
Overall development includes built-in architectural support for strategy and business model analysis. This enables business analysts and developers to observe e.g. how the business model supports strategy and how the business model adapts to the organization, and vice versa.
If BMC is modeled in a modeling tool, the advantage of this approach is that all elements of BMC can be used in other views in the same model repository. When the business model is pivoted, all changes are immediately visible. Business modelers can create new elements (e.g. services), or utilize all existing elements in the repository (e.g. organizational units or resources).
Concept Canvas View
Concept Canvas. BMC can have different variants, as shown in the figure below. The layout of this Concept Canvas is consistent with ArchiMate’s layered approach.
Business Viewpoint
Business Architecture Layer View.
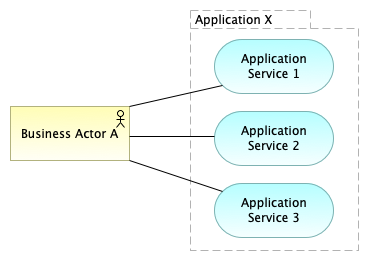
Business Services Map View
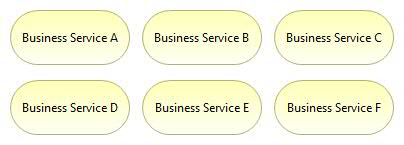
Business Services View.
This view provides an overview of the organization’s business services. This view can be used as a “service catalog” or “service portfolio” for management. It is very important to identify which business services the organization provides to its customers. In addition, business services are the starting point for modeling all underlying organizational processes and structures. Therefore, business services are among the most important elements in enterprise architecture.
Business Processes Map View
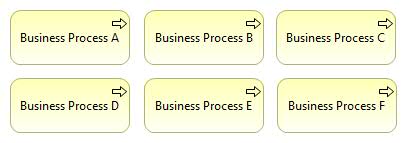
Business Processes View.
This view can be used as a “process map” that provides an overview of the organization’s business processes.
Business Process Co-operation View
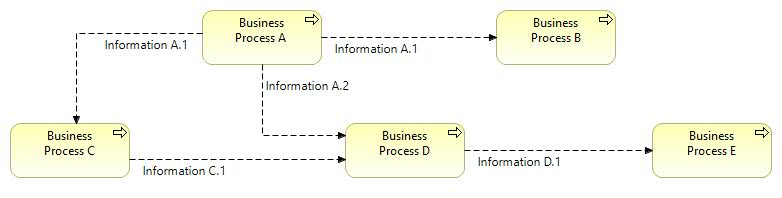
Business Process Co-operation View.
This view can be used e.g. to model operating models.
Business Actors Map View
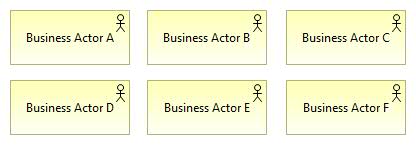
Business Actors View.
Business actors can be a) internal or b) external. Internal business actors are e.g. organizational units, while external business actors are e.g. customers, business partners, or other stakeholder groups that collaborate with the organization (e.g. public sector organizations or other governing bodies).
Business Actor Co-operation View
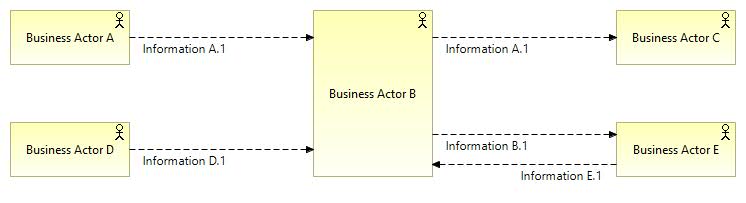
Business Actor Co-operation View.
Two use cases are as follows:
- Intra-Enterprise View: Business Actor Co-operation Viewpoint describing how internal business actors cooperate and how they exchange information.
- Inter-Enterprise View: Ecosystem viewpoint depicting the operating environment in which the organization operates. An ecosystem is a network of organizations and business partners that collaborate through collaborative interactions. There are suppliers, subcontractors and other B2B partners, customers, etc.
Business Process View
Business Process View.
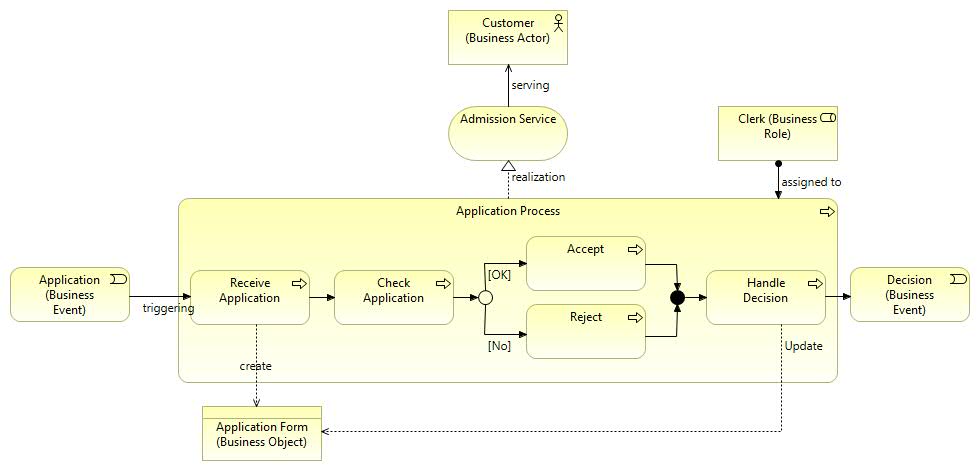
This business process view provides a “high-level structure and composition of one or more business processes (or parts thereof), where services are provided, actors are assigned to roles, and information is used by business processes” [ArchiMate 2.1 specification]. The process diagram contains “Junction” elements used to model “fork” and “join” in process flows.
A high-level process view is shown below. This is based on the operating model derived from the business model, as shown in the value stream diagram above.
Idea to Production Process.
SIPOC (Suppliers, Inputs, Process, Outputs, Customers)
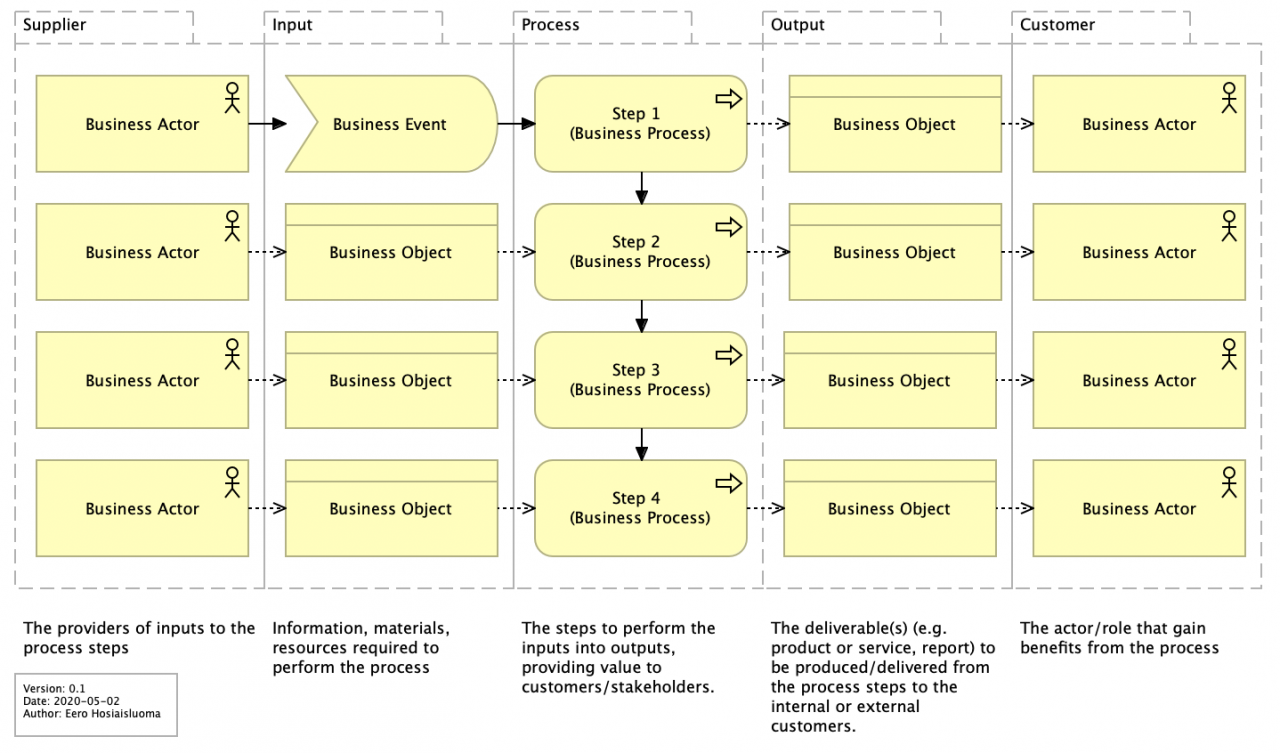
SIPOC.
The Six Sigma tool called SIPOC (Suppliers, Inputs, Process, Outputs, Customers) can be used to define elements common to all processes. This is a simple tool for analyzing business cases: what value does the customer receive and how is it received.
Business Process View with Business Roles as Process “Swimlanes” – Layered Approach

Business Process Swimlane View (pattern) 2.0.
“Business Role A” represents the customer, while the topmost “swimlane” represents the customer journey path.
Note! Process steps (activities) are nested inside business roles (visualized as “swimlanes”), which means: these business roles are assigned to these business processes/process steps. Therefore, this view is a combination of a business process view and a layered view.
The version below illustrates information and data flows (flow relationships). The topmost “swimlane” represents the customer journey path (activities related by triggering relationships).
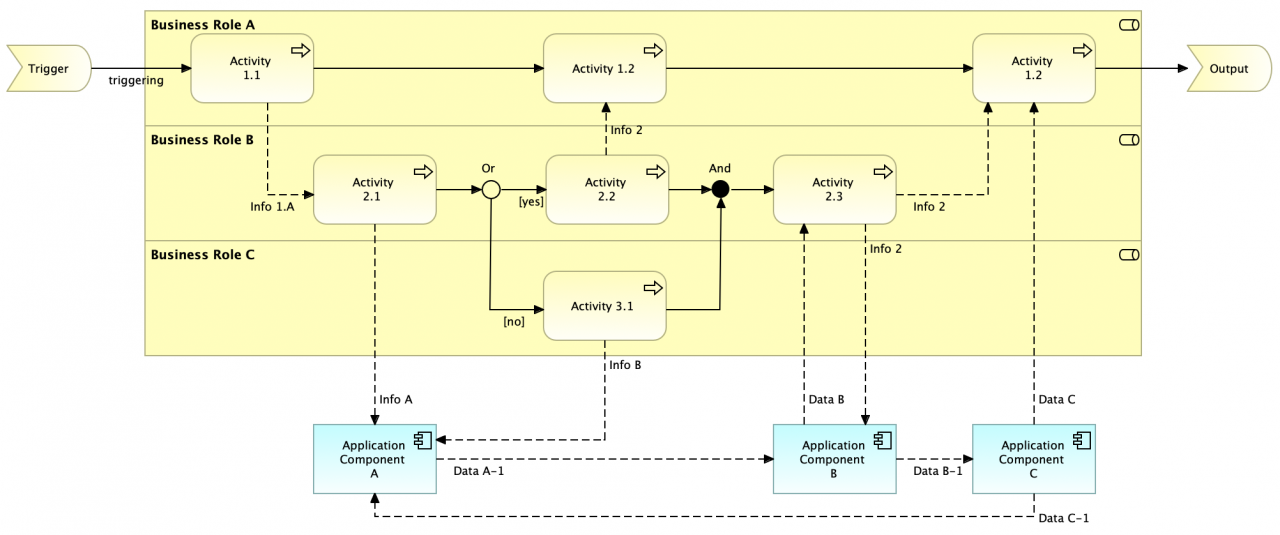
Business Process Swimlane View (pattern) 2.0 (information flow).
The version below represents a service design approach. The topmost “swimlane” (Role A) represents the customer journey path, which is connected to the organization (Roles B and C) through business services (1 and 2).
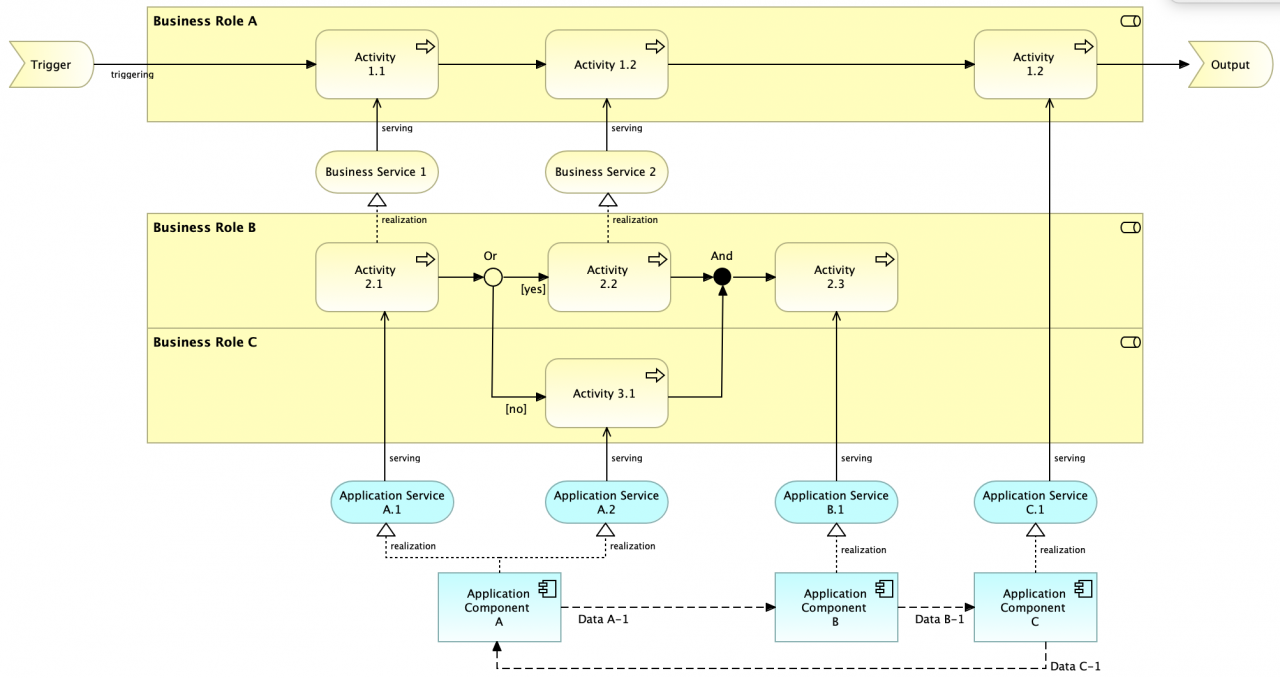
Business Process Swimlane View (pattern) 2.0 (services).
Layered Business Process View
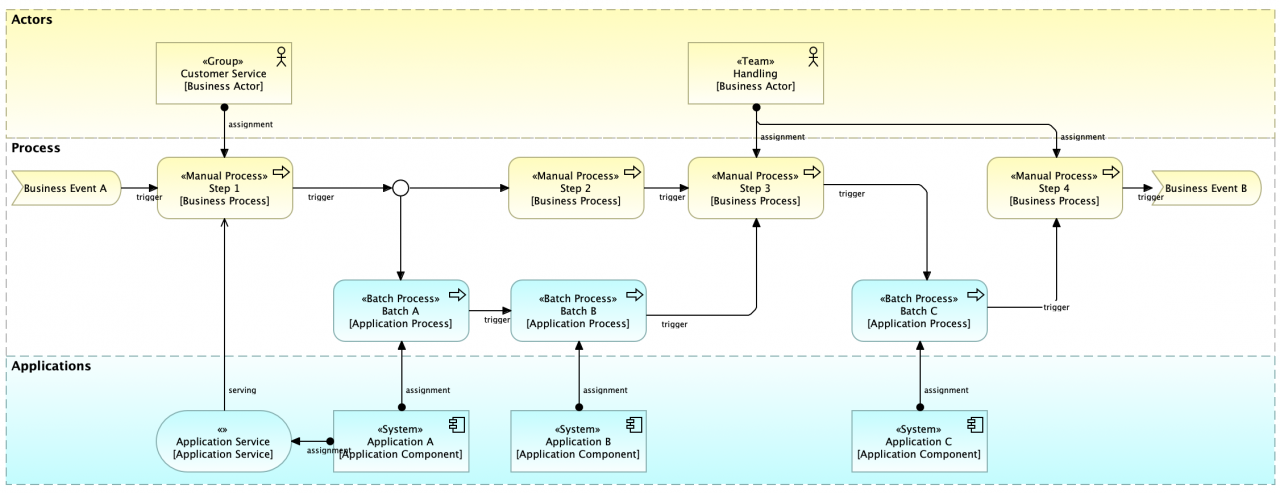
Layered Process View.
This view can be used to model business processes that include both manual and automated steps.
Customer Journey Map View
When analyzing customer journeys at a high level, this version is created using motivation and strategy elements.
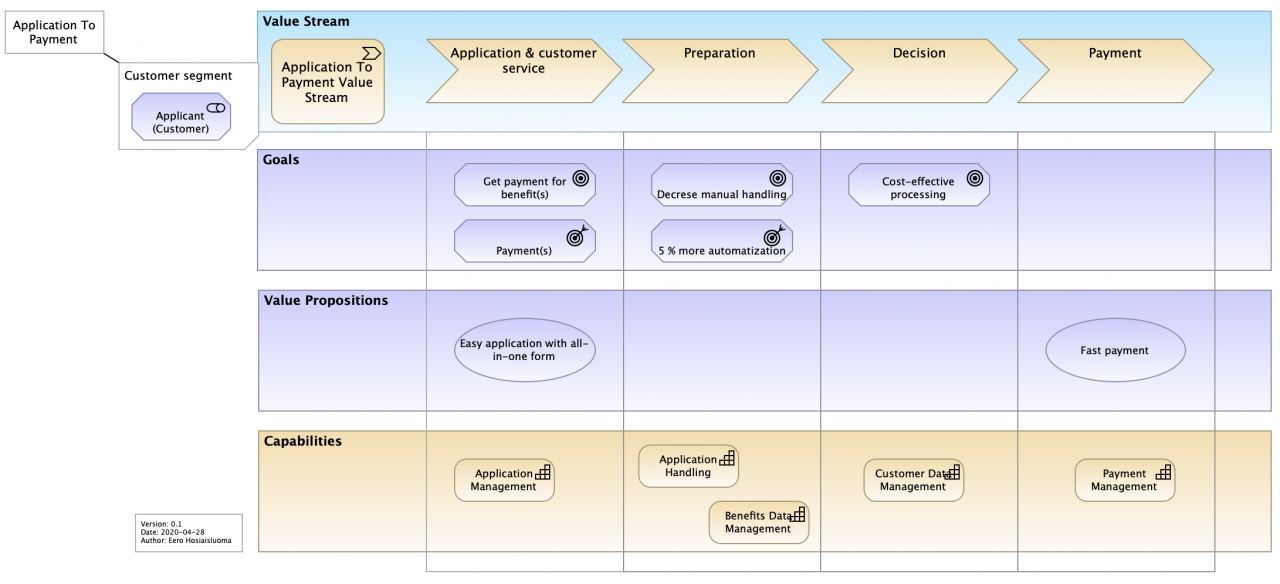
Customer Journey Map (high-level).
When analyzing customer service paths in more detail, this version is created using business and application layer (core) elements.
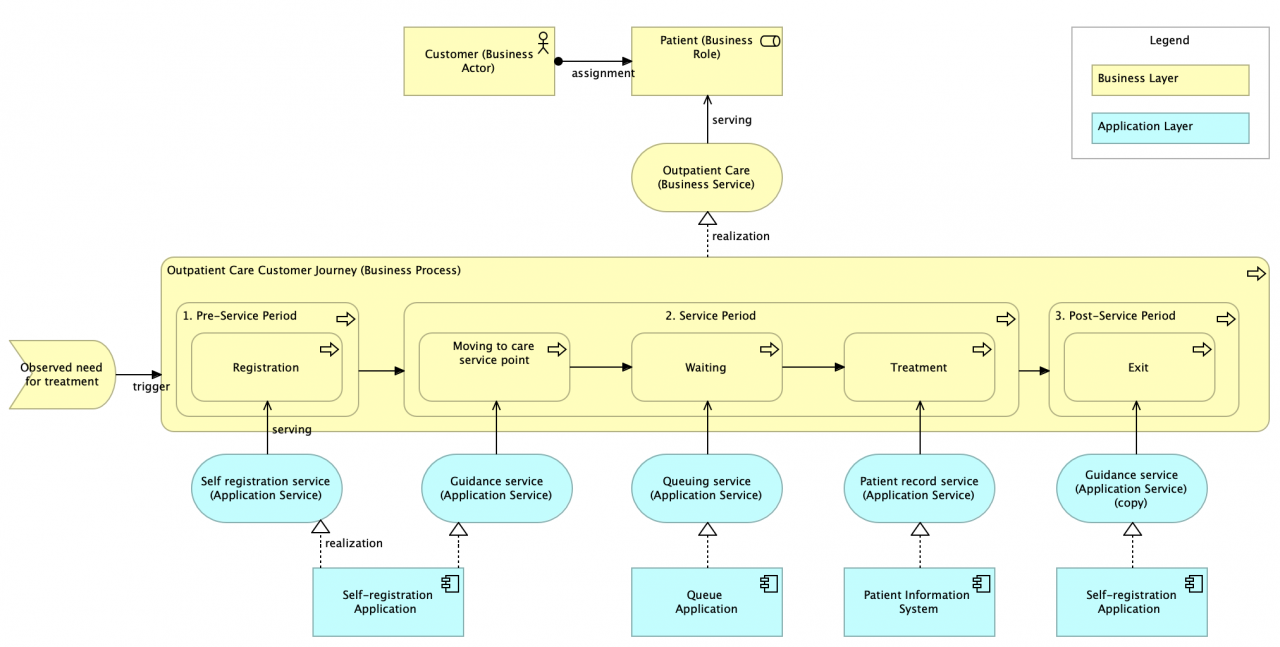
Customer Journey View (example) 1.0.
This customer-centric view focuses on the customer experience. This “outside-in” development approach related to “service design” emphasizes the important aspect that services and products are created to deliver value to customers — and indirectly to the organization itself. Customer journey paths can be used to visualize customer value streams that span multiple application services and applications.
Service Blueprint View
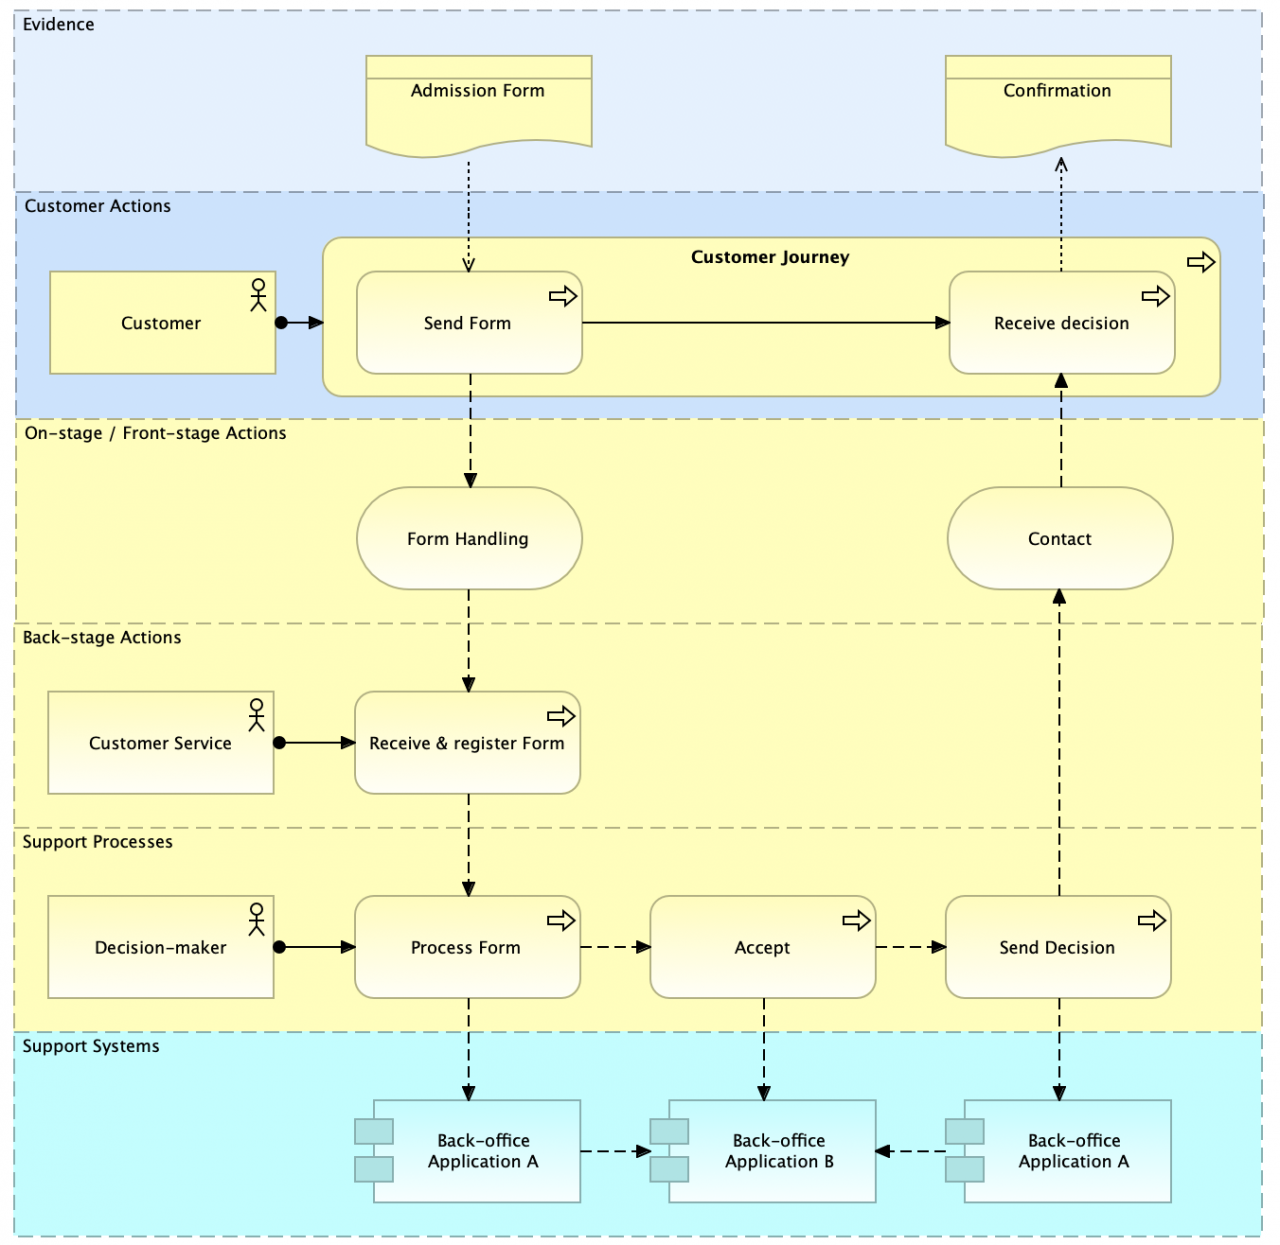
Service Blueprint View 1 (services and flows)
This view is customer- and service-centric, but it also emphasizes the “inside-out” part of the service. With the help of this approach, service-driven development can identify potential behavioral and structural impacts on the services to be designed. Therefore, this view complements the customer experience-driven approach through process and functional aspects.
This view has several variants. The example above focuses on information flows between layers and elements.
User Story View
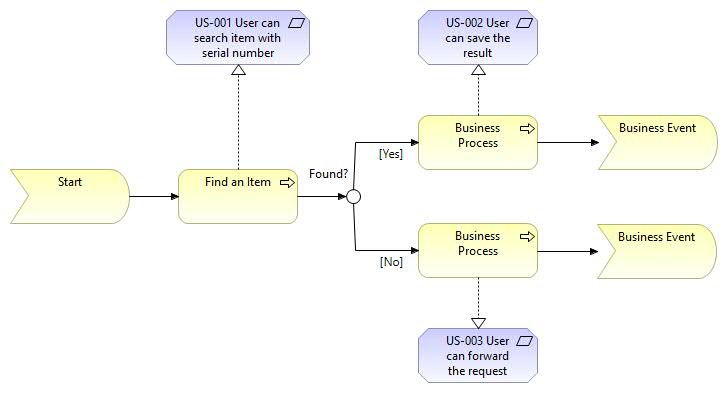
User Story View.
This view can be used to visualize user stories.
Cloud Service Models View
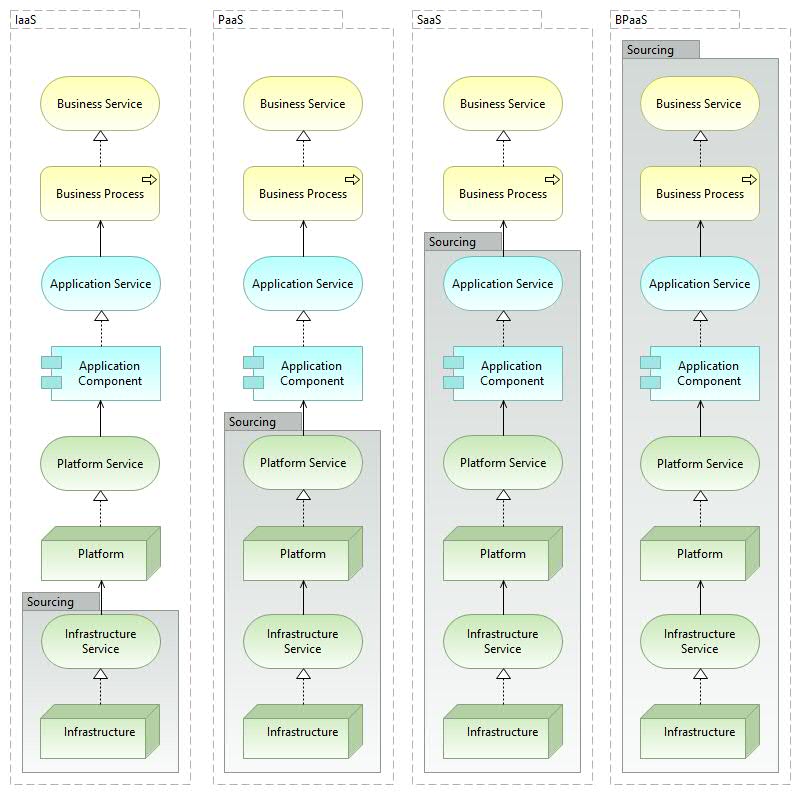
Cloud Service Models View.
Information View
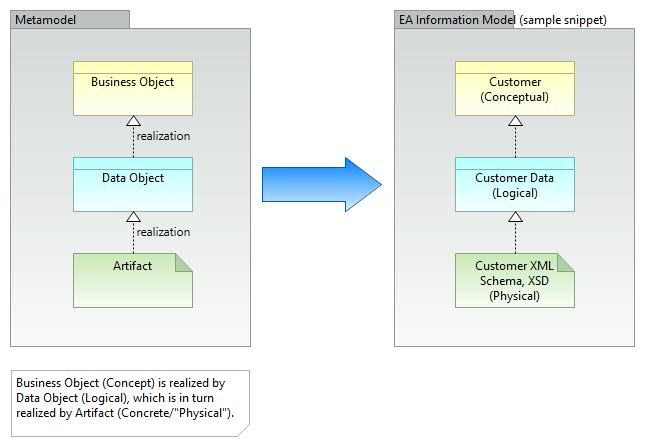
Information View.
Information can be modeled at different levels of abstraction as follows: a) conceptual, b) logical, and c) physical levels. The figure above illustrates these abstraction levels.
Conceptual Data Model View
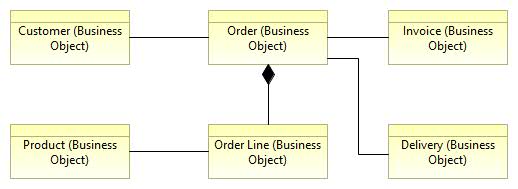
Conceptual Data Model View.
The information architecture of EA includes business objects used in business processes, i.e. concepts. These concepts and their relationships can be represented in a conceptual data model.
“Service” Concept
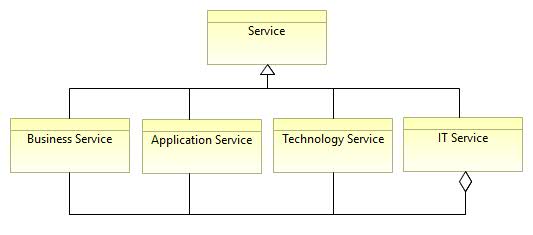
Service Concept.
The service concept is often problematic and can be understood in many different ways. To clearly distinguish the types of services involved, it is good practice to mention the prefix: business service, application service, or technology service. According to ITIL, IT services relate to production services. Like this. IT services most closely map to application services.
Service vs Product
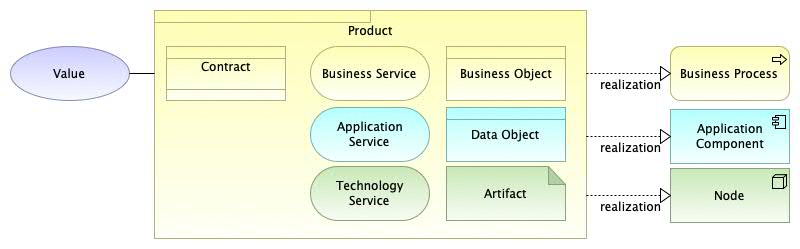
Product View.
The product concept can be used as a composite element for grouping services. According to the ArchiMate specification:
“A product represents a collection of coherent services and/or passive structure elements, accompanied by a contract/agreement set, offered as a whole to (internal or external) customers.”
“A product may aggregate or compose business services, application services, and technology services, business objects, data objects and technology objects, and contracts. Thus, a product may aggregate or compose elements from layers other than the business layer.”
“Value may be associated with a product. The product name is typically the name used in communication with customers, or it may be a more generic noun (e.g., ‘travel insurance’).”
Application Viewpoint
Application Architecture Layer View.
Application Services Map View
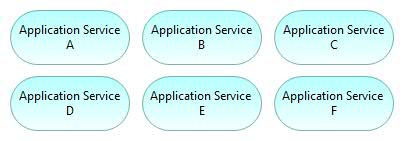
Application Services View.
Applications Map View
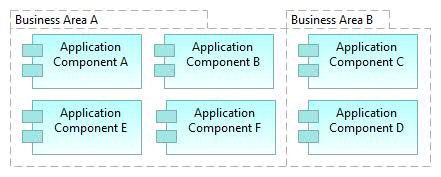
Applications Map View.
Application portfolio, where applications can be grouped by business unit.
Application Co-operation View (Data Flows)
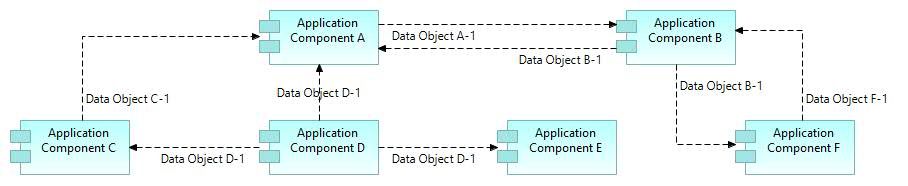
Application Co-operation View.
Application Integration View (Dynamic Relationships)
Several alternative ways to model data switching between applications are shown in the example below (1 to 10).
- “Application A” owns data object “A-1” requested by “Application B”.
- Data flows from “Application A” to “Application B”.
- “Application A” realizes service “A-1” used by “Application B”.
- In practice, “Application B” requests application interface “A-1” and gets a response…
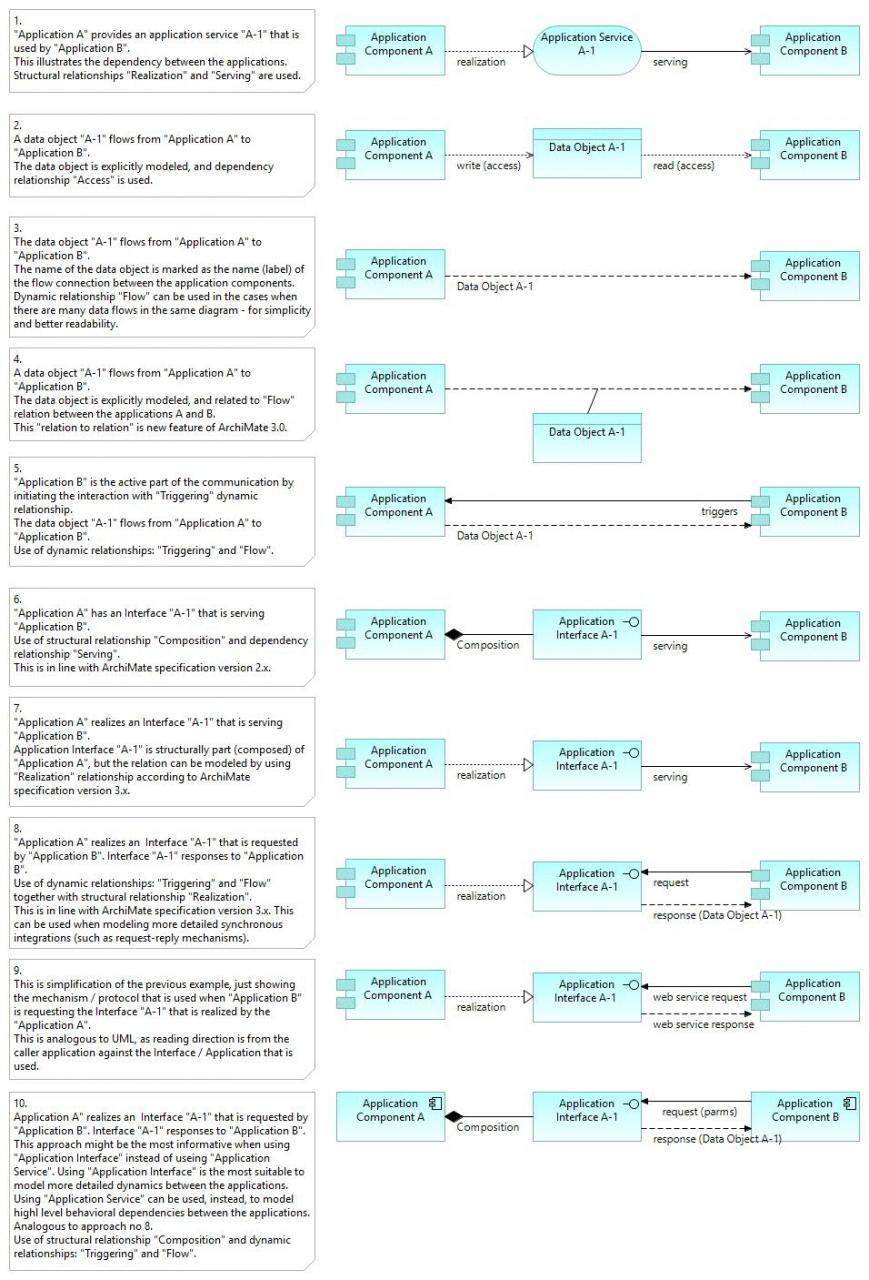
Application Integration View.
Application Structure View
This view helps design or understand the main structure of an application and its sub-components and related data. The diagram can be used to decompose the structure of the application system being built to illustrate modularity/decomposition: what are the subsystems/sub-components, what application services (or application interfaces) do they provide.
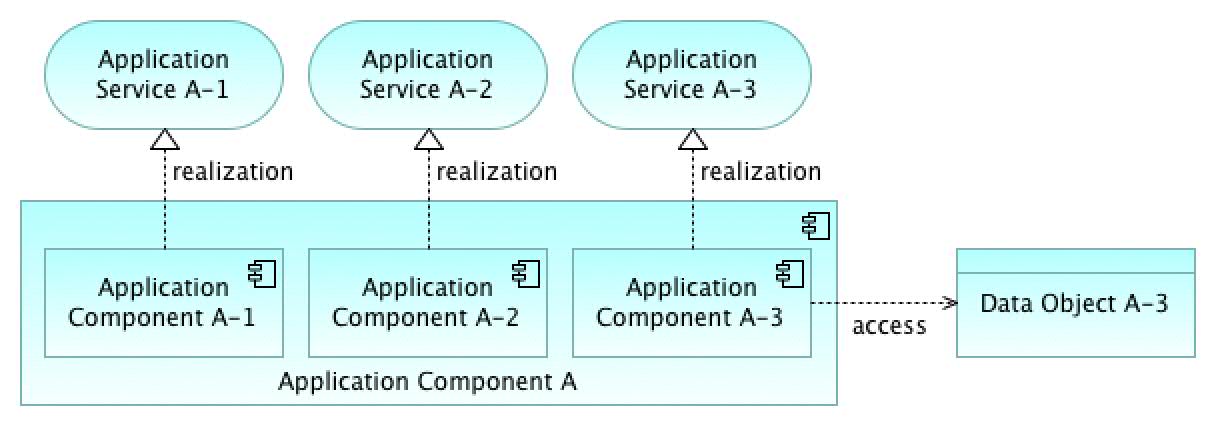
Application Structure View.
Note that application services (top figure) are behavioral functionalities provided by structural interfaces (GUI and/or API in the bottom figure). Application services and application interfaces are “two sides of the same coin”.
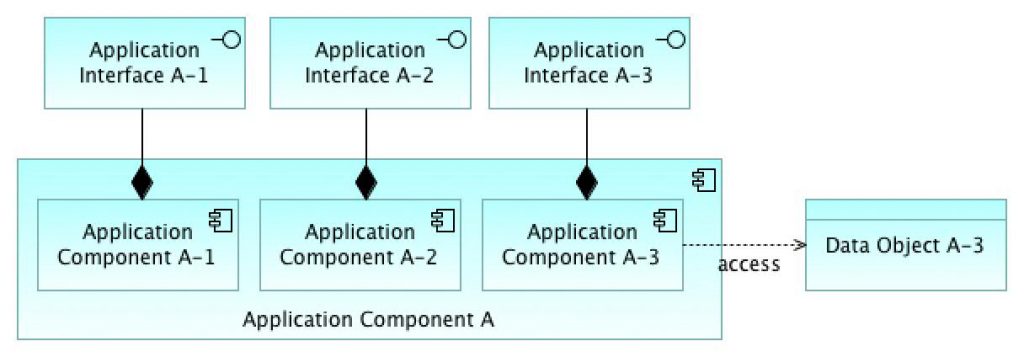
Application Structure View 2.
Application Architecture View
This view mixes EA-level and solution-level approaches, as both applications and application modules exist in the same view.
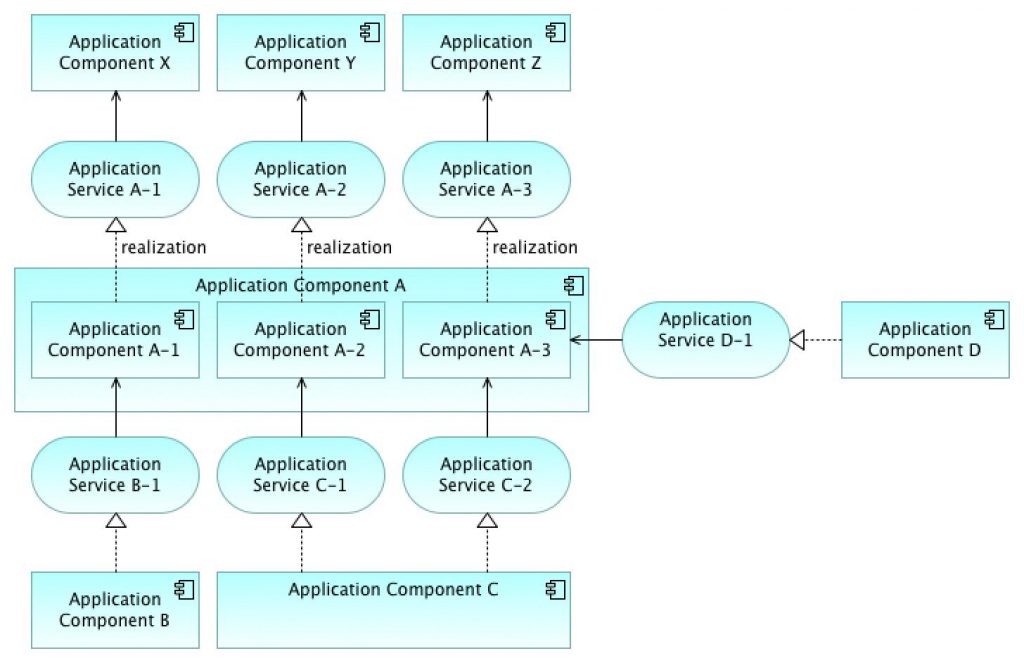
Application Architecture.
Application Component Model (CM)
Application Component Model 0-n is an application architecture modeling method consisting of diagrams at different levels of abstraction as follows:
- At CM-0 level, the diagram describes how the target application interacts with its environment and what interactions exist with adjacent applications and users. The target application is described as a black box.
- At CM-1 level, the target application is decomposed into modules (main components), and which application services (or application interfaces) these modules provide and require. The target application is described as a white box.
- At CM-2 level, modules are decomposed into sub-components. (The number of levels needed depends on the situation.)
The Application Component Model (CM) diagram below consists of application components and application services. Alternatively, application interfaces can be used instead of application services, depending on the situation. As always, it is important to use a modeling style that is fit for purpose and model only those elements that provide sufficient information and add value. This depends on the modeler — whether he or she prefers to emphasize functional aspects or be more specific and model e.g. actual interfaces with precise names.
The component model diagram below consists of application components and application services. Alternatively, application interfaces can be used instead of application services.
Application Component Model – 0 (CM-0)
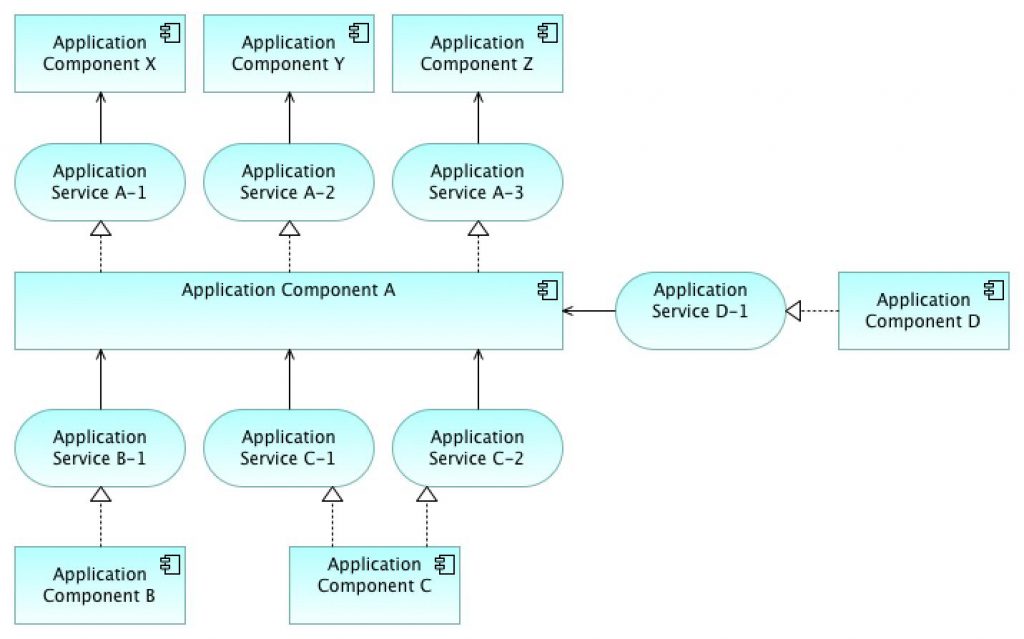
Application Component Model – 0.
Component Model – 0 (CM-0) level (above) illustrates the interaction between the target application and adjacent applications. All relevant application services (or application interfaces) are introduced. The level 0 diagram consists of enterprise architecture layer components and their services, with the target application in the middle.
Application Component Model – 1 (CM-1)
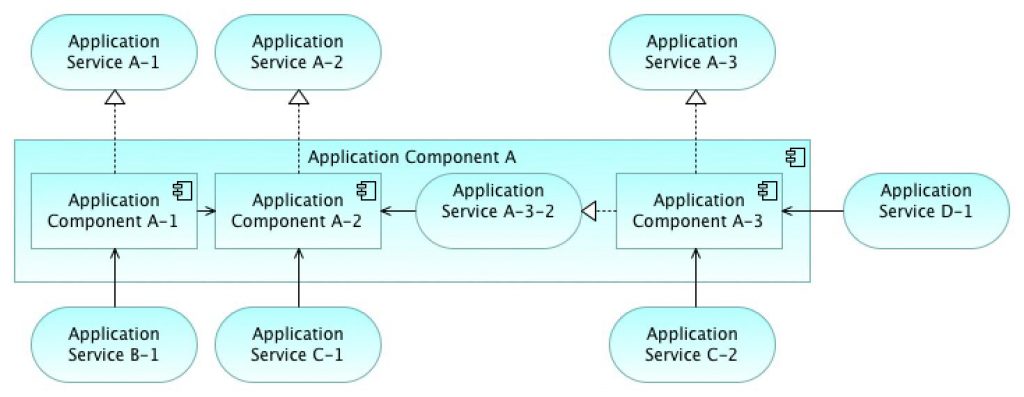
Application Component Model – 1.
Component Model – 1 (CM-1) level (above) illustrates how the target application is decomposed into modules (or main components), and which application services (or application interfaces) each module realizes. Note! External applications can be excluded from this level, but their services (or interfaces) are shown. When showing more low-level elements, more high-level elements can/must be omitted – for simplicity: keep the diagram readable.
Application Component Model – 2 (CM-2)
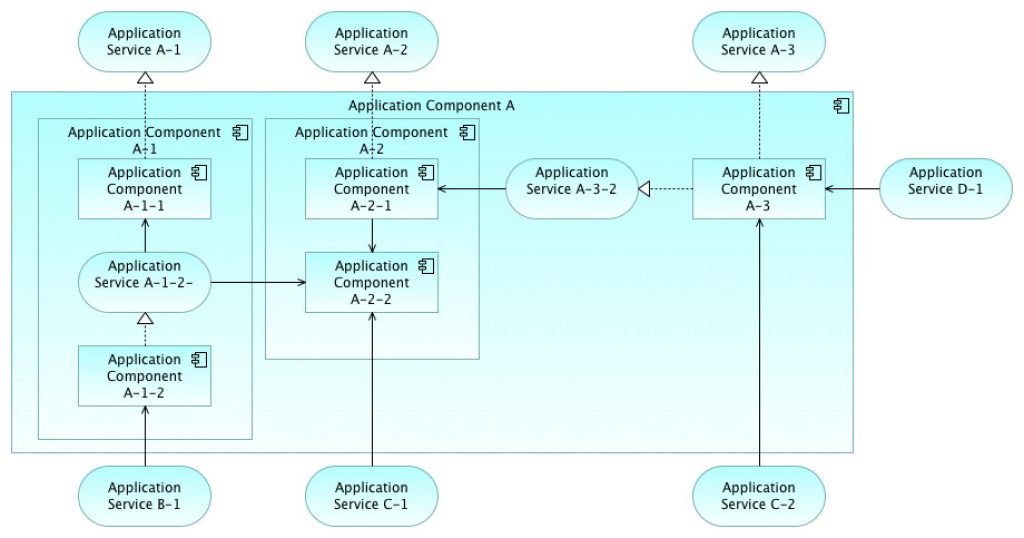
Application Component Model – 2.
Component Model – 2 (CM-2) level (above) illustrates how modules of the target application consist of sub-components and how they interact.
Application Function View
Application function decomposition: what functions does the system contain and what application services does it provide?
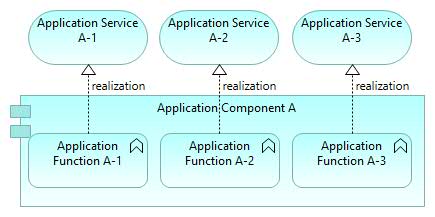
Application Functions View.
Application Process View
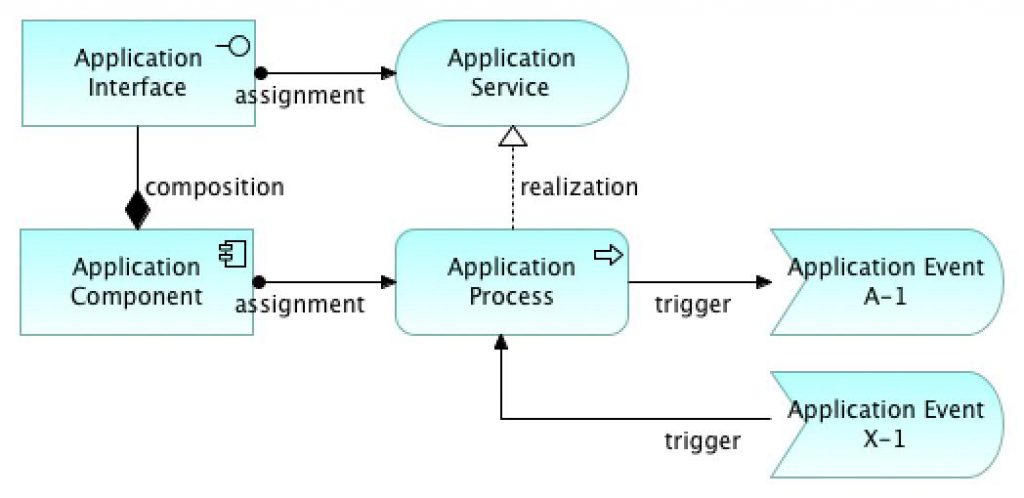
Application Process View.
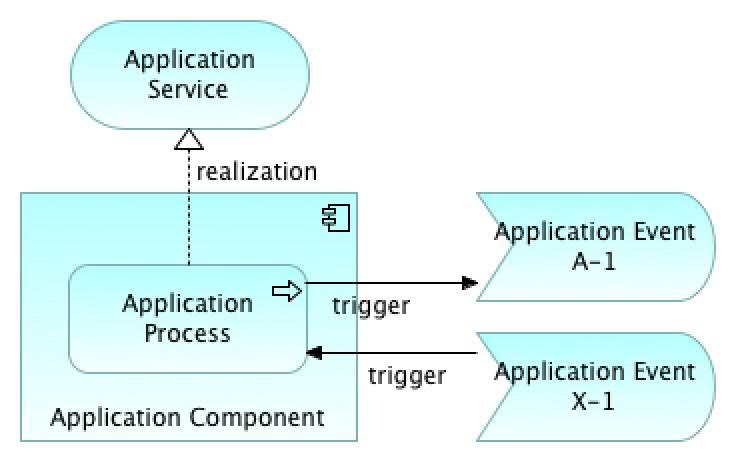
Application Process View – nesting.
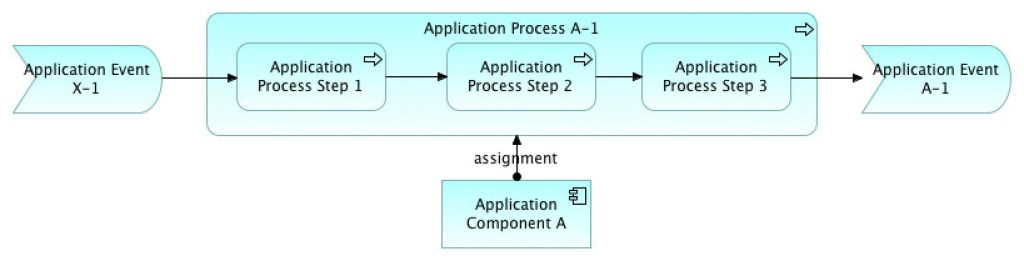
Application Process View – internals.
Application Component Sequence Diagram View
Sequence diagrams are not fully within the scope of ArchiMate, but within UML. However, we can model e.g. the sequence of actions taken by application components using ArchiMate as shown below.
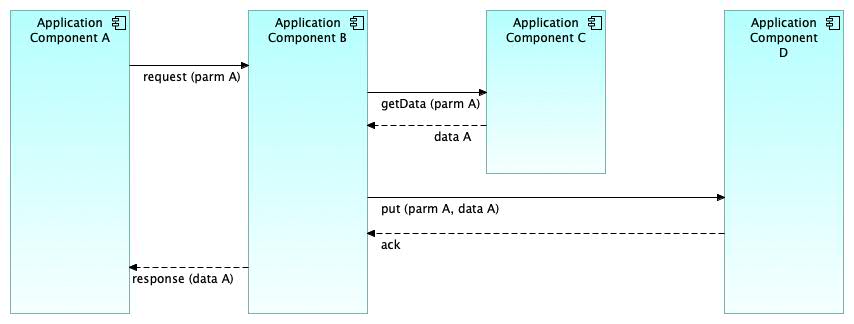
Application Sequence View.
Dynamic relationships “Trigger” and “Flow” can be used to model dynamics between application components. The layout of this view can resemble a UML sequence diagram positioning.
Application Component Sequence Diagram View 2
This version (below) illustrates how ArchiMate can be used to model the sequence of actions taken by internal parts of application components. Internal parts are e.g. a) behavioral processes or functions and b) structural sub-components. These are modeled with Application Process, Application Function, and Application Component elements. These are shown here only as alternatives.
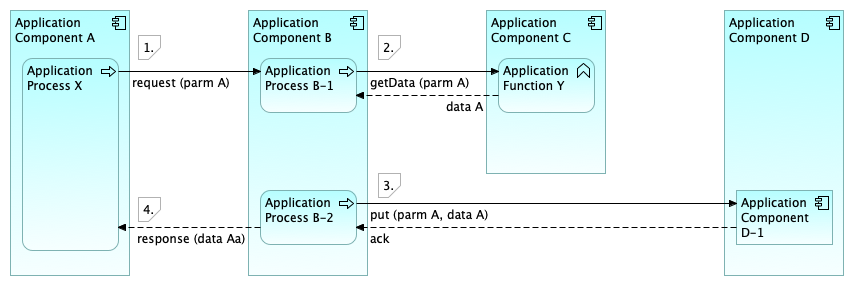
Application Sequence View (2).
The flow of operations in this sequence diagram (above):
- Sub-process “X” of Application Component “A” sends a request message with parameter “A” to Application B.
- Sub-process “B-1” of Application Component “B” receives the incoming request and then (synchronously) calls Application Component C, where Application Function “Y” receives the request, performs some operations, and responds.
- Another sub-process “B-2” of Application Component “B” sends a message with parameters to Application Component D and receives acknowledgment. Application Component “D” contains sub-components that perform processing.
- Application Component “A” receives a response message from Application Component B.
As shown here, we can model quite complex integration cases by combining these elements (Application Components, Application Processes and Application Functions and relationships (Trigger, Flow)). UML sequence diagrams have their specialized use in software design, but ArchiMate can be utilized for many modeling purposes – also for application design.
Application integration is one of the most important parts of Enterprise Architecture (EA). That’s why it is beneficial if we can model in more detail how applications switch data and what interaction mechanisms are used. A good resource for deeper understanding of integration patterns is the book “Enterprise Integration Patterns”, here is the link.
The final user sequence added (below) follows the same idea of using ArchiMate dynamic relationships Trigger and Flow, which can be used to model synchronous and asynchronous messaging patterns (request-response and callback, as well as publish-subscribe, etc.).
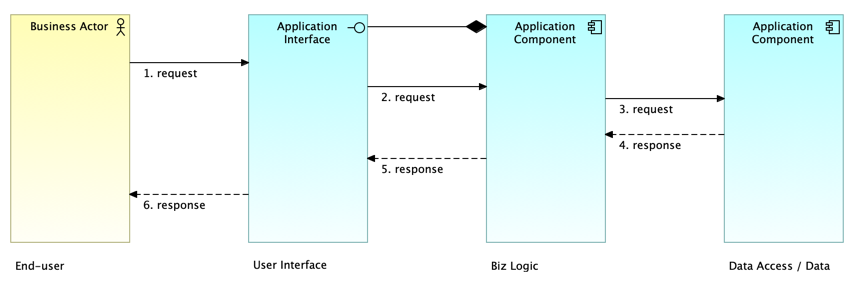
Sequence Pattern View.
ETL Process View
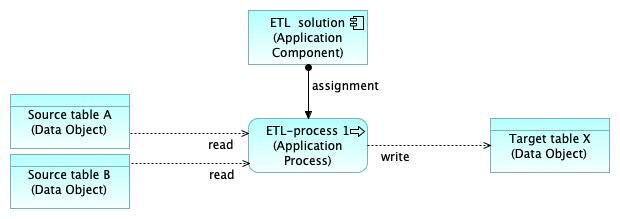
ETL Process View.
EAI / ESB View
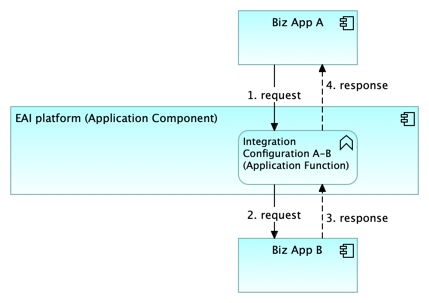
EAI – ESB Pattern View.
Layered View
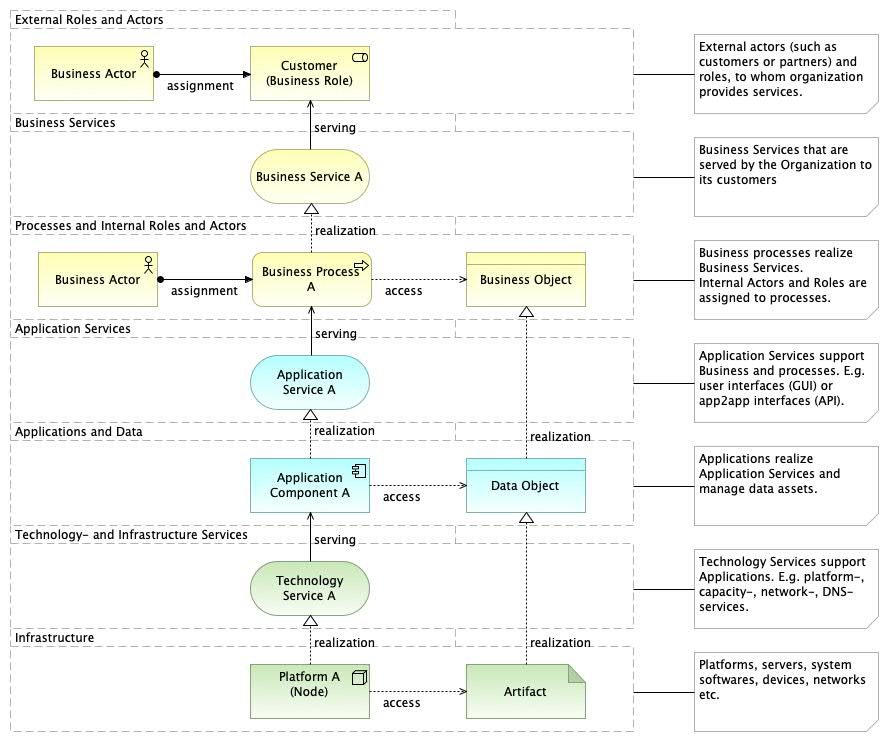
Layered View.
The layered view can be used as an overview context diagram of the target area. The main advantage of this view is to illustrate the usage of applications in the business processes and services they provide. The figure above uses ArchiMate Grouping element to model different layers, while the figure below uses the visual Group element provided by the tool (Archi).
In ArchiMate, there are basically three (3) layers as follows: 1) Business layer, 2) Application layer, and 3) Technology layer. Their colors are usually as follows: Business layer is yellow, Application layer is turquoise, Technology layer is green (see ArchiMate Core Framework, link).
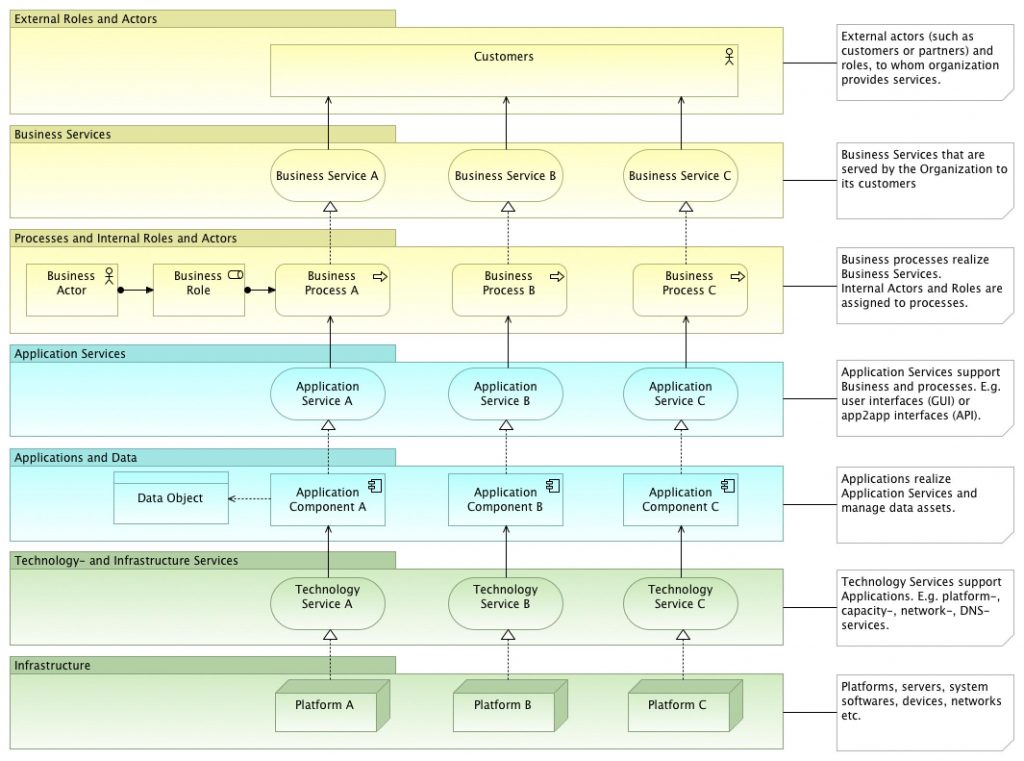
Layered View.
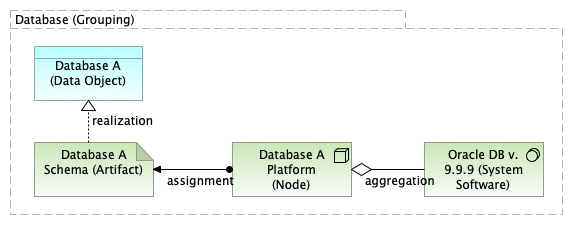
Applications & Databases View
Databases are a meaningful unit in the overall enterprise architecture of an organization. For example “Customer Database” or “Customer Database”, “Product Database”, etc. Alternatively, a database can be all tables of an application (e.g. “Customer table”, “Order table”, “Invoice table”, etc.), which together build one database. According to the ArchiMate specification, Data Object can be used to model logical databases (figure below), Chapter 9.4.1 “Data Object” says: “Typical examples of data objects are customer records, customer databases, or insurance claims.” “An important exception is when a data object is used to model a collection of data, such as a database, where only one instance exists.” ArchiMate has an elegant built-in mechanism that allows certain concepts to be used at different levels of abstraction (and detail). Therefore, for example, Data Object can be used to model logical databases, database tables, message structures (switched between applications), etc.
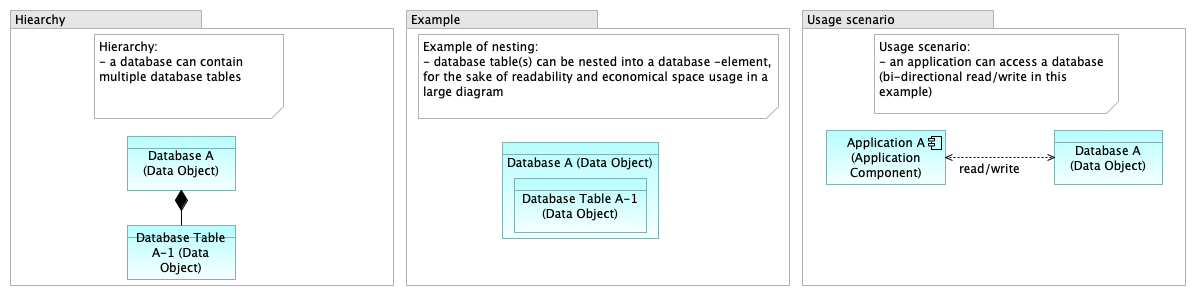
Database Modeling Considerations.
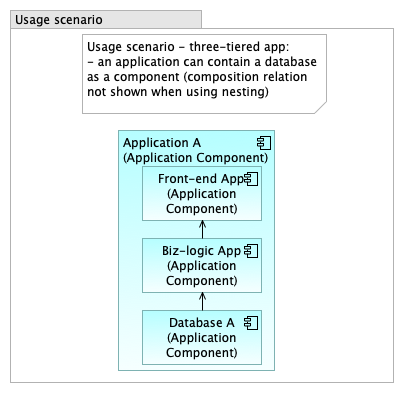
Database as an Application Component.
Database Abstraction Levels.
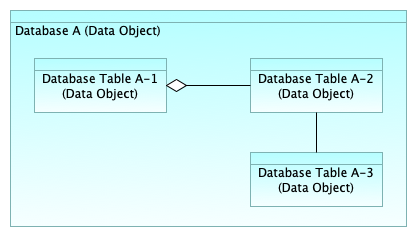
Data Model View.
Use Case View
ArchiMate can be used to analyze use cases from the functional perspective of applications. Use cases (known in UML) can be mapped to Application Services as shown in the figure below.
Use Case View (pattern 1).
Use cases can be divided into: a) business use cases and b) system use cases (aka system use cases). The figure below illustrates how “primary use cases” are modeled as Business Services, and subsequent system cases as Application Services.
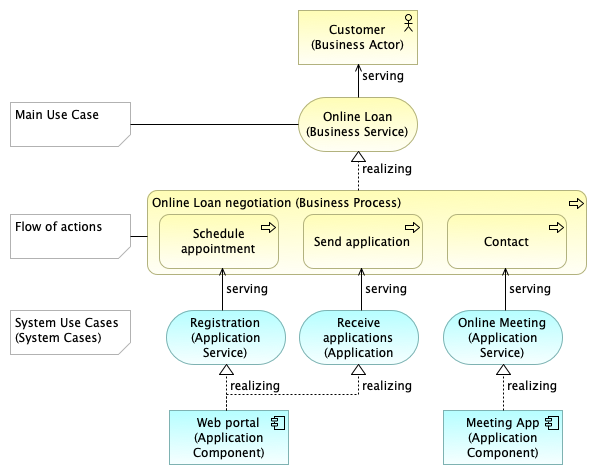
Use Case View (example).
When use cases are identified as application services, they can be further used as functional elements of target applications in other diagrams (e.g. in layered views). In other words: application services represent the behavior (functionality) of applications. For more detailed information on use case analysis, see the ArchiMate Cookbook, link.
Technology Viewpoint
Technology Architecture Layer View.
Infrastructure View
This view represents the platform of applications. This pattern can be used to model the configuration of the runtime environment and the deployment of business applications.
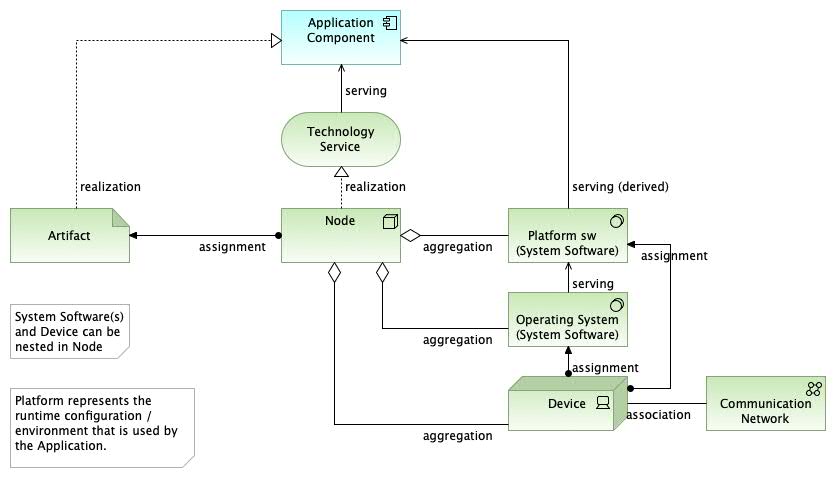
Infrastructure View.
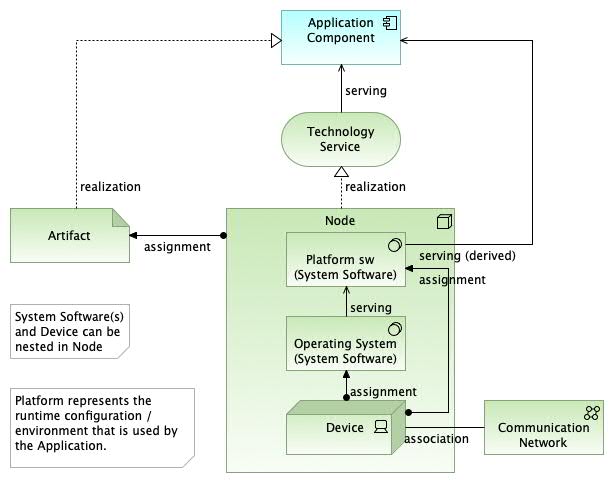
Infrastructure View (nested).
Implementation & Migration Layer / Transition Architecture Layer View
Implementation Roadmap View
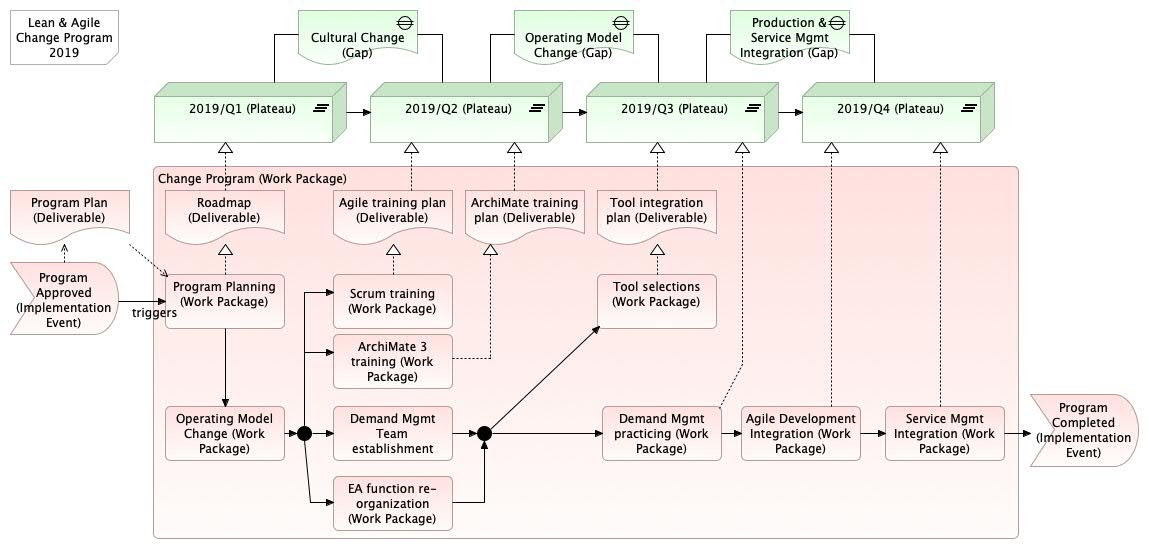
Implementation Roadmap View.
Kanban Board View
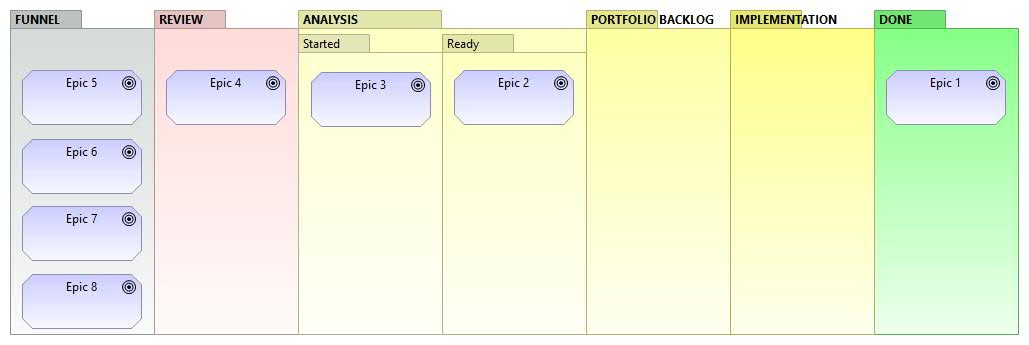
Kanban Board (EA).
Kanban can be used to visualize work and workflow. Kanban shows e.g. how development requirements, epics, user stories, etc. flow from backlog to ready state (done). Kanban can be applied to various uses depending on the scale and scope of the development case. For example, “epics” can be used at EA level or “user stories” or “requirements” at project level. The granularity of work items may vary depending on the situation.
Generic View
Generic View.
This simplified view can be used e.g. as a context diagram for a specific service, program, or project.
Additional Features
Context Overview – Milky Way Map
This is an approach to visualize as much as possible in the same view. For more details, see Milky Way Map for ArchiMate, link.
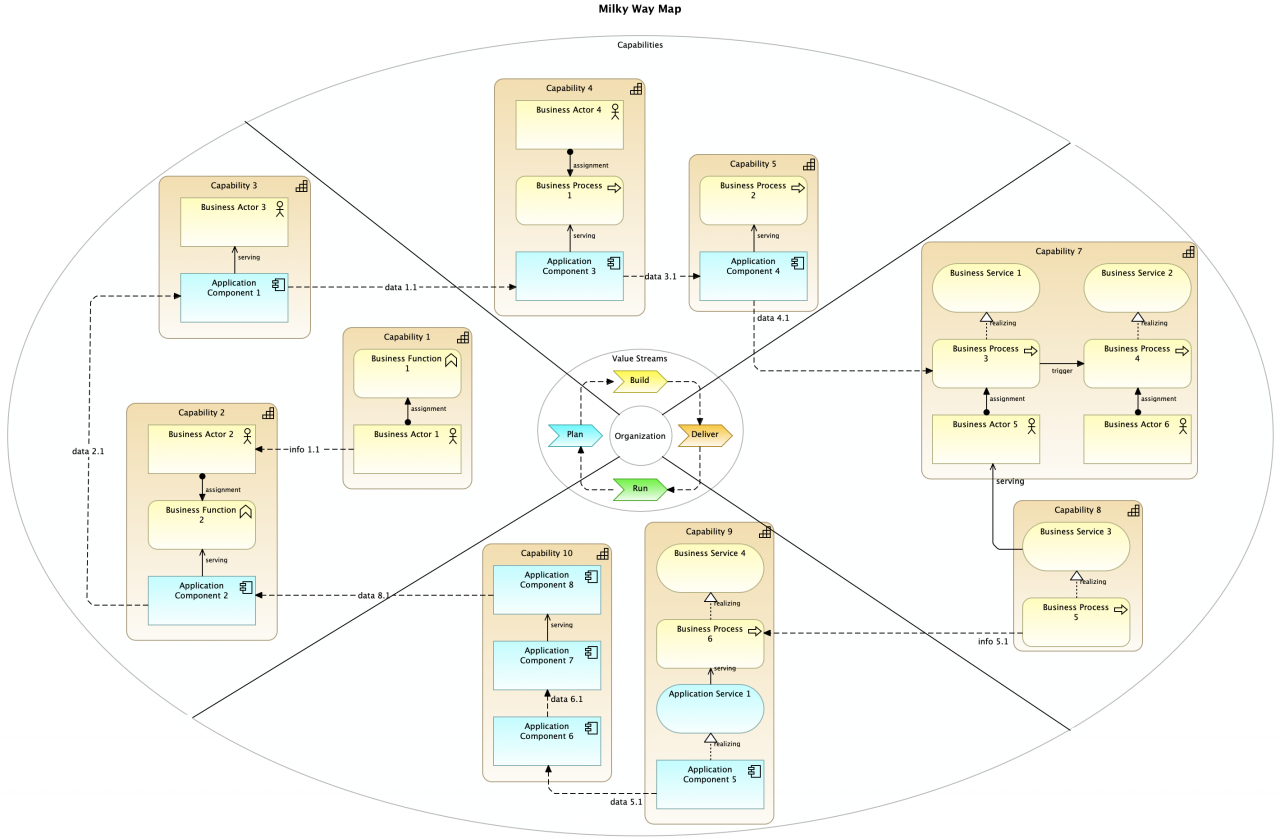
FM Milky Way Map (Level 2). (Note! This color scheme uses ArchiMate default colors. Any other colors can be used as needed.)
Co-operation View
Layers can be mixed as shown in the data flow diagram example below.
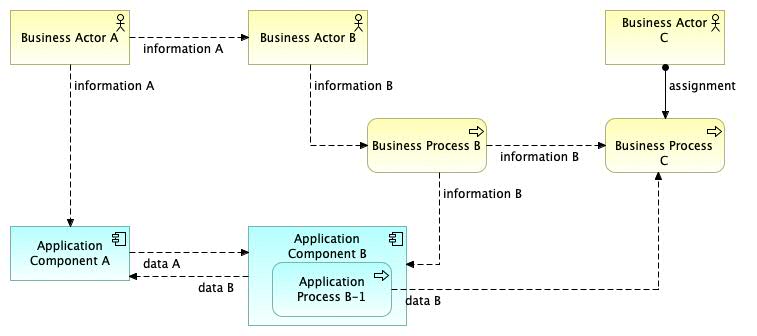
Application Co-operation View (extended).
Metamodel
Metamodel.
