In the software development process, the Unified Modeling Language (UML) is a powerful tool for visualizing and documenting the structure and behavior of systems. The UML State Machine Diagram is a part of UML used to describe the state changes of an object throughout its lifecycle. This article introduces the key concepts, examples, and applications of UML state machine diagrams.
What is a UML State Machine Diagram?
A UML State Machine Diagram is a behavioral diagram that describes the state changes of an object during its lifecycle. It shows how an object transitions from one state to another in response to events or conditions. State machine diagrams are commonly used to model finite state machines (FSMs), where an object transitions between a finite number of states.
Key Concepts
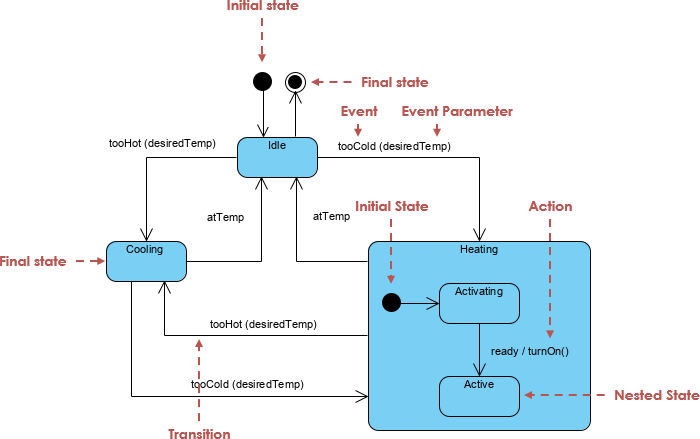
- State:
- A state represents the condition or situation of an object at a specific point in time. Each state has a unique name and optional entry/exit actions.
- Transition:
- A transition is a change from one state to another. Transitions are triggered by events and may include guard conditions and actions.
- Event:
- An event is an external or internal stimulus that triggers a state transition. Events can be time events, signal events, or call events.
- Initial State:
- The initial state marks the starting point of an object’s lifecycle. It is typically represented by a filled black circle.
- Final State:
- The final state marks the end point of an object’s lifecycle. It is usually shown as a filled circle surrounded by another circle.
- Composite State:
- A composite state is a state that contains substates. It allows hierarchical and modular structuring of state machines.
Examples
Below are several UML state machine diagram examples created using PlantUML, demonstrating how to apply these key concepts.
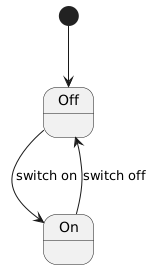
Example 1: Simple State Machine Diagram
In this example, we model a simple light bulb system with On and Off states.
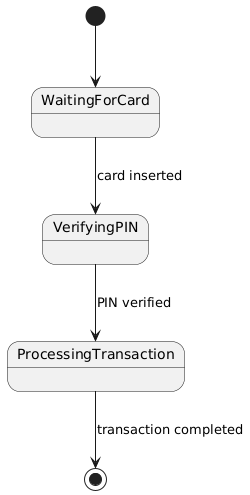
Example 2: State Machine Diagram with Composite States
In this example, we model an ATM system with substates such as Waiting for Card, PIN Validation, and Transaction Processing.
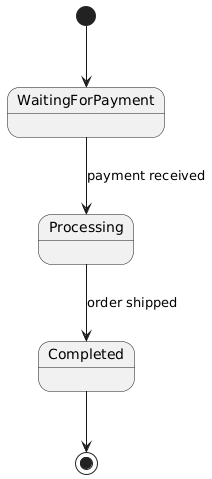
Example 3: State Machine Diagram with Events and Guard Conditions
In this example, we model an order processing system with states such as Awaiting Payment, Processing, and Completed.
Applications
UML state machine diagrams have wide applications in software development, including:
- System Design:
- State machine diagrams help design the behavior of complex systems, ensuring all possible states and transitions are considered.
- Requirements Analysis:
- During requirements analysis, state machine diagrams describe dynamic system behavior, helping stakeholders understand how the system works.
- Testing:
- State machine diagrams can be used to generate test cases, ensuring the system behaves correctly across all possible states and transitions.
Comparison: State Machine Diagram vs. Activity Diagram
In the Unified Modeling Language (UML), both state machine diagrams and activity diagrams are important tools for describing system behavior. While they share some similarities, they differ significantly in purpose, structure, and notation. This section compares the two and provides a comparison table.
State Machine Diagram
A state machine diagram describes the state changes of an object throughout its lifecycle. It shows how an object transitions from one state to another in response to events or conditions. State machine diagrams are typically used to model finite state machines (FSMs), where an object moves between a finite number of states.
Activity Diagram
An activity diagram describes the dynamic behavior of a system, particularly workflows and business processes. It shows the sequence of activities, including parallel and branching flows. Activity diagrams are similar to flowcharts but include UML-specific features such as swimlanes and object flows.
Comparison Table
| Feature | State Machine Diagram | Activity Diagram |
|---|---|---|
| Purpose | Describes state changes of an object throughout its lifecycle. | Describes dynamic system behavior, particularly workflows and business processes. |
| Main Elements | States, transitions, events, initial state, final state, composite states. | Activities, transitions, decision nodes, fork nodes, join nodes, initial node, final node, swimlanes. |
| Structure | State- and transition-based diagram. | Activity- and flow-based diagram. |
| Notation | Uses states and transitions to represent object state changes. | Uses activities and flows to represent dynamic system behavior. |
| Use Cases | Suitable for systems requiring state change description, such as embedded systems, communication protocols, UI behavior. | Suitable for systems requiring complex workflow and business process description, such as order processing or project management flows. |
| Complexity | Typically describes a single object’s state changes; lower complexity. | Can describe multiple objects and parallel flows; higher complexity. |
| Scalability | Can be extended with substates and composite states. | Can be extended with swimlanes and parallel flows. |
| Example | Light bulb on/off states, ATM system state changes. | Order processing workflow, project management process steps. |
Both state machine diagrams and activity diagrams are important UML tools for describing system behavior, but they differ significantly in purpose, structure, and notation. State machine diagrams focus on an object’s state changes over its lifecycle and are ideal for systems requiring state-based modeling. Activity diagrams focus on dynamic workflows and business processes, making them suitable for complex procedural modeling. By understanding these differences and use cases, development teams can choose the most appropriate tool to model and design system behavior effectively.
Conclusion
A UML state machine diagram is a powerful tool for describing how objects change states throughout their lifecycle. By mastering key concepts and applying practical examples, development teams can more effectively design, analyze, and test complex systems. Whether modeling a simple light bulb system or a complex order processing workflow, state machine diagrams provide an intuitive and structured way to simulate system behavior.
