UML Component Diagrams are used to model the physical aspects of an object-oriented system. They are used to visualize, specify, and document component-based systems, as well as to build executable systems through forward and reverse engineering. A component diagram is essentially a specialized class diagram that focuses on the system’s components and is used to model the static implementation view of a system.
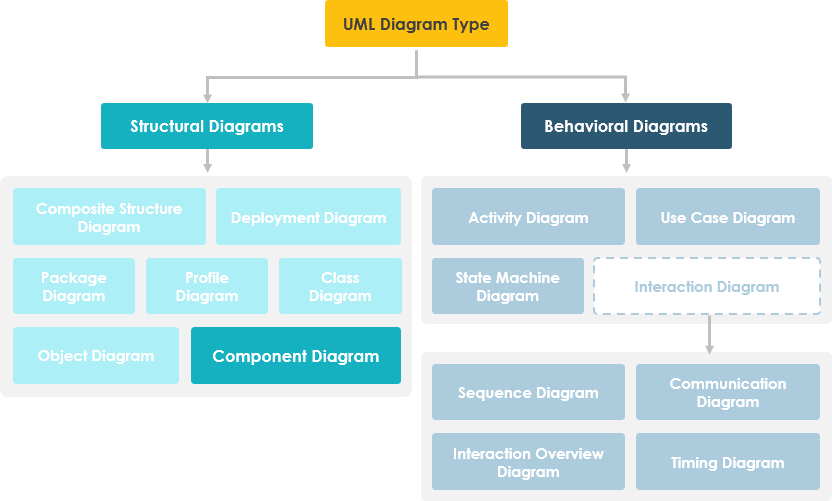
Overview of Component Diagrams
A component diagram breaks down the actual system being developed into various high-level functionalities. Each component is responsible for a clearly defined goal within the system and interacts only with other core elements as needed.
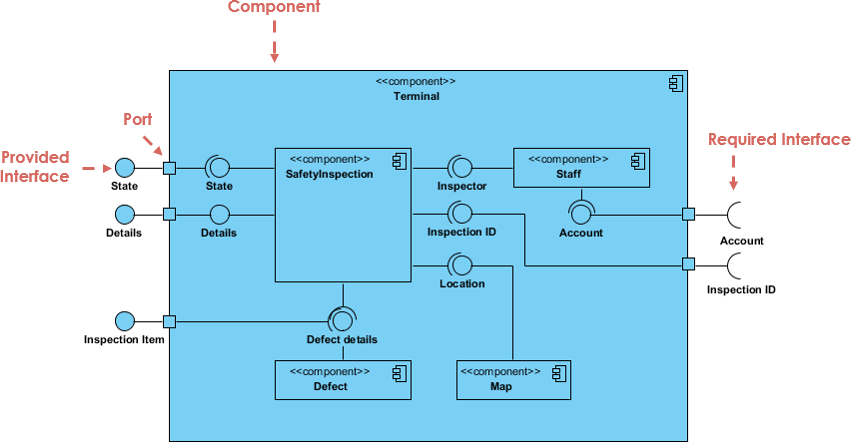
The example above shows the internal components of a larger component:
- Data (account and check IDs) flows into the component through ports on the right and is transformed into a format usable by the internal components. The interface on the right is called a provided interface, representing the services the component requires to fulfill its responsibilities.
- Data is then passed through various connections to and through other components, and output through ports on the left. The interfaces on the left are called required interfaces, representing the services the component provides.
- It’s important to note that the internal components are enclosed within a larger “box”—this can be the entire system itself (in which case, no component symbol appears in the top-right corner) or a subsystem/component of the system (in which case, the “box” represents the component itself).
Basic Concepts of Component Diagrams
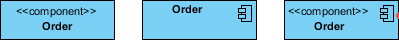
A component represents a modular part of a system, encapsulating its contents and whose behavior can be substituted within its environment. In UML 2, a component is drawn as a rectangle with an optional compartment stacked vertically. The high-level abstract view of a component in UML 2 can be modeled as:
- A rectangle with the component name
- A rectangle with a component icon
- A rectangle with a stereotype text and/or icon
Interfaces
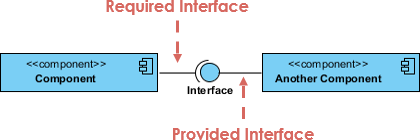
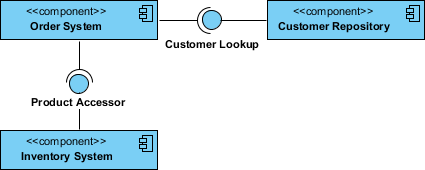
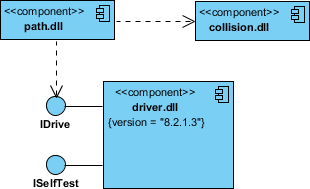
Two types of component interfaces are shown in the example below:
The provided interface symbol with a full circle at the end indicates the interface that the component provides—the “lollipop” symbol is a shorthand notation for the implementation relationship of an interface classifier.
The required interface symbol with a half-circle (also known as a socket) at the end indicates the interface the component requires (in both cases, the interface name is placed near the symbol itself).
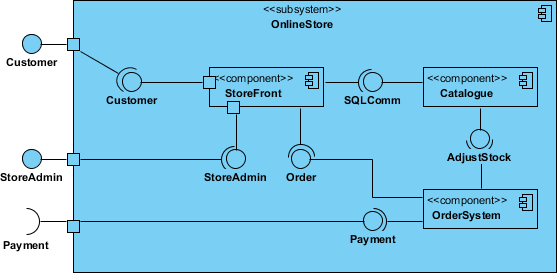
Component Diagram Example – Using Interfaces (Ordering System)
Subsystems
A subsystem classifier is a specialized version of a component classifier. Therefore, the subsystem notation element inherits all the same rules as the component notation. The only difference is that the subsystem symbol element uses the keyword “subsystem” instead of “component”.
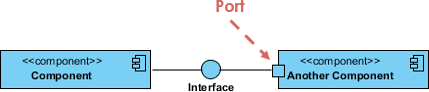
Ports
Ports are represented by squares along the edge of a component or system. They are typically used to expose a component’s required and provided interfaces.
Relationships
Graphically, a component diagram is a set of vertices and arcs, typically containing components, interfaces, and relationships such as dependency, aggregation, constraint, generalization, association, and realization. It may also include notes and constraints.
| Relationship | Symbol |
|---|---|
Association:
|
 |
Composition:
|
 |
Aggregation:
|
 |
Constraint:
|
 |
Dependency:
|
 |
Generalization:
|
 |
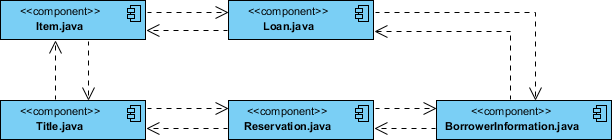
Source Code Modeling
- Identify the set of source code files of interest through forward or reverse engineering, and model them as components constructed as files.
- For larger systems, use packages to display groups of source code files.
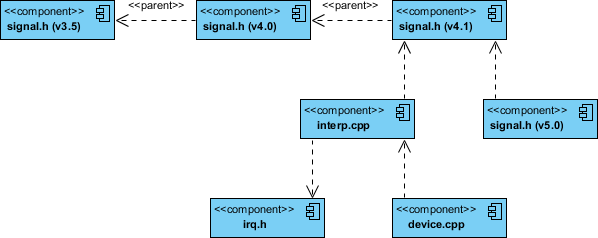
- Consider including a tagged value to represent information such as version number, author, and last modified date of the source code file. Use tools to manage the values of these tagged values.
- Use dependencies to model compilation dependencies between these files. Similarly, use tools to help generate and manage these dependencies.
Component Example – Java Source Code
Component Diagram Example – C++ Code with Versioning
Modeling Executable Releases
- Identify the set of components you want to model. This usually involves some or all components on a node, or a distribution of these components across all nodes in the system.
- Consider the stereotype for each component in this set. For most systems, you’ll find a small number of different component types (e.g., executables, libraries, tables, files, and documents). You can use UML’s extensibility mechanism to provide visual cues (hints) for these stereotypes.
- For each component in this set, consider its relationships with its neighbors. Most often, this involves interfaces exported by some components (implemented) and then imported by others (used). If you want to expose seams in the system, explicitly model these interfaces. If you want a higher-level abstraction, eliminate these relationships by showing only dependencies between components.
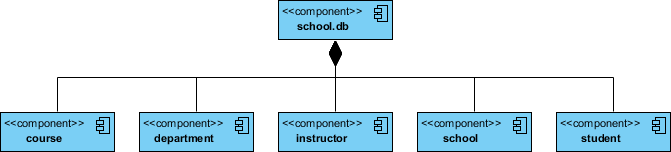
Physical Database Modeling
- Identify the classes in the model that represent logical database schemas.
- Choose the strategy for mapping these classes to tables. You must also consider the physical distribution of the database. Your mapping strategy will be influenced by where you want the data to persist in the deployed system.
- To visualize, specify, construct, and document the mapping, create a component diagram containing components constructed as tables.
- Where possible, use tools to help you convert the logical design into a physical design.
Try Drawing a UML Component Diagram Now
You’ve now learned what a component diagram is and how to draw one. It’s time to create your own. Get the Visual Paradigm Community Edition, a free UML tool, and use the free Component Diagram tool to build your own. It’s easy to use and intuitive.
Related Links
- What is Unified Modeling Language?
- Professional UML Tools
- Visual Paradigm. (n.d.). How to Draw a Component Diagram? Visual Paradigm. https://www.visual-paradigm.com/support/documents/vpuserguide/94/2581/7292_drawingcompo.html 42.
- Visual Paradigm. (2018, May 11). What is a Component Diagram? Visual Paradigm. https://www.visual-paradigm.com/guide/uml-unified-modeling-language/what-is-component-diagram/ 43.
- Visual Paradigm. (n.d.). How to Draw a Component Diagram in UML? Visual Paradigm. https://www.visual-paradigm.com/tutorials/how-to-draw-component-diagram-in-uml/ 44.
- Visual Paradigm. (n.d.). Component Diagram – UML 2 Diagram – UML Modeling Tool. Visual Paradigm. https://www.visual-paradigm.com/VPGallery/diagrams/Component.html 45.
- Visual Paradigm. (n.d.). Component Diagram in Visual Paradigm. Visual Paradigm. https://www.visual-paradigm.com/support/documents/vpuserguide/94/2581_componentdia.html 46.
- Visual Paradigm Community Circle. (2018, May 11). 7. Component Diagram. Visual Paradigm. https://circle.visual-paradigm.com/docs/uml-and-sysml/component-diagram/ 47.
- Visual Paradigm Online. (n.d.). Free Component Diagram Tool. Visual Paradigm. https://online.visual-paradigm.com/diagrams/solutions/free-component-diagram-tool/ 48.
- Visual Paradigm Online. (n.d.). Component Diagram Tutorial. Visual Paradigm. https://online.visual-paradigm.com/tutorials/component-diagram-tutorial/ 49.
- Visual Paradigm. (2022, September 2). UML Class Diagram Tutorial. Visual Paradigm. https://www.visual-paradigm.com/guide/uml-unified-modeling-language/uml-class-diagram-tutorial/ 50.
- Visual Paradigm Online. (n.d.). Online UML Diagram Tools. Visual Paradigm. https://online.visual-paradigm.com/diagrams/features/uml-tool/ 51.
