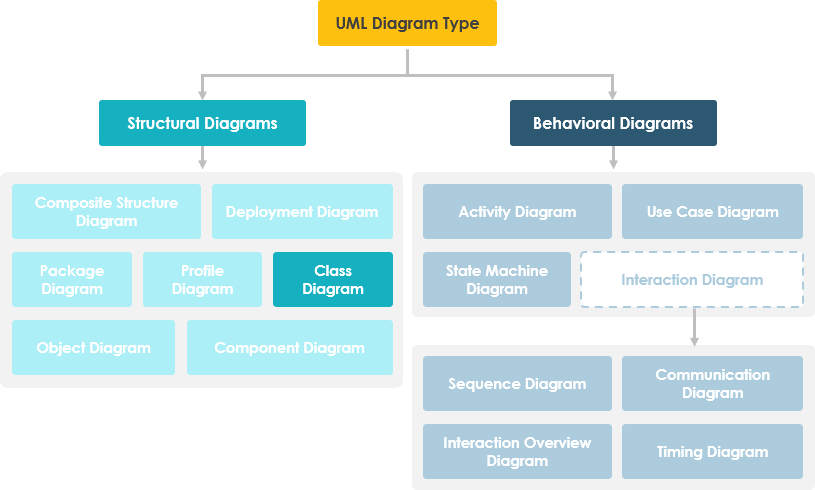
In software engineering, a Unified Modeling Language (UML) class diagram is a static structural diagram that describes the structure of a system by showing its classes, their attributes, operations (or methods), and relationships between objects.
Purposes of Class Diagrams
- Display the static structure of classifiers in the system
- Provides a foundational notation for other UML structural diagrams
- Highly useful for developers and other team members
- Business analysts can use class diagrams to model systems from a business perspective
UML class diagrams consist of:
- A set of classes
- A set of relationships between classes
What is a Class?
A description of a group of objects with similar roles, including:
- Structural Features (attributes): define what objects of the class “know”
- Represents the state of the object
- Describes the structure or static characteristics of the class
- Behavioral Features (operations): define what objects of the class “can do”
- Define how objects interact
- Describe behavior or dynamic characteristics of the class
Class Notation
Class notation consists of three parts:
- Class Name
- The class name appears in the first compartment.
- Class Attributes
- Attributes are displayed in the second compartment.
- Type is shown after a colon.
- Attributes map to member variables (data members) in code.
- Class Operations (methods)
- Operations are shown in the third compartment. They represent services provided by the class.
- Return type appears after a colon at the end of the method signature.
- Parameter types appear after a colon following the parameter name.
- Operations map to class methods in code.
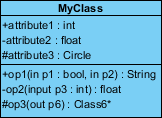
Graphical representation of class MyClass as shown above:
- MyClass has 3 attributes and 3 operations
- Parameter p3 of op2 is of type int
- op2 returns a float
- op3 returns a pointer (indicated by *) to Class6
Class Relationships
A class may be involved in one or more relationships with other classes. Relationships can be of the following types: (Refer to the image on the right for graphical representations).
| Relationship Type | Diagram |
|---|---|
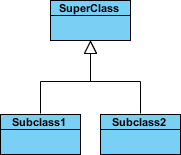
Inheritance (or Generalization):
|
 |
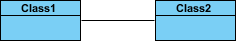
Simple Association:
|
 |
Aggregation:
|
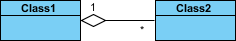 |
Composition:
|
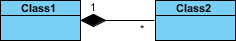 |
Dependency:
|
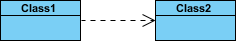 |
Relationship Names
- Relationship names are written in the middle of the association line.
- Good relationship names are meaningful when read aloud:
-
- “Each spreadsheet contains some cells”
<li”Expression evaluates to a value”
-
- They often have a small arrow indicating the direction of reading, e.g., expression evaluates to value, but value does not evaluate to expression.
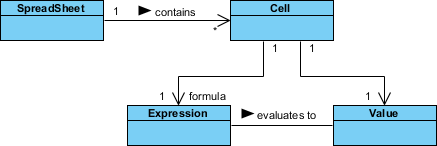
Relationship – Roles
- Role defines the purpose of the direction in an association.
- Role is written at the end of the association line and describes the role a class plays in that relationship.
- E.g., Cell is related to Expression. The nature of the relationship is that Expression is the formula of the cell.
Visibility of Class Members
In object-oriented design, visibility of attributes and operations is represented. UML defines four types of visibility: public, protected, private, and package.
Symbols +, -, #, and ~ before attribute and operation names indicate visibility:
- + indicates public attribute or operation
- – indicates private attribute or operation
- # indicates protected attribute or operation
- ~ indicates package attribute or operation
Class Visibility Example
In the example above:
- attribute1 and op1 of MyClassName are public
- attribute3 and op3 are protected
- attribute2 and op2 are private
Access permissions for different class members are shown below:
| Access Level | Public (+) | Private (-) | Protected (#) | Package (~) |
|---|---|---|---|---|
| Members of the same class | Yes | Yes | Yes | Yes |
| Members of derived classes | Yes | No | Yes | Yes |
| Members of any other class | Yes | No | No | Same package only |
Multiplicity
Multiplicity indicates how many objects of a class participate in a relationship. It can be expressed as:
- Exactly 1 – 1
- Zero or one – 0..1
- Many – 0..* or *
- One or more – 1..*
- Exact number – e.g., 3..4 or 6
- Complex relationship – e.g., 0..1, 3..4, 6* means any number except 2 or 5
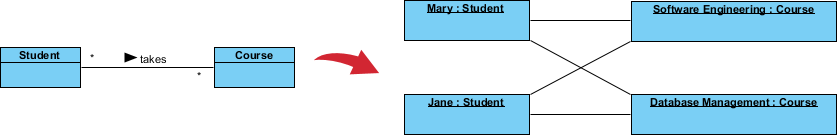
Multiplicity Example
- Requirement: A student can enroll in many courses, and many students can enroll in one course.
- In the example below, the class diagram (left) describes the static model of the above requirement, while the object diagram (right) shows a snapshot of course registration (instance of the class diagram) for software engineering and database management courses.
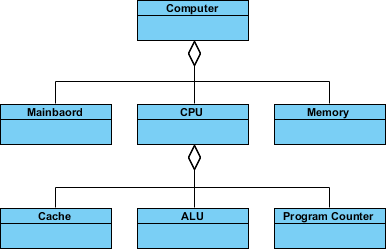
Aggregation Example – Computer and Components
- Aggregation is a special case of association representing a “contains” hierarchy.
- Aggregation is the parent class, component is the child class.
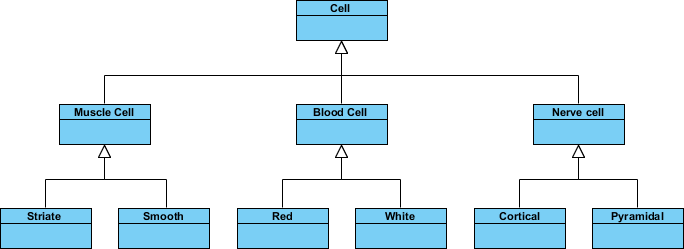
Inheritance Example – Cell Classification
- Inheritance is another special case of association representing a “kind-of” hierarchy.
- Inheritance simplifies the analysis model by introducing taxonomy.
- Subclasses inherit attributes and operations from the superclass.
Class Diagram – Diagram Tool Example
Class diagrams can include notes attached to classes or relationships. Notes are displayed in gray.
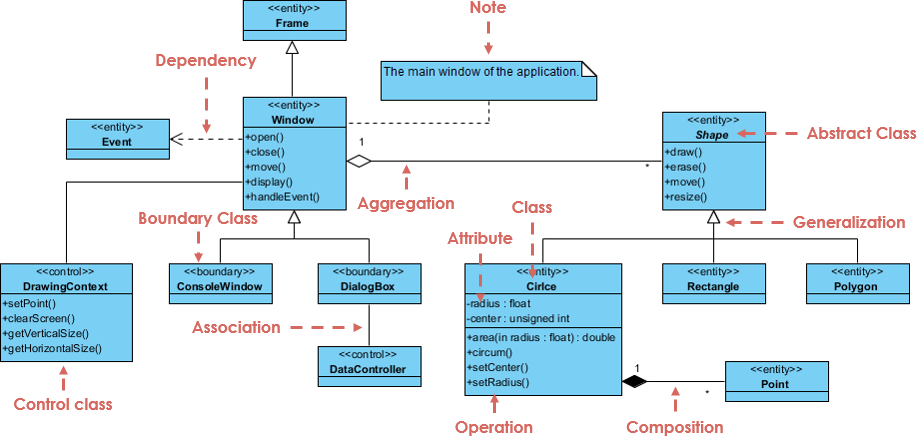
From the example above, we can interpret the diagram as follows:
- Shape is an abstract class. It is shown in italics.
- Shape is a superclass. Circle, Rectangle, and Polygon inherit from Shape. In other words, a Circle is a Shape. This is a generalization/inheritance relationship.
- There is an association between DialogBox and DataController.
- Shape is part of Window. This is an aggregation relationship. Shape can exist without Window.
- Point is part of Circle. This is a composition relationship. Point cannot exist without Circle.
- Window depends on Event. But Event does not depend on Window.
- Circle’s attributes are radius and center. It is a concrete class.
- Circle’s methods are area(), circum(), setCenter(), and setRadius().
- Parameter radius in Circle is of type float.
- Method area() in Circle returns a double value.
- Attributes and methods of Rectangle are hidden. Some other classes in the diagram also hide their attributes and methods.
Handling Complex Systems – Multiple or Single Class Diagrams?
When modeling large systems or large business domains, many entities must be considered. Should we use multiple or a single class diagram? The answer is:
- It is better to use multiple class diagrams rather than model every entity and its relationships on a single diagram.
- Breaking the system into multiple class diagrams makes it easier to understand, especially when each diagram is a visual representation of a specific part of the system.
Perspective of Class Diagrams in the Software Development Lifecycle
Class diagrams can be used at different stages of the Software Development Life Cycle (SDLC), and typically three different levels of detail (perspectives) are modeled progressively:
Conceptual Perspective: The diagram is interpreted as describing things in the real world. Thus, if you start from a conceptual perspective, you draw a diagram representing concepts in the domain being studied. These concepts naturally relate to the classes that implement them. This perspective is regarded as language-agnostic.
Specification Perspective: The diagram is interpreted as describing software abstractions or components with specifications and interfaces, without committing to a specific implementation. Thus, if you approach from a specification perspective, you are studying software interfaces rather than implementation.
Implementation Perspective: The diagram is interpreted as describing a specific technology and language implementation of software. Thus, if you approach from an implementation perspective, you are studying software implementation.
Try Drawing a UML Class Diagram Now
Download for Free
