UML stands for Unified Modeling Language. It is a standardized modeling language consisting of an integrated set of diagrams developed to help system and software developers specify, visualize, construct, and document the artifacts of software systems, as well as for business modeling and other non-software systems.
UML represents a collection of the best engineering practices that have proven successful in modeling large, complex systems. UML is an important part of developing object-oriented software and the software development process. UML primarily uses graphical notations to express the design of software projects. Using UML helps project teams communicate, explore potential designs, and validate the architectural design of the software. In this article, we provide detailed information about what UML is.
Origins of UML
The goal of UML is to provide a standard notation that can be used by all object-oriented methods and to select and integrate the best elements of previous notations. UML is designed for a broad range of applications. Therefore, it provides constructs for a wide range of systems and activities (e.g., distributed systems, analysis, system design, and deployment).
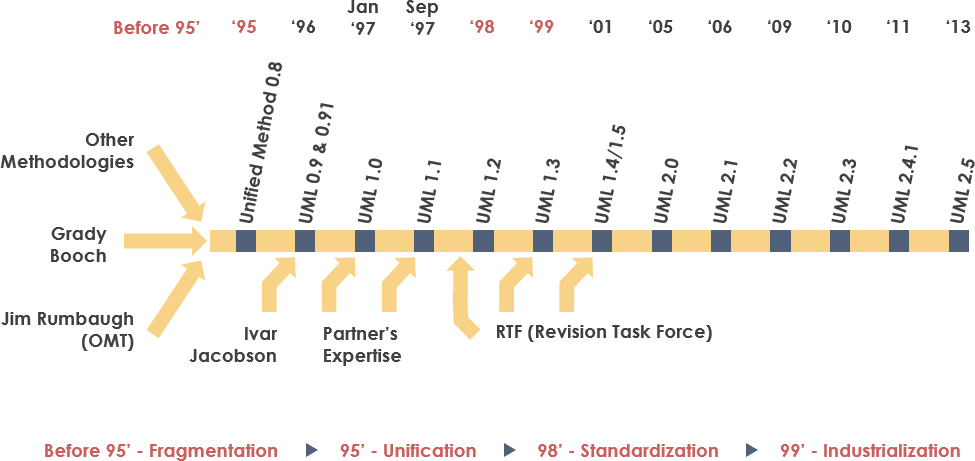
UML was born from the unification of three leading object-oriented modeling notations:
- Object Modeling Technique (OMT) [James Rumbaugh 1991] – best suited for analysis and data-intensive information systems.
- Booch [Grady Booch 1994] – very strong for design and implementation. Grady Booch worked extensively with the Ada language and was a major contributor to the object-oriented development of that language. Although the Booch method was powerful, its notation was not very popular (lots of cloud shapes in his models – not very neat).
- OOSE (Object-Oriented Software Engineering [Ivar Jacobson 1992]) – characterized by a model called Use Cases. Use Cases are a powerful technique for understanding the behavior of the entire system (an area where OO had traditionally been weak).
In 1994, the software world was shocked when Jim Rumbaugh, creator of OMT, left General Electric and joined Grady Booch at Rational Software. The collaboration aimed to merge their ideas into a unified method (working title was “Unified Method”).
By 1995, Ivar Jacobson, creator of OOSE, also joined Rational, and his ideas (particularly the concept of “Use Cases”) were incorporated into the new unified method – now called Unified Modeling Language 1. The team of Rumbaugh, Booch, and Jacobson was affectionately known as the “Three Amigos”.
UML was also influenced by other object-oriented notations at the time:
- Mellor and Shlaer [1998]
- Coad and Yourdon [1995]
- Wirfs-Brock [1990]
- Martin and Odell [1992]
UML also included new concepts not present in other major methods of the time, such as extension mechanisms and constraint languages.
History of UML
- During 1996, the Object Management Group (OMG) issued the first Request for Proposal (RFP), which served as a catalyst for these organizations to collaborate on a joint RFP response.
- Rational formed the UML Partners consortium with several organizations willing to dedicate resources to a strong UML 1.0 definition. Those contributing most to the UML 1.0 definition included:
- Digital Equipment Corporation
- Hewlett-Packard
- I-Logix
- IntelliCorp
- IBM
- ICON Computing
- MCI Systemhouse
- Microsoft
- Oracle
- Rational Software
- Texas Instruments
- Unisys
- This collaboration produced UML 1.0, a well-defined, expressive, powerful, and general-purpose modeling language. It was submitted to OMG as the initial RFP response in January 1997.
- In January 1997, IBM, ObjecTime, Platinum Technology, Ptech, Taskon, Reich Technologies, and Softeam also submitted separate RFP responses to OMG. These companies joined the UML Partners to contribute their ideas, and the partners jointly produced a revised UML 1.1 response. UML 1.1 focused on improving the clarity of UML 1.0 semantics and incorporating contributions from the new partners. It was submitted to OMG for consideration and adopted in fall 1997. Versions progressed from 1.1 to 1.5, followed by UML 2.0 through 2.5 (current version is UML 2.5).
Why UML?
As the strategic value of software increased for many companies, the industry sought technologies to automate software production and improve quality while reducing cost and time to market. These technologies include component technology, visual programming, patterns, and frameworks. Businesses are also seeking ways to manage complexity as their scope and scale increase. In particular, they recognize the need to address recurring architectural problems such as physical distribution, concurrency, replication, security, load balancing, and fault tolerance. Furthermore, the development of the World Wide Web, while simplifying some things, has exacerbated these architectural problems. The Unified Modeling Language (UML) was designed to meet these needs.
- Provide users with a ready-to-use, expressive visual modeling language to develop and exchange meaningful models.
- Provide extensibility and specialization mechanisms to extend core concepts.
- Be independent of particular programming languages and development processes.
- Provide a formal basis for understanding the modeling language.
- Encourage the growth of the object-oriented tools market.
- Support higher-level development concepts such as collaborations, frameworks, patterns, and components.
- Integrate best practices.
UML – Overview
Before we dive into UML theory, let’s briefly introduce some of the major concepts in UML.
The first thing to notice about UML is that there are many different diagrams (models) to get used to. The reason for this is that a system can be viewed from many different perspectives. Software development involves many stakeholders.
For example:
- Analysts
- Designers
- Coders
- Testers
- QA
- Customers
- Technical authors
All of these people are interested in different aspects of the system, and each aspect requires a different level of detail. For example, coders need to understand the design of the system and be able to translate the design into low-level code. In contrast, technical authors are interested in the overall behavior of the system and need to understand the functionality of the product. UML tries to provide a language expressive enough that all stakeholders can benefit from at least one UML diagram.
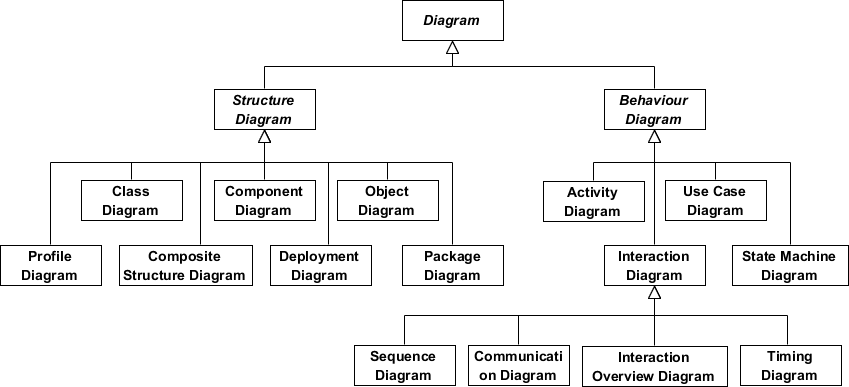
Here is a quick overview of each of the 13 diagrams shown in the UML 2 Diagram Structure:
Structural Diagrams show the static structure of the system and its parts at different levels of abstraction and implementation, and how they are related. Structural diagrams have seven types:
- Class Diagram
- Component Diagram
- Deployment Diagram
- Object Diagram
- Package Diagram
- Composite Structure Diagram
- Profile Diagram
Behavioral Diagrams show the dynamic behavior of objects in the system, which can be described as a series of changes over time. There are seven types of behavioral diagrams:
- Use Case Diagram
- Activity Diagram
- State Machine Diagram
- Sequence Diagram
- Communication Diagram
- Interaction Overview Diagram
- Timing Diagram
What is a Class Diagram?
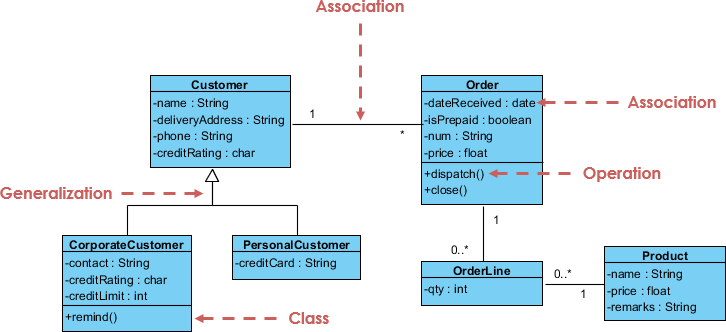
A class diagram is a central modeling technique used in nearly all object-oriented methods. The diagram describes the types of objects in the system and the various static relationships that exist among them.
Relationships
There are three main relationships that are important:
- Association – indicates a relationship between instances of types (e.g., a person works for a company, a company has multiple offices).
- Inheritance – the most obvious addition to ER diagrams used in OO. It has a direct correspondence to inheritance in OO design.
- Aggregation – a form of object composition in object-oriented design.
Class Diagram Example
For more details about class diagrams, read the article What is a Class Diagram?
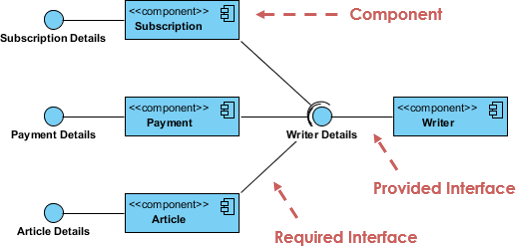
What is a Component Diagram?
In the Unified Modeling Language, a component diagram depicts how components are wired together to form larger components or software systems. It illustrates the architecture of software components and their dependencies. Those software components include runtime components, executable components, and also source code components.
Component Diagram Example
For more details about component diagrams, read the article What is a Component Diagram?
What is a Deployment Diagram?
Deployment diagrams help model the physical aspects of object-oriented software systems. It is a structure diagram that shows the architecture of the system as the deployment (distribution) of software artifacts to deployment targets. Artifacts represent concrete elements in the physical world that result from the development process. It models runtime configuration in a static view and visualizes the distribution of artifacts in an application. In most cases, it involves modeling hardware configurations and the software components that live on them.
Deployment Diagram Example
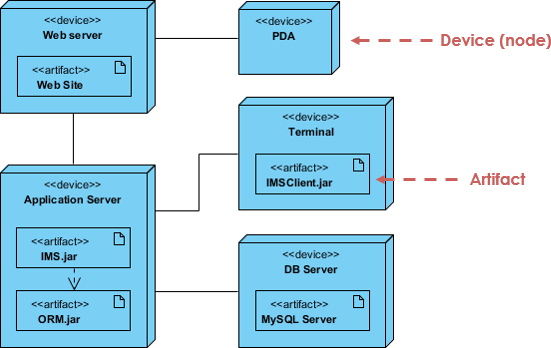
For more details about deployment diagrams, read the article What is a Deployment Diagram?
What is an Object Diagram?
An object diagram is a graph of instances, including objects and data values. A static object diagram is an instance of a class diagram; it shows a snapshot of the detailed state of the system at a point in time. The difference is that a class diagram represents an abstract model composed of classes and their relationships, whereas an object diagram represents instances at a specific moment, which is inherently concrete. The use of object diagrams is fairly limited, mainly to show examples of data structures.
Class Diagram vs Object Diagram – An Example
Some people may find it difficult to understand the difference between UML class diagrams and UML object diagrams because they both contain named “rectangular blocks” with attributes and links between them, which makes the two UML diagrams look similar. Some even think they are the same because in UML tools both the class diagram and object diagram symbols are placed in the same diagram editor – the class diagram.
But in reality, class diagrams and object diagrams represent two different aspects of the codebase. In this article, we provide some ideas about these two UML diagrams, what they are, how they differ, and when to use them.
Relationship Between Class Diagram and Object Diagram
You create “classes” when programming. For example, in an online banking system, you may create classes such as “User”, “Account”, “Transaction”, etc. In a classroom management system, you may create classes such as “Teacher”, “Student”, “Assignment”, etc. In each class, there are attributes and operations that represent the characteristics and behaviors of the class. A class diagram is a UML diagram where you can visualize these classes, their attributes, operations, and relationships with each other.
A UML object diagram shows how object instances of classes (drawn in a UML class diagram) “look like” at a particular state. In other words, a UML object diagram can be considered as an instance of how classes (in a UML class diagram) are used at a specific state.
If you don’t like these definitions, take a look at the UML diagram examples below. I believe you will understand their difference in seconds.
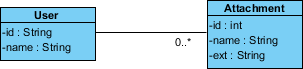
Class Diagram Example
The following class diagram example represents two classes – User and Attachment. A user can upload multiple attachments, so the two classes are associated with an association with multiplicity 0…* on the Attachment side.
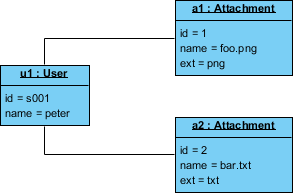
Object Diagram Example
The following object diagram example shows how object instances of the User and Attachment classes “look like” when Peter (i.e., a user) attempts to upload two attachments. So there are two instance specifications of the two attachments to be uploaded.
For more details about object diagrams, read the article What is an Object Diagram?
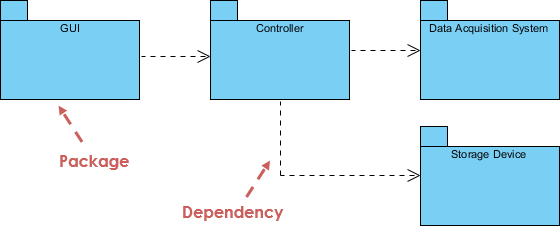
What is a Package Diagram?
A package diagram is a UML structure diagram that shows packages and dependencies between packages. Package diagrams allow showing different views of a system, e.g., as multi-layered (also called multi-tier) application – multi-layered application model.
Package Diagram Example
For more details about package diagrams, read the article What is a Package Diagram?
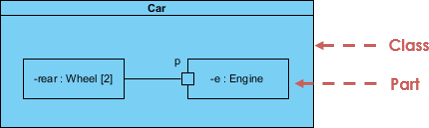
What is a Composite Structure Diagram?
Composite structure diagrams are one of the new artifacts added to UML 2.0. A composite structure diagram is similar to a class diagram and is a type of component diagram mainly used to model a system at a micro point-of-view, but it depicts the internal structure of a single part rather than an entire class. It is a static structure diagram that shows the internal structure of a class and the collaborations that this structure makes possible.
The diagram can include internal parts, ports through which parts interact with each other or instances of the class interact with the outside world, and connectors between parts or ports. A composite structure is a set of interconnected elements that collaborate at runtime to achieve some purpose. Each element has some defined role in the collaboration.
Composite Structure Diagram Example
For more details about composite structure diagrams, read the article What is a Composite Structure Diagram?
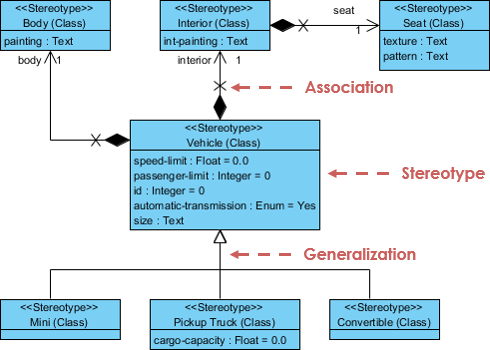
What is a Profile Diagram?
With the profile diagram, you can create domain- and platform-specific stereotypes and define their relationships. You can create stereotypes by drawing stereotype shapes and relate them with composition or generalization through resource-centric interface. You can also define and visualize tagged values of stereotypes.
Profile Diagram Example
For more details about profile diagrams, read the article What is a Profile Diagram in UML?
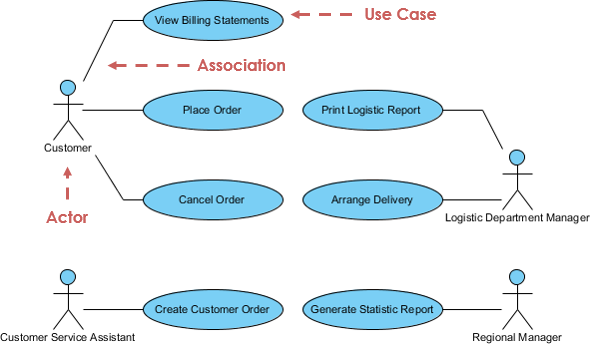
What is a Use Case Diagram?
A use case model describes the functional requirements of a system in terms of use cases. It is a model of the system’s intended functions (use cases) and its environment (actors). Use cases allow you to relate what the system is required to do to how the system meets those requirements.
Think of a use case model as a menu, like the one you find in a restaurant. By looking at the menu, you can see what dishes are available, individual dishes, and their prices. You also know what kind of cuisine the restaurant serves: Italian, Mexican, Chinese, etc. By looking at the menu, you get an overall sense of what dining experience awaits you at that restaurant. The menu is actually “mimicking” the behavior of the restaurant.
Because it is such a powerful planning tool, use case models are used by all team members throughout all phases of the development cycle.
Use Case Diagram Example
For more details about use case diagrams, read the article What is a Use Case Diagram?
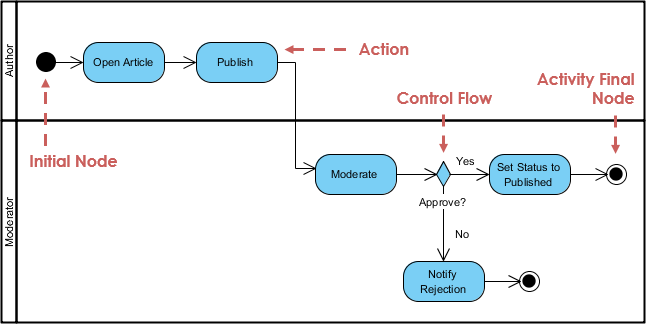
What is an Activity Diagram?
An activity diagram is a graphical representation of workflows of stepwise activities and actions with support for choice, iteration, and concurrency. It describes the control flow of the target system, e.g., exploring complex business rules and operations, describing use cases, and business processes. In the Unified Modeling Language, activity diagrams are intended to model both computational and organizational processes (i.e., workflows).
Activity Diagram Example
For more details about activity diagrams, read the article What is an Activity Diagram?
What is a State Machine Diagram?
A state diagram is a type of diagram used in UML to describe system behavior based on David Harel’s statechart concept. State diagrams depict permitted states and transitions as well as the events that affect those transitions. It helps visualize the entire lifecycle of an object, thereby aiding in better understanding of state-based systems.
State Machine Diagram Example
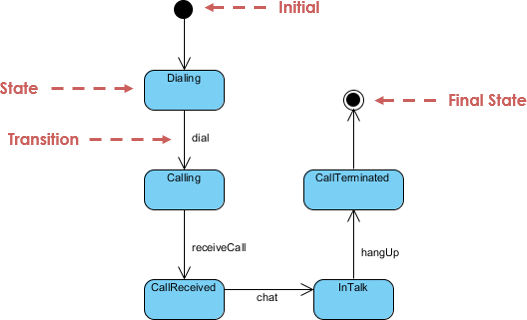
For more details about state machine diagrams, read the article What is a State Machine Diagram?
What is a Sequence Diagram?
A sequence diagram models the collaboration of objects according to time sequence. It shows how objects interact with each other in a particular use case scenario. With advanced visual modeling capability, you can create complex sequence diagrams with just a few clicks. In addition, some modeling tools (such as Visual Paradigm) can generate sequence diagrams from the flow of events that you defined in use case descriptions.
Sequence Diagram Example
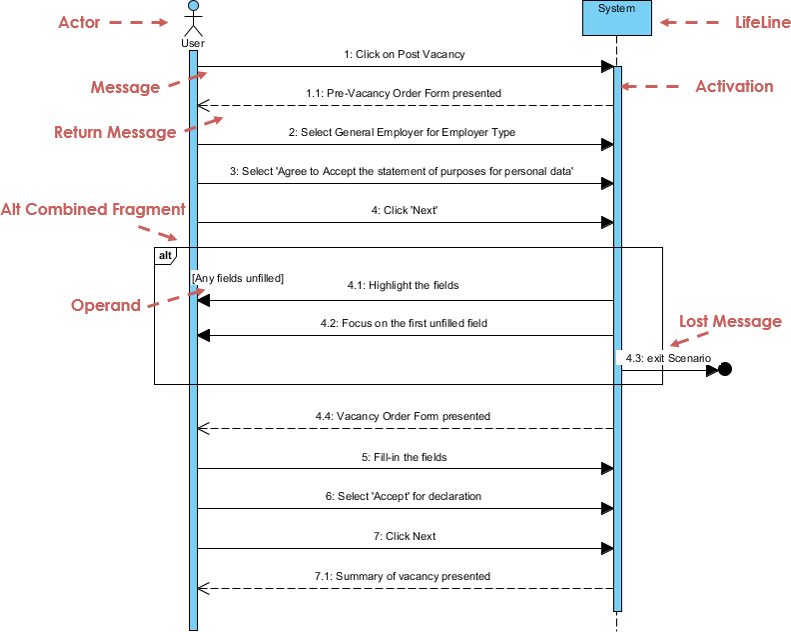
For more details about sequence diagrams, read the article What is a Sequence Diagram?
What is a Communication Diagram?
Similar to a sequence diagram, a communication diagram is also used to model the dynamic behavior of a use case. Compared to sequence diagrams, communication diagrams place more emphasis on showing the collaboration of objects rather than the time sequence. They are semantically equivalent, so some modeling tools (such as Visual Paradigm) allow you to generate one from the other.
Communication Diagram Example
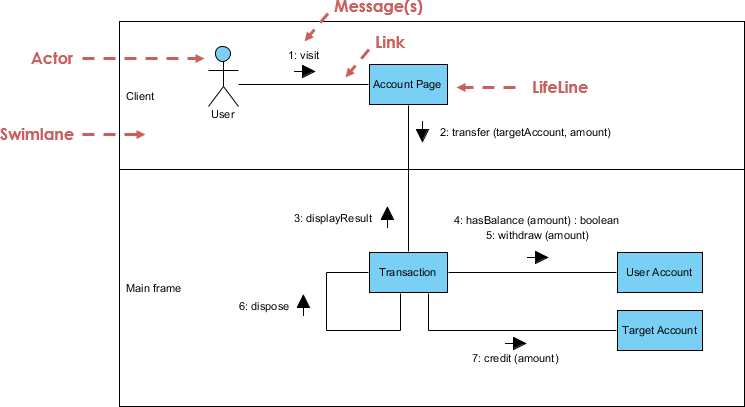
For more details about communication diagrams, read the article What is a Communication Diagram?
What is an Interaction Overview Diagram?
An interaction overview diagram focuses on an overview of the control flow of the interaction. It is a variant of the activity diagram where the nodes are interactions or interaction occurrences. The interaction overview diagram describes the interactions where messages and lifelines are hidden. You can link to “real” diagrams and achieve high navigability between diagrams in the interaction overview diagram.
Interaction Overview Diagram Example
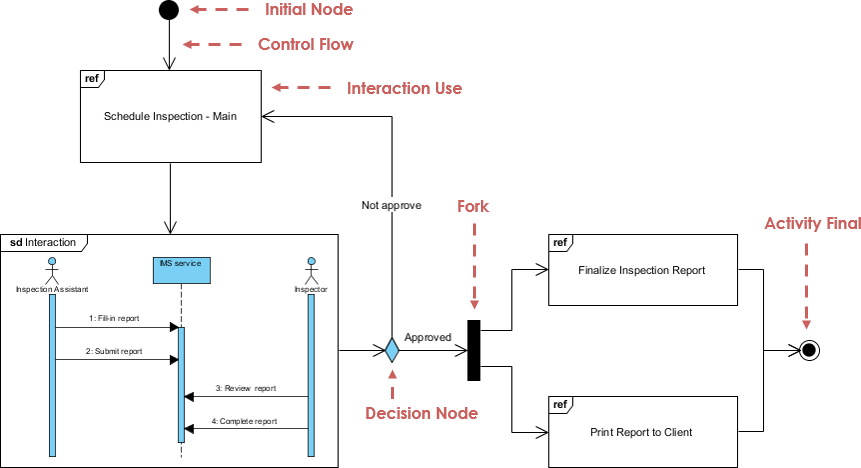
For more details about interaction overview diagrams, read the article What is an Interaction Overview Diagram?
What is a Timing Diagram?
A timing diagram shows the behavior of objects over a given period of time. Timing diagrams are a special form of sequence diagram. The difference between timing diagrams and sequence diagrams is that the axes are reversed, so time increases from left to right, and lifelines are shown in vertically arranged separate compartments.
Timing Diagram Example
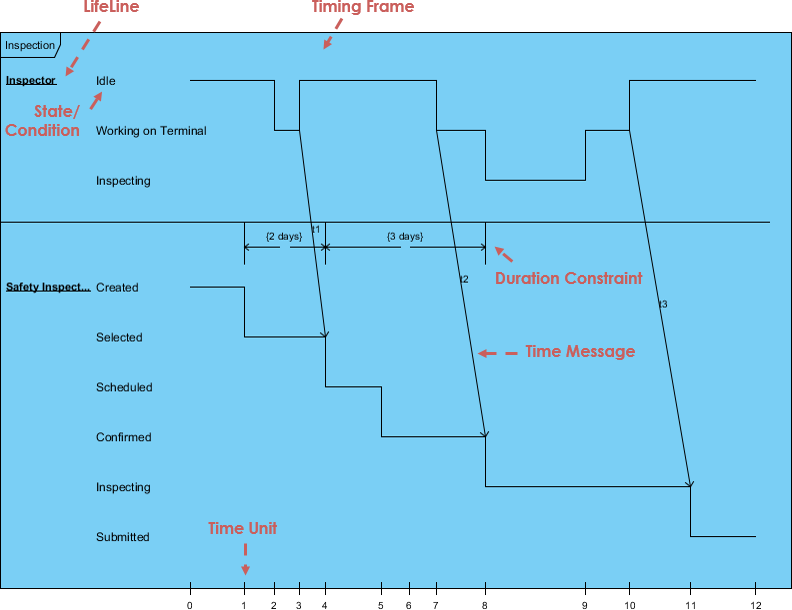
For more details about timing diagrams, read the article What is a Timing Diagram?
Learn UML. Draw UML.
Get Visual Paradigm Community Edition – a FREE UML tool that helps you learn UML faster and more effectively. Visual Paradigm Community Edition supports all UML diagram types. Its award-winning UML modeler is intuitive and easy to use.
UML Glossary & Terminology
- Abstract class – A class that is never instantiated. No instances of this class ever exist.
- Actor – An object or person that initiates events involved with the system.
- Activity: A step or action in an activity diagram. Represents an operation taken by the system or an Actor.
- Activity diagram: A glorified flowchart that shows steps and decisions in a process, as well as parallel operations, such as an algorithm or business process.
- Aggregation – Is part of another class. Shown with a hollow diamond next to the containing class in the diagram.
- Artifact – A document describing the output of a step in the design process. The description can be graphical, textual, or some combination.
- Association – A connection between two elements in the model. This could represent a member variable in code, an association between a personnel record and the person it represents, a relationship between two classes of workers, or any similar relationship. By default, both elements in an association know about each other and are equal. An association can also be a navigable association, meaning the source end knows about the target end, but not vice versa.
- Association class: A class that represents an association between two other classes and adds information to it.
- Attribute – A characteristic of an object that can be used to reference other objects or hold information about the object’s state.
- Base class: The class that defines attributes and operations inherited by subclasses through a generalization relationship.
- Branch: A decision point in an activity diagram. Multiple transitions emerge from a branch, each with a guard condition. When control reaches the branch, exactly one guard condition must be true, and control follows the corresponding transition.
- Class: A category of similar objects, all described by the same attributes and operations, and all assignment-compatible.
- Class diagram – Shows classes in the system and relationships between them.
- Classifier: A UML element that has attributes and operations. Specifically, Actors, Classes, and Interfaces.
- Collaboration: A relationship between two objects in a communication diagram, indicating that messages can pass back and forth between objects.
- Communication diagram – A diagram that shows how an operation is accomplished while emphasizing the roles of objects.
- Component: A deployable unit of code in the system.
- Component diagram: A diagram that shows relationships between various components and interfaces.
- Concept – A noun or abstract concept to be included in the domain model.
- Construction phase – The third phase of the Rational Unified Process, in which multiple functional iterations are built in the constructed system. This is where the bulk of the work takes place.
- Dependency: A relationship indicating that one classifier knows about the attributes and operations of another classifier but is not directly connected to any instances of the second classifier.
- Deployment diagram: A diagram showing relationships between various processors.
- Domain – The part of the Universe of Discourse the system is involved with.
- Elaboration phase – The second phase of the Rational Unified Process, allowing for additional project planning including iterations in the construction phase.
- Element: Any item shown in the model.
- Encapsulation – Data within an object is private.
- Generalization – Indicates that one class is a subclass of another (superclass). Hollow arrow points to the superclass.
- Event: In a state diagram, this represents a signal or event or input that causes the system to take action or change state.
- Final state: In a state diagram or activity diagram, this represents the point at which the diagram is finished.
- Fork: A point in an activity diagram where multiple parallel threads of control begin.
- Generalization: A relationship of inheritance where a subclass inherits and adds to the attributes and operations of a base class.
- GoF – Gang of Four design patterns.
- High cohesion – A GRASP evaluative pattern that ensures a class is not too complex and does not perform unrelated functions.
- Low coupling – A GRASP evaluative pattern that measures the degree to which one class depends on or is connected to another class.
- Inception phase – The first phase of the Rational Unified Process dealing with initial conceptualization and the start of the project.
- Inheritance – A subclass inherits attributes or features from its parent (superclass) class. These attributes can be overridden in the subclass.
- Initial state: In a state diagram or activity diagram, this represents the point at which the diagram begins.
- Instance – An object is an instance of a class. The class acts like a template for creating objects. Any number of instances of the class can be created.
- Interface: A classifier that defines attributes and operations that form a behavioral contract. A provider class or component may choose to realize the interface (i.e., implement its attributes and operations). Client classes or components can then depend on the interface, thus using the provider without knowledge of any details of the real provider class.
- Iteration – A mini-project portion where some small piece of functionality is added to the project. Includes a development cycle of analysis, design, and coding.
- Join: A point in an activity diagram where multiple parallel threads of control synchronize and rejoin.
- Member: An attribute or operation in a classifier.
- Merge: A point in an activity diagram where different control paths come together.
- Message – A request from one object to another asking the receiving object to perform some action. This is essentially a call to a method in the receiving object.
- Method – A function or procedure in an object.
- Model – The central UML artifact. Composed of various elements arranged in hierarchies with relationships between elements.
- Multiplicity – Shown next to the external concept box in a domain model and indicates the quantitative relationship of objects with other objects.
- Navigation: Indicates which end of a relationship knows about the other end. A relationship can have bidirectional navigation (each end knows about the other) or unidirectional navigation (one end knows about the other, but not vice versa).
- Notation – Graphical documentation with rules for creating analysis and design methods.
- Note: A textual comment added to a diagram to explain the diagram in more detail.
- Object – In an activity diagram, an object that receives information from or provides information to an activity. In a collaboration or sequence diagram, an object participating in the scenario described in the diagram. Generally: an instance or example of a given classifier (Actor, Class, or Interface).
- Package – A group of UML elements that logically belong together.
- Package diagram: A class diagram where all elements are packages and dependencies.
- Pattern – A solution to the problem of responsibility assignment for object interactions. It is a named solution to a commonly occurring and well-known problem.
- Parameter: A parameter of an operation.
- Polymorphism – Same message, different methods. Also used as a pattern.
- Private: Visibility level applied to an attribute or operation, indicating that only code within the containing classifier can access the member.
- Processor: In a deployment diagram, this represents a computer or other programmable device on which code can be deployed.
- Protected: Visibility level applied to an attribute or operation, indicating that only code within the containing classifier or its subclasses can access the member.
- Public: Visibility level applied to an attribute or operation, indicating that any code can access the member.
- Reading direction arrow – Indicates direction of a relationship in a domain model.
- Realization: Indicates that a component or class provides a given interface.
- Role – Used in a domain model, it is an optional description about the role played by an entity.
- Sequence diagram: A diagram showing the existence of objects over time and the messages passed between those objects over time to perform some behavior. State diagram – A diagram showing all possible states of an object.
- State: In a state diagram, this represents a condition or state of the system or subsystem: what it is doing at a point in time, and its data values.
- State diagram: A diagram showing states of a system or subsystem, transitions between states, and events that cause transitions.
- Static: A modifier applied to an attribute indicating that only one copy of the attribute is shared across all instances of the classifier. A modifier applied to an operation indicating that the operation is independent and does not operate on a specific instance of the classifier.
- Stereotype: A modifier applied to a Model element indicating something that cannot usually be expressed in UML. Essentially, stereotypes allow you to define your own “dialect” of UML.
- Subclass: A class that inherits attributes and operations defined by a superclass through a generalization relationship.
- Swimlane: An element in an activity diagram indicating which part of the system or domain is responsible for a particular activity. All activities in a swimlane are the responsibility of the Object, Component, or Actor represented by the swimlane.
- Time boxing – Each iteration has a fixed time limit with a specific goal.
- Transition: In an activity diagram, this represents the flow of control from one activity or branch or merge or fork or join to another. In a state diagram, this represents a change from one state to another.
- Transition phase – The final phase of the Rational Unified Process in which users are trained to use the new system and the system is made available to users.
- UML – Unified Modeling Language enhances analysis and design of software projects by allowing tighter relationships between objects through text and graphical documentation.
- Use case: In a use case diagram, this represents an action taken by the system in response to some request from an Actor.
- Use case diagram: A diagram showing relationships between Actors and Use Cases.
- Visibility: A modifier for an attribute or operation indicating which code can access the member. Visibility levels include Public, Protected, and Private.
- Workflow – A set of activities that produce some specific result.
Popular UML Books
Here are some of the best-selling UML books you can read to learn UML:
- UML Distilled: A Brief Guide to the Standard Object Modeling Language
- UML 2 and the Unified Process: Practical Object-Oriented Analysis and Design
- Learning UML 2.0
- Building Web Applications with UML
- The Unified Modeling Language Reference Manual
- The Elements of UML™ 2.0 Style
- UML for Java Programmers
- Schaum’s Outline of UML
- The Unified Modeling Language User Guide
- UML 2 Certification Guide: Fundamental and Intermediate Exams
- Fundamentals of Object-Oriented Design in UML
- Applying Use Case Driven Object Modeling with UML: An Annotated E-Commerce Example
- Designing Flexible Object-Oriented Systems with UML
- Use Case Driven Object Modeling with UML
- Systems Analysis and Design with UML Version 2.0: An Object-Oriented Approach
- UML 2.0 in a Nutshell
- Object-Oriented Analysis and Design with Applications
- UML Explained
- Design Patterns: Elements of Reusable Object-Oriented Software
- The Object Primer: Agile Model-Driven Development with UML 2.0
Related Links