


Introduction to Data Modeling and Database Engineering
In the architecture of modern software systems, the database serves as the foundation. Whether you are building a simple inventory application or a complex enterprise resource planning system, the structural integrity of your data determines the system’s performance, scalability, and maintainability. This is where theEntity Relationship Diagram (ERD) becomes indispensable.
An ERD is not merely a drawing; it is a blueprint. It provides a visual representation of the major entities within a system’s scope and illustrates the inter-relationships among them. By mastering ERDs, developers and database engineers can ensure high-quality database design, streamline communication between stakeholders, and prevent costly architectural errors.
This comprehensive guide explores the fundamentals of ERDs, the nuances of conceptual, logical, and physical data models, and how modern advancements—specifically DB Modeler AI—are revolutionizing the way databases are designed by transforming plain English requirements into production-ready schemas.
What is an Entity Relationship Diagram (ERD)?
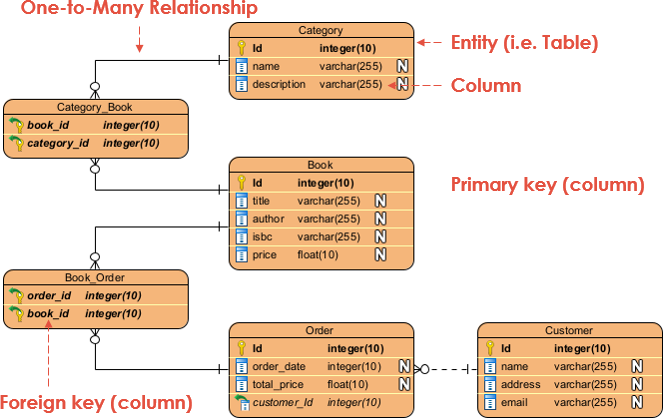
An Entity Relationship Diagram, also known as an ER Model, is a structural diagramused primarily in database design. It utilizes a specific set of symbols—such as rectangles, diamonds, and connecting lines—to visualize two critical components of a system:
- Entities: The major objects or concepts within the system (e.g., a Student, a Product, or a Transaction).
- Relationships: How these entities interact or associate with one another.
ERDs are essential for debugging database issues, planning database patches, and gathering requirements for information systems. By visualizing the schema, engineers can identify design flaws before they are cemented in code.
Key Components and Notations
To read or draw an ERD effectively, one must understand its core notations.
1. Entities
An entity represents a definable thing or concept. In a physical database, an entity corresponds to a table. In an ER diagram, entities are typically depicted as rounded rectangles containing the entity name at the top. Examples include nouns like Invoice, Role, or Profile.
2. Attributes
Attributes are the properties or characteristics that describe an entity. In a database table, these are the columns. Each attribute has a name and a data type (e.g., varchar for strings, int for integers).
- Primary Key (PK): A unique attribute that defines a specific record in a table. No two records can share the same Primary Key.
- Foreign Key (FK): A field that links to the Primary Key of another table, establishing a relationship between the two entities.
3. Relationships and Cardinality
Relationships describe how entities associate with one another. Cardinality defines the numerical nature of this relationship—specifically, the number of instances in one entity associated with instances in another. In ERD notation, this is often represented by “crow’s foot” symbols at the ends of connectors.
- One-to-One: Often used to split an entity to keep information concise.
- One-to-Many: The most common relationship. For example, one Team has many Players, but a Player belongs to only one Team.
- Many-to-Many: For example, a Student can enroll in many Courses, and a Course can have many Students. In a physical database, this is usually resolved using a junction or associative table.
The Three Levels of Data Modeling
Data modeling is an iterative process that typically moves through three levels of abstraction, each serving a different purpose and audience. Understanding the distinction between Conceptual, Logical, and Physical models is vital for successful database engineering.
| Feature | Conceptual Data Model | Logical Data Model | Physical Data Model |
|---|---|---|---|
| Purpose | High-level view of business objects and system architecture. | Detailed structure of data entities and relationships, independent of specific technology. | Actual design blueprint for a specific Relational Database Management System (RDBMS). |
| Target Audience | Business Stakeholders, Business Analysts. | Data Architects, Business Analysts. | Database Administrators (DBA), Developers. |
| Entities | Yes (Business concepts). | Yes (Operational entities). | Yes (Tables). |
| Columns/Attributes | No (or very high level). | Yes (Explicit attributes defined). | Yes (With specific data types, lengths, nullable status). |
| Relationships | Yes. | Yes. | Yes. |
| Primary/Foreign Keys | No. | Optional (often defined here). | Yes (Strictly defined). |
1. Conceptual Data Model
This model identifies the highest-level relationships between different entities. It focuses on what data exists, not how it is stored. It supports generalization (e.g., a “Triangle” is a kind of “Shape”).
2. Logical Data Model
This enriches the conceptual model by defining specific attributes (columns) for each entity. It introduces operational and transactional entities but remains neutral regarding the database software (e.g., it doesn’t care if you use MySQL or PostgreSQL).
3. Physical Data Model
This is the technical specification. It assigns specific types (e.g., VARCHAR(255)), defines constraints, and adheres to the naming conventions of the target DBMS. This model is ready for SQL generation.
The Evolution of Design: DB Modeler AI
Traditionally, drawing these diagrams and converting them into SQL code was a manual, labor-intensive process requiring deep technical knowledge of normalization rules. However, the landscape has shifted with the introduction of AI-powered tools.
DB Modeler AI byVisual Paradigm represents the next generation of database design. It bridges the gap between abstract ideas and executable code, allowing users to transform a problem description into a normalized, production-ready database schema in minutes.
Why Use AI for Data Modeling?
- Speed: Rapidly prototype and validate database layers for projects.
- Education: It acts as a tutor, explaining normalization steps (1NF to 3NF) and best practices.
- Accuracy: AI assists in identifying necessary tables and relationships that a human designer might overlook.
- Interactive Testing: Immediate validation through a built-in SQL playground.
Step-by-Step Guide: From Idea to SQL with DB Modeler AI
Modern ERD tools have moved beyond simple drawing applications. Here is how you can use an AI-driven approach to generate a complete database schema in seven steps:
Step 1: Problem Input
Instead of manually dragging shapes onto a canvas, you begin by describing your application in plain English. For example, “I need a system for a library where members can borrow books, and fines are calculated for late returns.” The AI analyzes this input to generate detailed technical requirements.
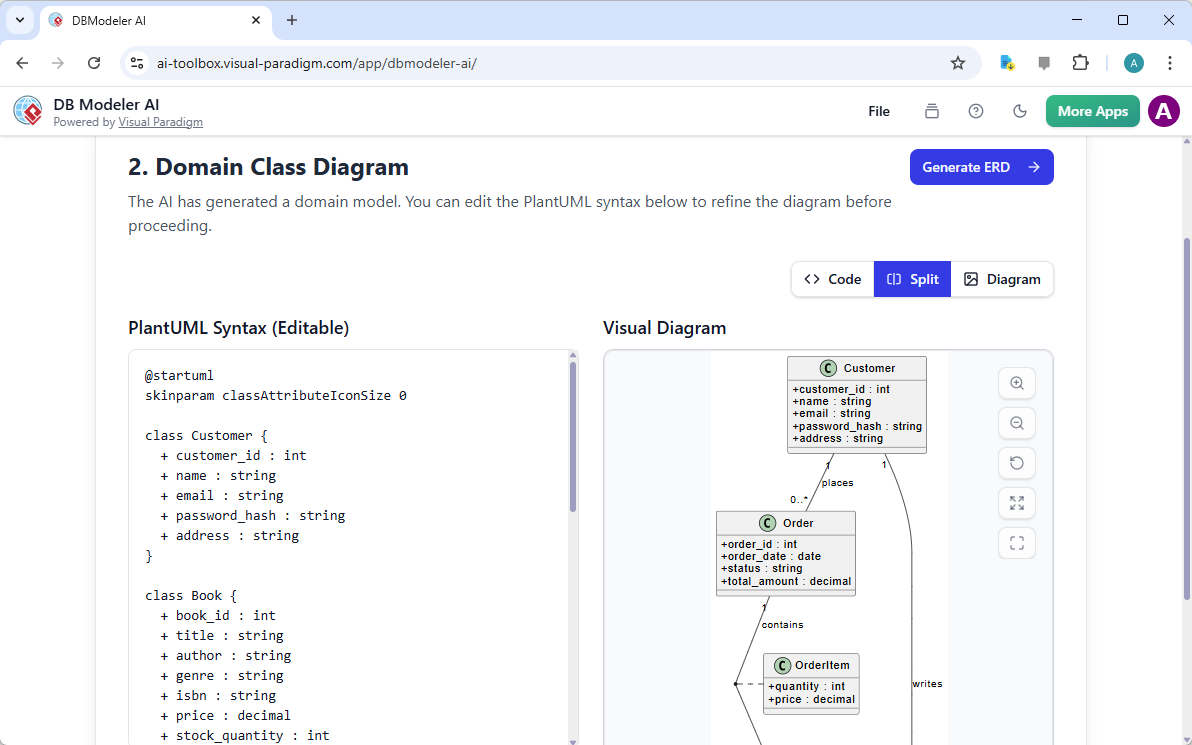
Step 2: Domain Class Diagram
The system visualizes high-level objects and their attributes using a PlantUML diagram. This allows for an initial architectural review before diving into database specifics.
Step 3: ER Diagram Generation
The domain model is converted into a database-specific ER diagram. The AI automatically defines keys, identifies relationships, and suggests cardinality.

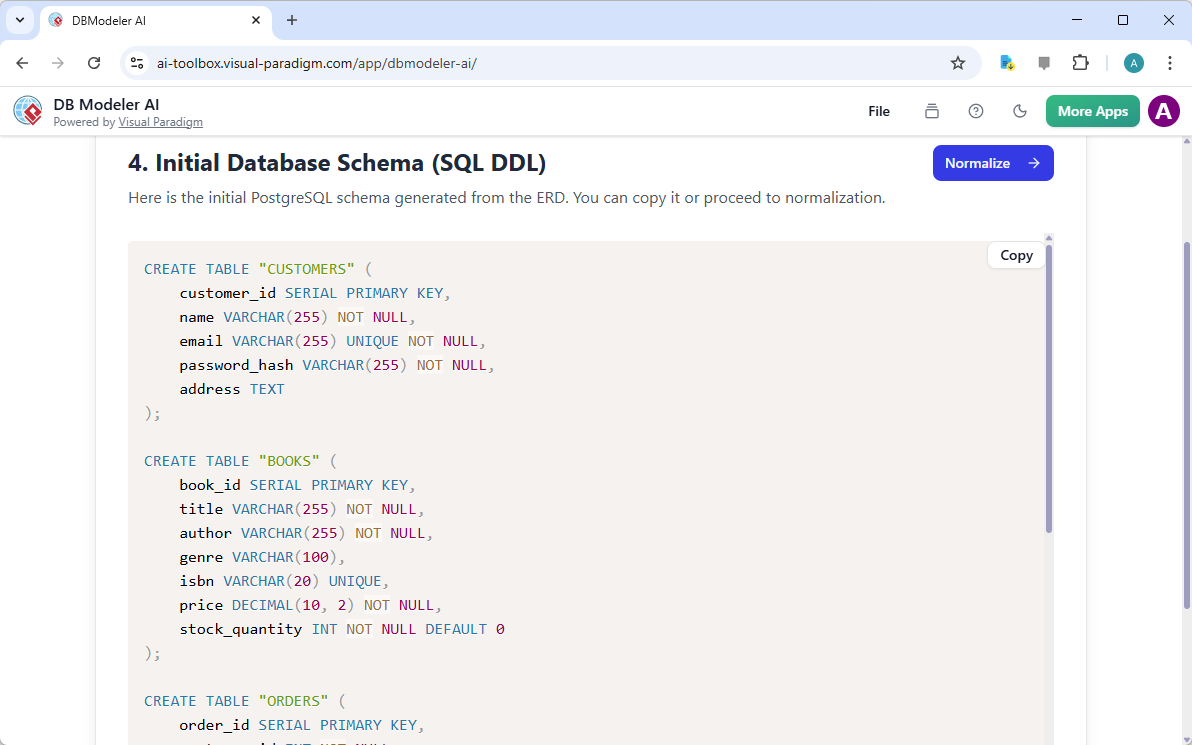
Step 4: Initial Schema Generation
The visual ERD is translated into a raw database schema, producing PostgreSQL-compatible SQL DDL statements.
Step 5: Intelligent Normalization
This is a critical advantage of AI. The tool progressively optimizes the schema through the forms of normalization:
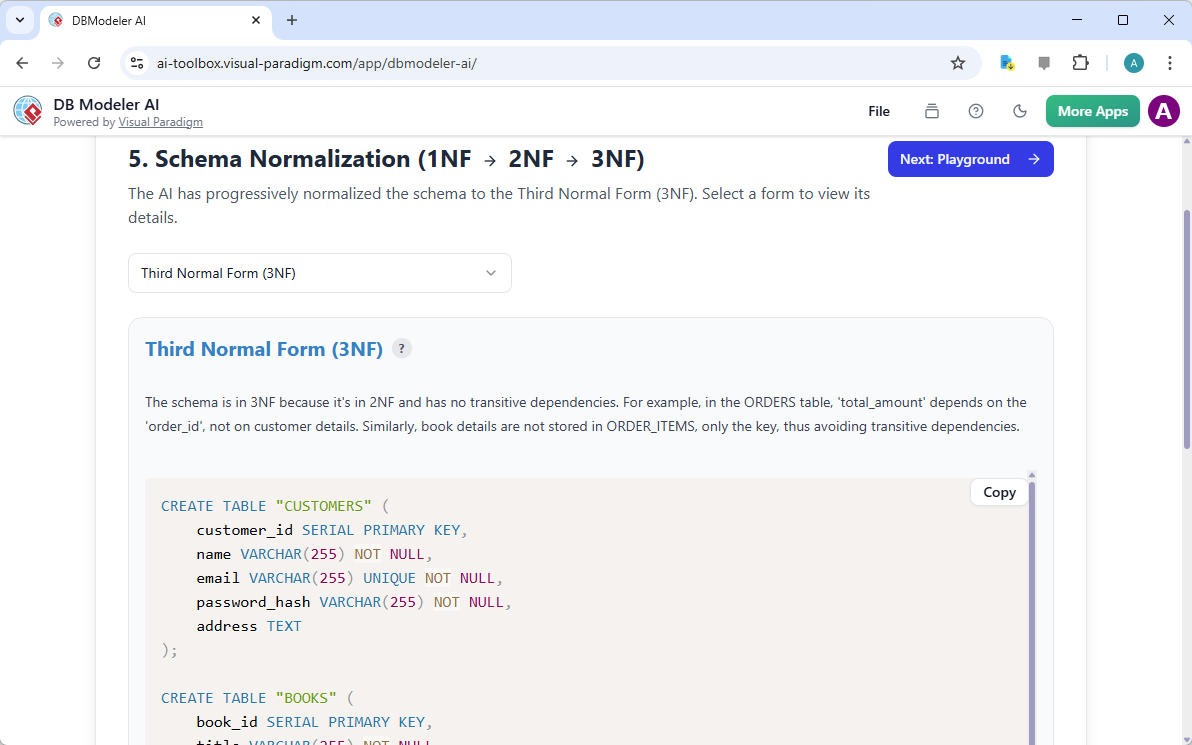
- First Normal Form (1NF): Eliminates repeating groups.
- Second Normal Form (2NF): Removes partial dependencies.
- Third Normal Form (3NF): Removes transitive dependencies.
Uniquely, DB Modeler AI provides rationales for every change, helping the designer understand why a table was split or a relationship modified.
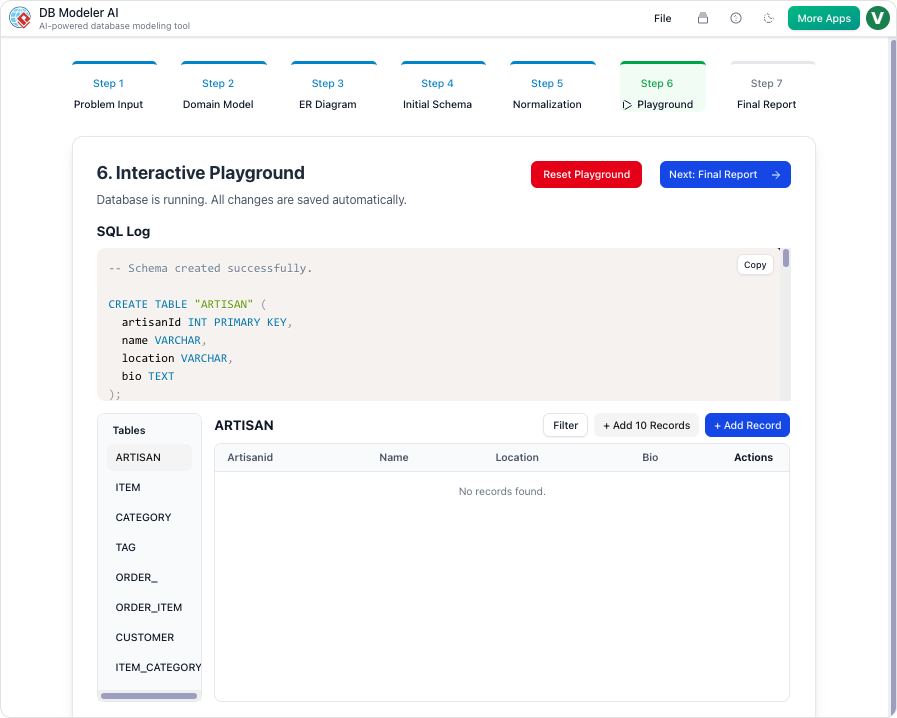
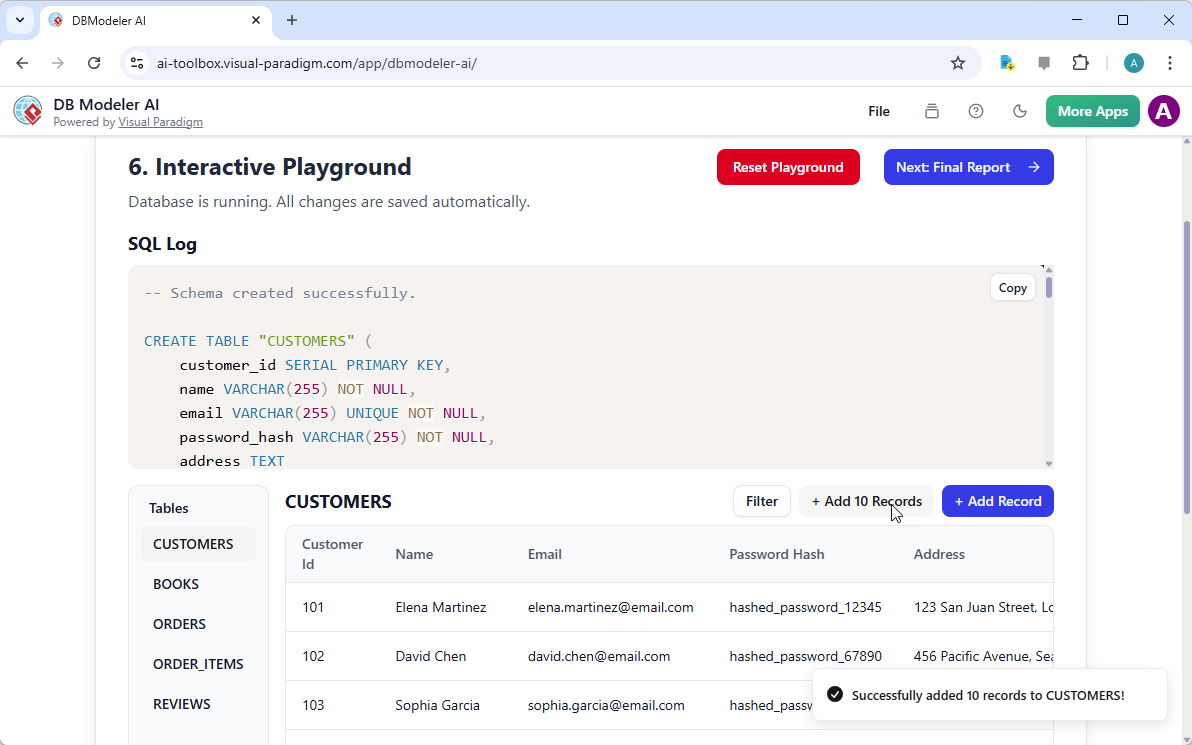
Step 6: Interactive Playground
Once the schema is finalized, you don’t need to install a database to test it. The tool provides an in-browser SQL client seeded with realistic, AI-generated dummy data. You can run queries immediately to verify that the design meets your business requirements.
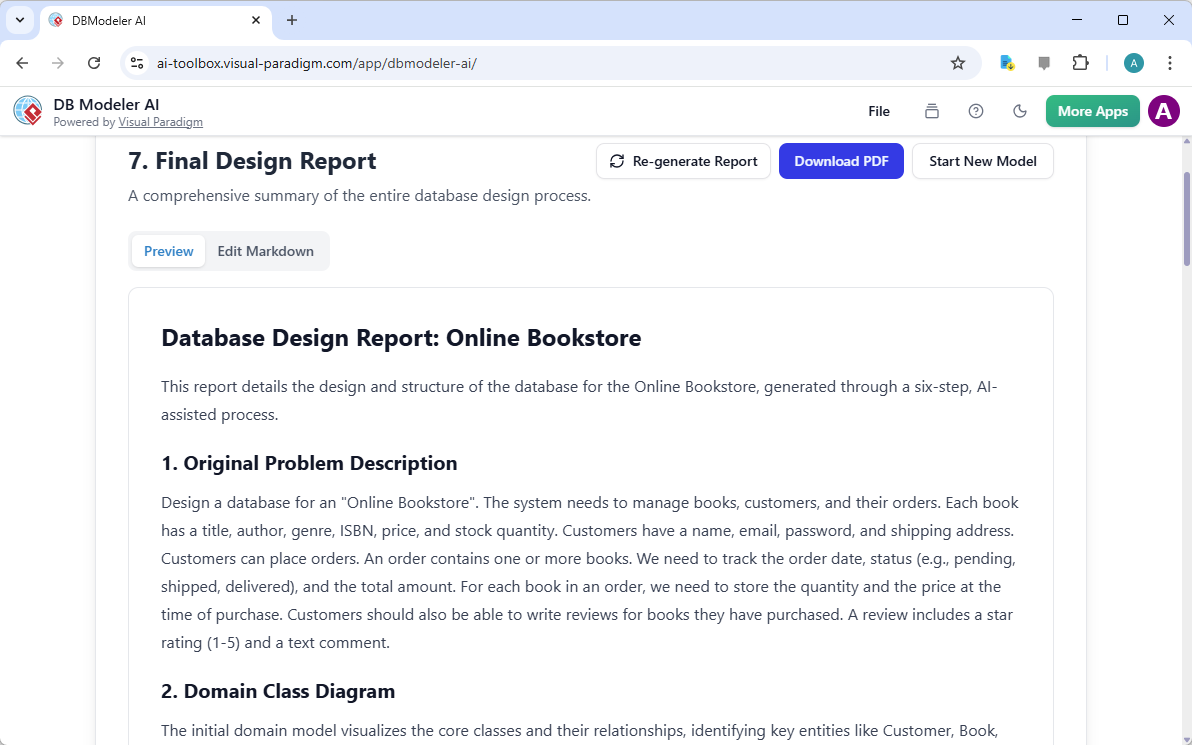
Step 7: Final Report and Export
Finally, you can export the entire package—diagrams, documentation, and SQL scripts—as a PDF or JSON file, ready for integration into your development pipeline.
Integrating ERDs with Other System Diagrams
An ERDdoes not exist in a vacuum. To create a successful software project, data models should be aligned with process models.
ERD and Data Flow Diagrams (DFD)
While an ERDshows the structure of data, a Data Flow Diagram (DFD) visualizes the movement of information. In a DFD, a “Data Store” symbol often correlates directly to an entity in your physical ERD. Mapping these together ensures that every process has the necessary data to function.
ERD and Business Process Modeling (BPMN)
In Business Process Model and Notation (BPMN), “Data Objects” represent inputs and outputs of process activities. Aligning your conceptual or logical ERD with your BPMN diagrams ensures that your business workflows are supported by a robust data structure.
Conclusion
The Entity Relationship Diagram remains a cornerstone of effective software engineering. It provides the visual clarity needed to design complex systems and communicate with stakeholders. However, the method of creating these diagrams is evolving.
By leveraging tools likeDB Modeler AI, developers and architects can move beyond manual drafting. They can now utilize AI to ensure strict normalization, generate test data instantly, and transition seamlessly from a conceptual problem description to a physical, production-ready SQL database. Whether you are a student learning the ropes or a seasoned architect, combining fundamental ERD knowledge with AI automation is the key to efficient, error-free database design.
Resources
- AI-Powered Database Modeling with DBModeler AI: The DBModeler AI tool enables intelligent database schema design and automated modeling directly within Visual Paradigm.
- Comprehensive Review of DBModeler AI for Schema Design: This detailed review explains how DBModeler AI transforms the database schema design process through automation and artificial intelligence.
- DBModeler AI: Intelligent Database Modeling Tool: This AI-driven tool provides automated database modeling and schema generation to simplify complex database development.
- DBModeler AI – Rapid Database Design: This tool supports rapid database design by generating domain models, Entity-Relationship Diagrams, normalized schemas, and testable database environments.
- The Comprehensive Guide to DBModeler AI – Cybermedian: Visual Paradigm’s DBModeler AI enhances database design by providing expert guidance, visual diagramming, and live SQL testing features.
- Visual Paradigm’s AI Diagram Generator Expands Instant Creation Capabilities: The AI-powered diagram generator in Visual Paradigm has been expanded to support the instant creation of ERDs and other technical diagrams.
- New Diagram Types Added to AI Diagram Generator: DFD & ERD: Support for Entity-Relationship Diagrams has been added to the AI diagram generation feature to enable more comprehensive data modeling capabilities.
- Comprehensive Guide to Visual Paradigm AI Table Generator: From Natural Language to Executable Code: This guide explains how to transform natural language descriptions into functional database tables and executable code using an AI-powered table generation engine.
- Visual Paradigm ERD Tool – Create Entity-Relationship Diagrams Online: This web-based ERD tool allows users to design database schemas intuitively through a drag-and-drop interface.
