


Velocity is a very simple yet powerful way to accurately measure how fast a Scrum development team delivers business value over time. It provides an indication of the average amount of the Product Backlog transformed into a product increment during each Sprint by a Scrum team, with the development team using tracking. Therefore, to calculate the Agile team’s velocity, simply sum up the estimates of features, user stories, requirements, or backlog items successfully delivered during an iteration. The team should:
- Predict the scope that can be delivered by a specific date.
- Predict the date when a fixed number of scopes will be delivered.
- Understand our limitations when defining how much scope we commit to deliver in a Sprint.
Scrum Velocity Example
Before completing a few iterations, there are some simple guidelines for estimating a Scrum team’s initial velocity, but afterward, your team can use validated historical velocity estimation methods for Sprint Planning. Based on a series of past Sprints, velocity estimates usually stabilize and provide a more reliable foundation for improving short- and long-term planning accuracy for Scrum projects.
Note:
Velocity measures the amount of work a team can complete in a single Sprint and is a key metric in Scrum. It is calculated by summing up the points of all fully completed user stories at the end of a Sprint. Points for partially completed or incomplete stories should not be included in the calculation.
Step 1 – Calculate the velocity of the first iteration (Sprint)
At the end of each iteration, the team adds up the effort estimates associated with user stories completed during that iteration. This total is called velocity.
An Agile team has started an iteration, planning to complete Story A and Story B, estimated at 2 points and Story C, estimated at 3 points. At the end of the iteration, Story A and Story B are 100% complete, but Story C is only 80% complete. Agile teams usually recognize only two completion levels: 0% or 100%. Therefore, Story C does not count toward velocity, and the velocity for this iteration is 4 points.
Step 2 – Use Velocity to Estimate the Number of Iterations Required
After understanding the velocity from Step 1, the team can calculate (or revise) the estimate of how long it will take to complete the project based on the estimates of the remaining user stories, assuming the velocity in future iterations remains roughly the same. This is usually an accurate prediction, even if it’s rarely an exact one.
Assume the remaining user stories represent a total of 40 points; the team’s forecast for the remaining work is 10 iterations.
Relationship Between Velocity and Story Points in Scrum
Story points are used to measure size and complexity—essentially, how long it will take to complete a task. Story points are a relative measure of the time required to complete a user story. This concept is borrowed from XP. They are used to assess the difficulty of a story, not to commit to how long it will take. This allows you to use story points regardless of team size or task type.
How to link velocity with story points?
- Teams often use “velocity” as a productivity metric to tell outsiders exactly how fast a Scrum team is.
- If story point estimates remain consistent throughout the project, it makes sense to use story points to represent “velocity”.
- If consistency is maintained not only within a team but also across teams and even across the entire company, it allows for measuring productivity and comparing team performance.
- If story point values remain stable, they can be used as a reference for release planning. You can evaluate possible timelines later.
How to Assign Story Points to a User Story?
A story point is a relative unit of measurement. The first step your team should take is to define one story as a baseline so they can estimate other stories relative to this reference. According to literature, the team should identify the simplest story in the backlog and assign it 1 story point, then use that story as a baseline to estimate other stories.
There are two types of scales used to create story point estimates:
- Linear Scale (1, 2, 3, 4, 5, 6, 7, …)
- Fibonacci Sequence (0.5, 1, 2, 3, 5, 8, 13, …)
It’s a good idea to estimate your first user story that your team is familiar with and knows how long it takes to complete. Then estimate your next user story. If your team believes it takes less time than the baseline story, place it to the left of the baseline. Then estimate another user story. If the team decides it takes less time than the baseline but more than the second story, place it between the baseline and the second story. In this example, we use the Fibonacci sequence for story estimation:
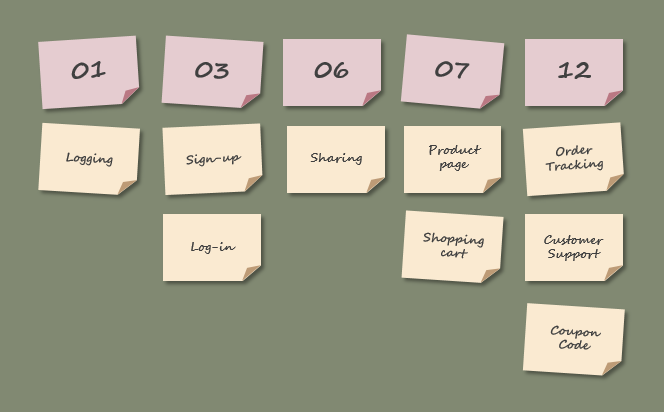
User Story Story Points
How to Estimate Velocity More Accurately?
In Scrum, velocity helps you understand how long it takes a team to complete the product backlog. However, it usually takes a few Sprints before the team finds a more stable velocity. To estimate the team’s velocity more accurately, we can draw on the team’s past tracking records. This will more accurately predict how many stories the team can complete in a Sprint. For forecasting purposes, the average of the last three or four Sprint velocities should be used.
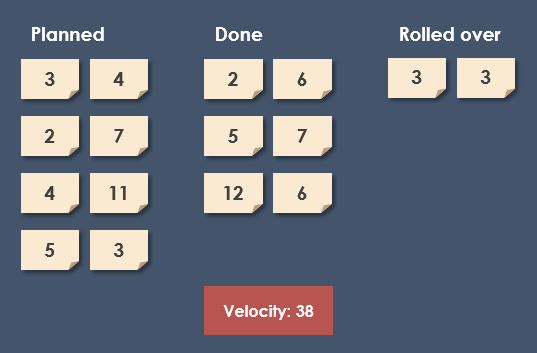
Assume a new Scrum team plans to complete 41 story points in their first Sprint. They end up completing only 38 story points and carry forward 6 story points to the next Sprint. So their velocity is 38, as shown below:
Scrum Velocity
Average Velocity Based on Past Sprint Tracking
As previously mentioned, teams should not include any partially completed work in velocity. Only user stories marked as “Done” count, even if only a small portion of the task remains.
Velocity based on a single Sprint is not a very reliable metric for forecasting. (But it does help the team understand how much work they can commit to in a single Sprint.) Let’s track their progress over further Sprints.
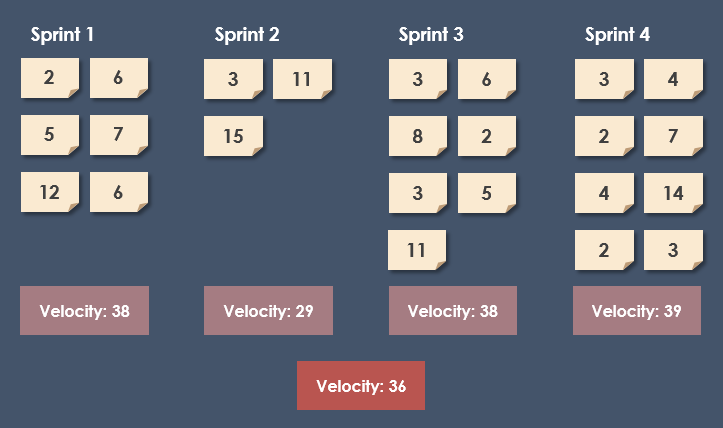
Now, the new team continues developing from Sprint 1 to Sprint 4. The story points completed in each Sprint are: 38, 29, 38, and 39. The average velocity after four Sprints is 36, as shown below:
Scrum Velocity Over Sprints
This average, based on four Sprints, is far more useful than a snapshot after just one Sprint. It’s easy to imagine that if the backlog already has user stories estimated, we can use this velocity for forecasting. We can predict how fast the team will complete all the work. We can make informed guesses about what features we can deliver in the upcoming release.
Velocity Chart
If a Scrum team has completed multiple Sprints, the team can use the velocity report to forecast release and product completion dates, and better plan future projects. Based on the velocity from previous Sprints shown in the report, you can achieve the following:
- Track the amount of work completed by your team in each Sprint.
- If your team composition and Sprint duration remain unchanged, estimate how much backlog work your team can handle in future Sprints.
Based on the example above, the velocity chart shows the amount of work completed in each of the 4 Sprints by the Scrum team:
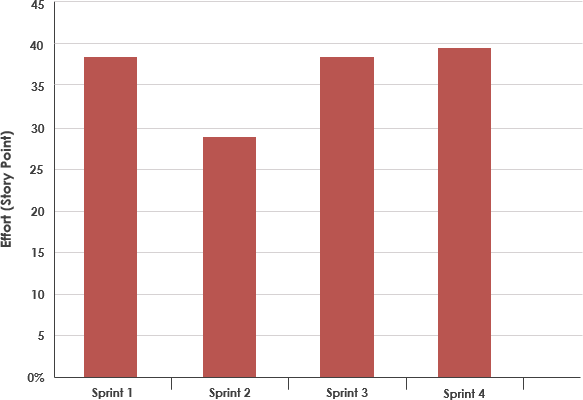
Scrum Velocity Chart
