


Turn raw data into clear, actionable insights in seconds, no coding or steep learning curve required.
Visual Paradigm’s AI-Powered BI Analytics is a smart, browser-based tool that lets anyone (business analysts, managers, marketers, or complete beginners) upload data, ask questions in plain English, and instantly get professional-grade pivot tables, charts, and narrative reports. Whether you have your own CSV, need a realistic dataset generated on the spot, or want to explore ready-made industry examples, the built-in AI does the heavy lifting: it suggests the best ways to slice your data, spots trends and outliers, and writes polished summaries, SWOT analyses, or executive reports for you.
Perfect for sales performance reviews, marketing ROI tracking, financial variance analysis, HR insights, and more, all without writing a single formula or query.
Get started in under a minute at ai.visual-paradigm.com/tool/ai-powered-bi-analytics. No installation, no signup required for most features. Just bring a question, and let the AI deliver the answers.
1. Introduction to AI-Powered BI Analytics
Visual Paradigm’s AI-Powered BI Analytics is a browser-based tool that democratizes business intelligence (BI). It leverages AI to handle data ingestion, exploration, visualization, and reporting—turning raw numbers into narrative-driven insights without coding or complex setups. Key strengths include:

- AI Data Generation: Create synthetic datasets from natural language prompts.
- Seamless Integration: Supports CSV uploads, pasting, or gallery examples.
- Intelligent Outputs: Automated pivot tables, charts, and reports like SWOT analyses or executive summaries.
Access it at ai.visual-paradigm.com/tool/ai-powered-bi-analytics. No login required for basic use, and it’s optimized for quick sessions.
2. Getting Started: Quick Setup
- Launch the Tool: Head to the URL above. The interface greets you with a three-step wizard: Data Source → Pivot Table → Analysis.
- Browser Compatibility: Works best on modern browsers like Chrome or Edge; enable JavaScript for AI features.
- Pro Tip: Bookmark the Example Gallery for recurring use cases like sales forecasting or inventory tracking.
3. Flexible Data Input Options
The tool shines in making data accessible. Here’s how to handle inputs:
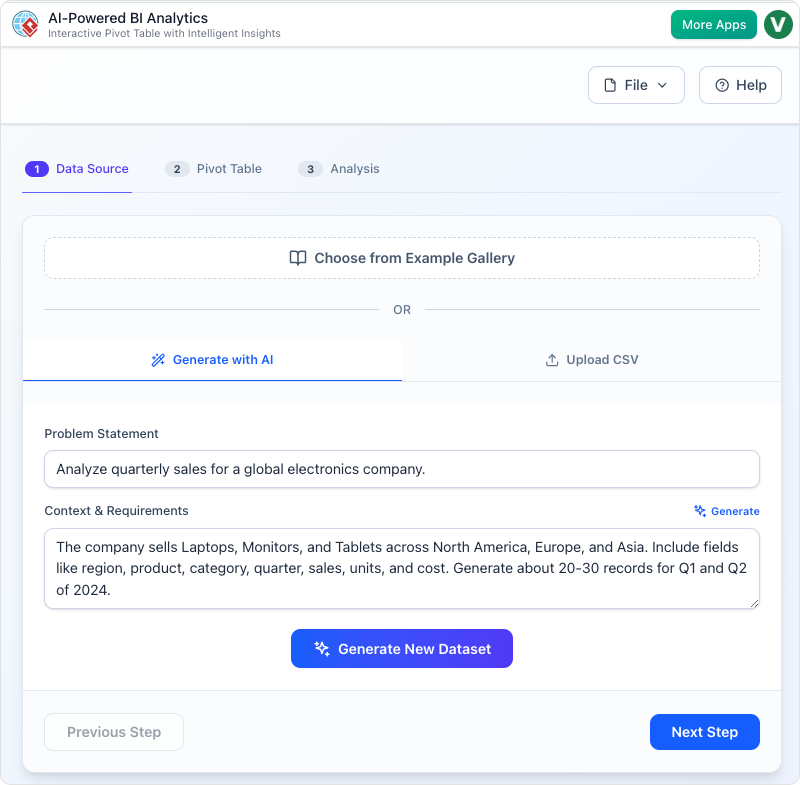
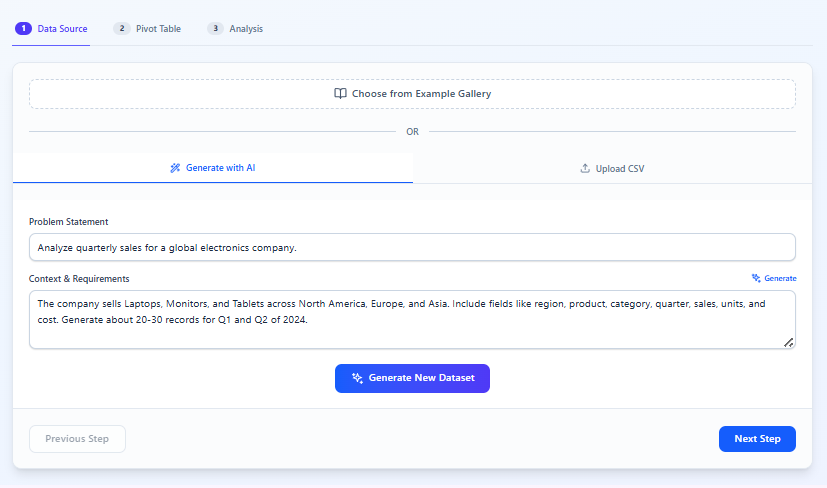
A. AI-Generated Data (As in Your Screenshots)
- In the Data Source tab, click Generate with AI.
- Enter a problem statement: e.g., “Analyze quarterly sales for a global electronics company. The company sells laptops, monitors, and tablets across North America, Europe, and Asia. Include fields like region, product, category, quarter, sales, units, and cost. Generate about 20-30 records for Q1 and Q2 of 2024.”
- Hit Generate New Dataset. The AI creates a realistic CSV-like structure instantly (e.g., ~25 rows with varied sales figures).
B. Upload or Paste CSV
- Click Upload CSV to drag-and-drop a file (up to 10MB recommended).
- Or paste raw CSV text directly—ideal for quick tests from Excel exports.
- Validation Tip: The tool auto-detects schemas but flags issues like missing headers; clean data in advance for smoother pivots.
C. Example Gallery
- Select from pre-loaded scenarios (e.g., “E-commerce Sales” or “Marketing ROI”).
- Why Use It?: Great for learning—each example includes sample insights to benchmark your own data.
4. AI-Driven Intelligence & Reporting
Once data is loaded, the magic happens in the Pivot Table and Analysis tabs.
A. Building Pivot Tables (Your Second Screenshot)
-
Drag fields to Row Field (e.g., “Region”), Column Field (e.g., “Quarter”), and Value Field (e.g., “Sales” with Sum aggregation).
-
Example Output (Based on Your Generated Data):
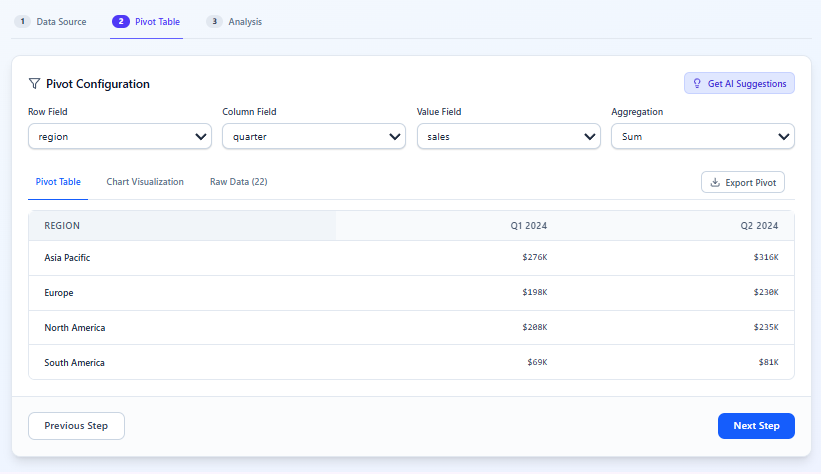
Region Q1 2024 Q2 2024 Asia Pacific $27K $31K Europe $19K $23K North America $28K $35K South America $8K $11K -
Click Get AI Suggestions for auto-configurations, like adding “Product Category” for deeper breakdowns.
-
Chart Visualization: Toggle to bar/line charts for trends—e.g., North America’s Q2 surge highlights growth opportunities.
B. Automated Narrative Reports (Your Third Screenshot)
- In the Analysis tab, select Quick Insights or SWOT Analyses.
- Click Generate Report to produce a polished PDF/Word doc with:
- Key findings: “North America led Q2 sales at $35K, up 25% QoQ, driven by laptop demand.”
- Visuals: Embedded charts from your pivot.
- Recommendations: AI-suggested actions, like “Target Asia Pacific with monitor promotions to close the gap.”
- Customization: Edit tones (e.g., formal for execs) or add filters pre-generation.
C. Conversational AI Assistant
- Chat in plain English: “What’s the top product in Europe for Q1?”
- Responses include visuals and drill-downs—perfect for ad-hoc queries.
5. Step-by-Step Workflow with Your Electronics Example
Let’s apply this to the sales dataset from your screenshots:
- Data Source: Generate the dataset as described—yields ~25 records with fields like Region (North America, Europe, Asia, South America), Product (Laptops, Monitors, Tablets), Quarter (Q1/Q2 2024), Sales ($K), Units, Cost.
- Pivot Table:
- Rows: Region
- Columns: Quarter
- Values: Sum of Sales
- Result: Reveals North America’s dominance ($63K total), suggesting regional investment priorities.
- Analysis:
- Choose Quick Insights.
- Generate Report: AI outputs a 2-page summary noting a 20% overall QoQ growth, with Asia Pacific as a high-potential underperformer.
- Query Assistant: Ask, “Compare laptop vs. tablet costs”—uncovers tablets’ higher margins (45% vs. 32%).
- Export & Iterate: Download the report as PDF; tweak the pivot (e.g., add “Units” for efficiency metrics) and regenerate.
6. Best Practices & Advanced Tips
- Data Prep: Limit rows to <1,000 for faster AI processing; use consistent date formats (e.g., YYYY-MM).
- Insight Maximization: Combine with Deep Dives for anomaly detection (e.g., spotting Q1 dips in South America).
- Scalability: For larger datasets, integrate with Visual Paradigm’s DBModeler AI for database syncing.
- Common Pitfalls: Avoid overly vague prompts—specifics like “20-30 records” yield better results. If uploads fail, check for encoding (UTF-8 preferred).
- Security Note: Data is processed client-side where possible; review Visual Paradigm’s privacy policy for enterprise use.
7. Real-World Use Cases
- Sales Teams: Track regional performance to allocate budgets dynamically.
- Finance: Variance analysis for cost overruns in product lines.
- Marketing: ROI breakdowns by quarter to refine campaigns.
- HR/Operations: Adapt for non-sales data, like employee turnover by department.
8. Troubleshooting & Next Steps
- AI Suggestions Not Appearing? Refresh the page or simplify your schema.
- Support: In-app chat or Visual Paradigm’s docs at ai.visual-paradigm.com.
- Extend It: Pair with other Visual Paradigm AI tools, like their Flipbook Maker for report-to-ebook conversion.
This tool truly accelerates BI from hours to seconds—your electronics example is a great starter for sales pros. If you’d like me to simulate a full report for a custom dataset, expand on a specific step, or troubleshoot an issue, just share more details! Ready to dive deeper?
