What is a PERT Chart?
A PERT Chart (Program Evaluation and Review Technique) is a project management tool that visualizes the sequence of activities in a project as a network diagram. It uses:
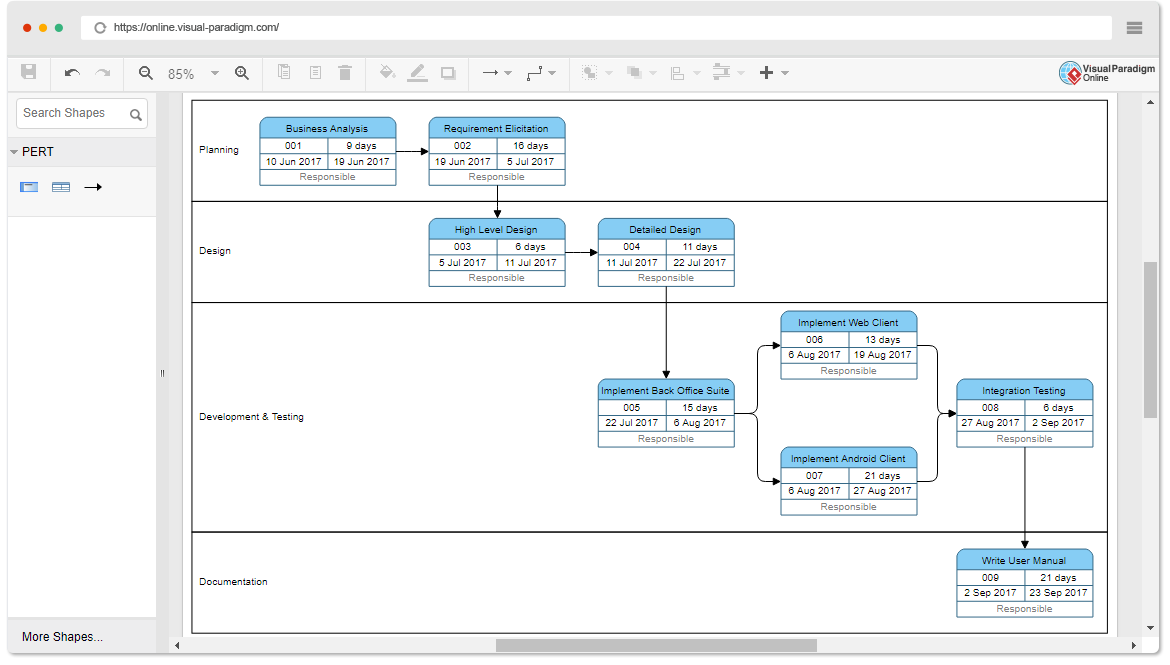
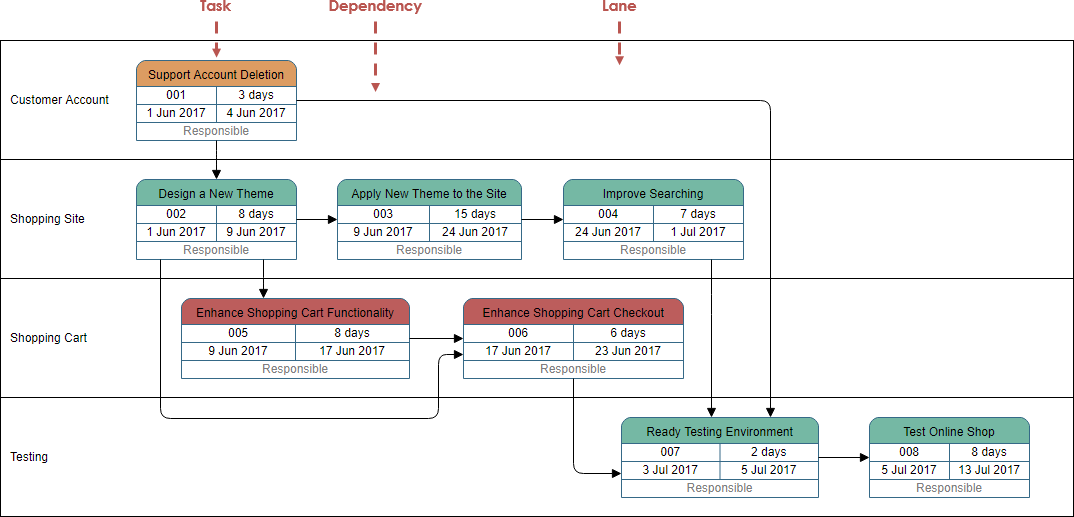
- Nodes (representing events, milestones, or sometimes activities).
- Arrows (representing tasks/activities and their dependencies: sequential, parallel, or conditional).
- Three-point time estimates for each activity: Optimistic (O), Most Likely (M), and Pessimistic (P).
- The Expected Time (TE) is calculated using the formula: TE = (O + 4M + P) / 6
- Critical Path Method (CPM) integration identifies the longest path of dependent tasks that determines the minimum project duration, with slack times and variances often displayed.
PERT charts excel at handling uncertainty in task durations and highlighting risks through the critical path.
Visual Paradigm’s AI-Powered PERT Chart Support
Visual Paradigm enhances traditional PERT charting with AI to eliminate manual drafting, dependency linking, and calculations. The AI analyzes plain English descriptions (or detailed inputs with time estimates) to generate complete network diagrams, including:
- Automatic task and milestone identification.
- Smart dependency mapping (sequential, parallel, finish-to-start, etc.).
- Three-point estimates and expected durations (derived from text or explicit values).
- Forward/backward passes for earliest/latest times and slack.
- Automatic highlighting of the critical path.
- Dynamic, real-time updates when tasks, durations, or dependencies change—no need to redraw.
This saves hours of work, reduces errors, and supports complex, multi-task projects with parallel workflows.
Key Concepts in AI-Powered PERT Charts
- AI-Generated Structure: The AI parses natural language to extract tasks, sequences, and milestones into a standards-compliant network.
- Automatic Dependency Mapping: Infers and draws connections without drag-and-drop.
- Critical Path Method (CPM) Analysis: Automatically computes and highlights the critical path to reveal schedule drivers and bottlenecks.
- Dynamic Updating: Edit any element (e.g., add tasks, change durations), and the chart recalculates instantly.
- Three-Point Estimation & Calculations: Supports optimistic/most likely/pessimistic inputs for probabilistic scheduling.
Why Use AI-Powered PERT Charts in Visual Paradigm?
- Accelerated Planning — Generate full charts in seconds from text, bypassing slow manual setup.
- Improved Accuracy — AI minimizes human errors in dependencies, paths, and calculations.
- Enhanced Visualization — Produces clear, professional diagrams with balanced layouts, perfect alignment, and critical path emphasis.
- Better Collaboration & Integration — Embed live diagrams in OpenDocs for team editing/sharing; export or link to other tools (e.g., Gantt charts); supports documentation workflows.
- Risk Management — Quickly spot critical tasks and potential delays.
- Accessibility — No deep PERT expertise required—ideal for project managers, teams, students, and analysts.
How to Use AI-Powered PERT Charts
The feature is accessible in multiple ways across Visual Paradigm products.
Method 1: In Visual Paradigm Desktop (Professional Edition)
- Open Visual Paradigm Desktop.
- Navigate to the AI Diagram Generation tool (often under AI tools or diagram creation).
- Select PERT Chart as the diagram type.
- Enter a natural language description (e.g., “Create a 3-month website development project with planning, design, development, testing, and deployment phases, including dependencies and time estimates”).
- Click Generate — AI builds the chart with nodes, arrows, durations, and critical path.
- Refine in the editor: Adjust labels, durations, dependencies, layout, or add details.
- Save, export, or integrate into projects.
Method 2: Via AI Chatbot (Visual Paradigm Online or Desktop with Subscription)
- Access the AI Chatbot (e.g., at chat.visual-paradigm.com or within the app).
- Type a prompt like: “Generate a PERT chart for developing and launching a mobile application from planning to release, show dependencies and critical path.”
- Include details: “With O/M/P times for design (3,5,8 days), development (5,10,20 days), testing (2,4,6 days).”
- The AI generates and displays the chart interactively.
- Use follow-up commands to refine (e.g., “Add security audit task” or “Highlight critical path”).
- Export or import into your workspace.
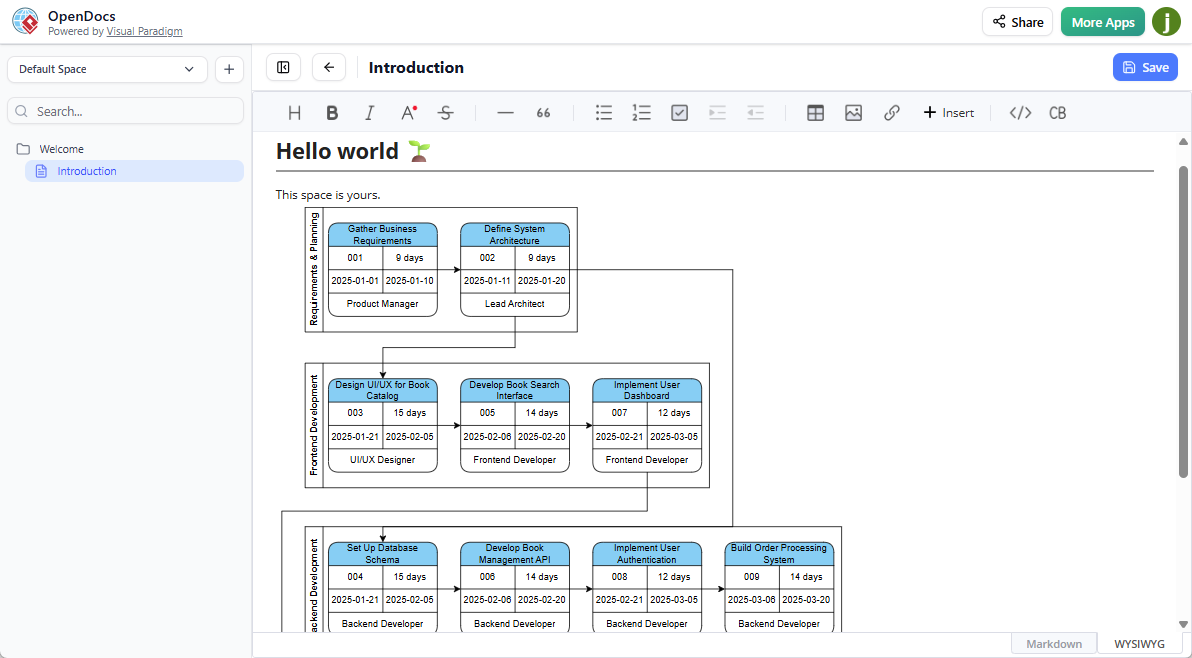
Method 3: In OpenDocs (AI-Powered Documentation Tool)
- Log in to Visual Paradigm Online (Combo Edition) and open/create an OpenDocs page.
- Click Insert > Diagrams tab > PERT Chart.
- In the editor, click Create with AI (top-right).
- Input your project description and generate.
- Edit as needed, then Save and embed the live diagram into the document for collaboration.
Note: Availability requires Professional Edition (Desktop) or Combo Edition (Online). The feature integrates with OpenDocs for embedding in knowledge bases/documents.
Examples of Prompts
- Simple: “Create a PERT chart for organizing a large international conference: planning to execution.”
- Detailed: “Generate PERT for app development with phases and three-point estimates.”
- Narrative: “We are launching a marketing campaign with planning, content creation, approval, scheduling, and publication.”
The AI handles variations, pulling structure from context.
This AI tool represents a major advancement in project scheduling, making sophisticated PERT analysis fast, accurate, and collaborative.
Reference List
AI PERT Chart Generator in OpenDocs – Visual Paradigm: Announcement of the new AI-powered PERT chart support in OpenDocs, detailing generation from text, embedding, benefits, and usage steps.
Create PERT Charts in Seconds with AI – Visual Paradigm: In-depth article on generating PERT charts instantly via AI, covering features like critical path calculation, three-point estimates, desktop/chatbot access, and benefits for project planning.
PERT Chart: A Guide to AI-Powered Project Scheduling and Critical Path Analysis – Visual Paradigm AI Chatbot: Comprehensive guide explaining PERT basics, AI enhancements, time estimation formula, critical path details, prompt examples, and advantages for scheduling.
AI Chatbot – Visual Paradigm: Overview of Visual Paradigm’s AI Chatbot feature, including its support for generating PERT charts and other diagrams from text prompts, with conversational refinement
