


Business Process Model and Notation (BPMN) is the globally recognized standard for modeling business processes in a clear, graphical way. Maintained by the Object Management Group (OMG), the current version is BPMN 2.0 (released in 2011, with ongoing refinements in practice). BPMN bridges the gap between business stakeholders (who need simplicity) and technical teams (who need precision for implementation, simulation, or automation).
Why Use BPMN?
-
Provides a standardized visual language that reduces miscommunication.
-
Supports process documentation, analysis, improvement, compliance, and execution (e.g., in workflow engines like Camunda or Activiti).
-
Enables simulation, validation, and even code generation in advanced tools.
-
Works for simple manual processes to complex automated workflows.
Core Categories of BPMN Elements
BPMN uses four main groups of elements:
-
Flow Objects (the “what happens”)
-
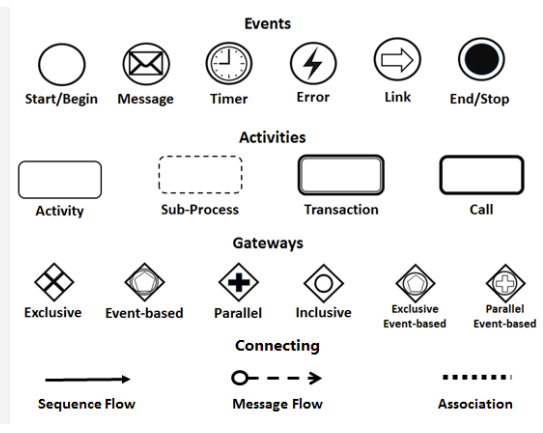
Events — Circles that represent something happening.
-
Start Event — Thin circle (triggers the process, e.g., “Order Placed”).
-
Intermediate Event — Double-lined circle (can be catching or throwing, e.g., Timer, Message).
-
End Event — Thick circle (process completion).
-
Subtypes: Message (envelope icon), Timer (clock), Error, Signal, etc.
-
-
Activities — Rounded rectangles for work performed.
-
Task — Atomic work (e.g., “Verify Customer Identity”).
-
Sub-Process — Collapsed (plus sign) or expanded for complex steps (e.g., “Arrange Delivery”).
-
Call Activity — Reusable global process.
-
-
Gateways — Diamonds for decision points or splitting/merging flows.
-
Exclusive Gateway (XOR) — One path only (decision, e.g., “Customer Exists?”).
-
Parallel Gateway (AND) — Split/merge simultaneous paths.
-
Inclusive Gateway (OR) — One or more paths.
-
Event-Based Gateway — Decisions based on events.
-
-
-
Connecting Objects (the “how it flows”)
-
Sequence Flow — Solid arrow showing order of execution.
-
Message Flow — Dashed arrow for communication between participants (e.g., order from Customer to Company).
-
Association — Dotted line for linking artifacts (e.g., to data objects).
-
-
Swimlanes (the “who does it”)
-
Pool — Represents a participant or external entity (e.g., Customer pool).
-
Lane — Sub-division inside a pool for roles/departments (e.g., Customer Service Assistant lane inside Company pool).
-
-
Artifacts (additional info, not affecting flow)
-
Data Object — Document or info (e.g., “Purchase Order [Create]”).
-
Data Store — Persistent storage.
-
Group — Visual grouping.
-
Text Annotation — Notes/explanations.
-
Best practices: Keep diagrams readable (avoid crossing lines), use descriptive names (verb + noun), model at consistent abstraction level, validate against BPMN rules.
Case Study: The True Aqua Distilled Water Company Order Fulfillment Process
This BPMN diagram models the end-to-end distilled water ordering and delivery at The True Aqua Distilled Water Company, a classic example often used in BPMN tutorials (including Visual Paradigm’s community resources).
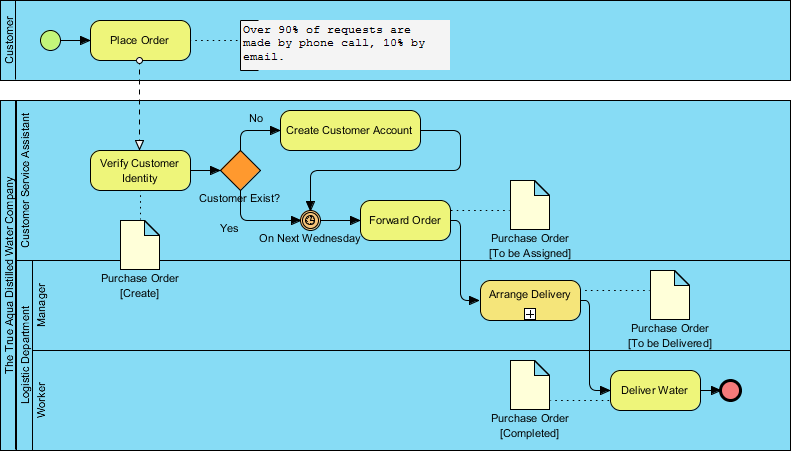
Key Participants (Pools and Lanes):
-
Customer pool (external initiator).
-
The True Aqua Distilled Water Company pool, divided into lanes:
-
Customer Service Assistant.
-
Manager (Logistics Department).
-
Worker (Logistics/ Delivery).
-
Process Flow Summary:
-
Start: Customer places order (90% phone, 10% email) → Message flow to Customer Service Assistant.
-
Verification: Assistant verifies identity.
-
Exclusive Gateway: “Customer Exists?”
-
No → Create Customer Account (activity) → Loop back.
-
Yes → Proceed.
-
-
-
Data Artifact: Purchase Order created/updated.
-
Timer Intermediate Event: “On Next Wednesday” — Orders batch-processed weekly (major characteristic: introduces delay for consolidation).
-
Forward Order: Message to Logistics → Status: [To Assigned].
-
Manager Lane: “Arrange Delivery” (Sub-Process, + sign → likely includes routing, driver assignment).
-
Worker Lane: “Deliver Water” (final task).
-
End: Delivery completed → Purchase Order [Completed], end event.
Insights from the Case Study:
-
Strengths: Clear role separation (swimlanes), batching reduces daily logistics chaos.
-
Bottlenecks: Weekly timer creates up to 6-day wait (e.g., Thursday order waits until next Wednesday forwarding). High phone reliance (90%) means manual effort and error risk.
-
Improvement Ideas:
-
Remove/reduce timer for urgent orders (add parallel path or priority lane).
-
Automate verification/account creation via self-service portal.
-
Digitize orders (reduce phone dependency).
-
Add parallel gateways for multi-order handling.
-
Integrate message flows for customer notifications (status updates).
-
This model demonstrates real-world use of pools/lanes, gateways, timers, data objects, and message flows.
Recommended Tool: Visual Paradigm for BPMN Modeling
Visual Paradigm stands out as a strong, professional BPMN tool in 2026, especially for creating, analyzing, and optimizing diagrams like the water delivery example.
Why Recommend Visual Paradigm?
-
Fully supports BPMN 2.0 (including all events, gateways, pools/lanes, artifacts, validation rules).
-
Intuitive drag-and-drop editor with shape libraries tailored for BPMN.
-
Advanced features: Process simulation, validation (checks 76+ BPMN rules), report generation, sub-process expansion.
-
AI-powered capabilities: Text-to-diagram generation (describe process in natural language → auto-create BPMN), textual analysis for turning docs into models.
-
Collaboration: Real-time team editing, version control.
-
Integration: Export to images/PDF/XML, import/export standards, links to other diagrams (UML, ERD, ArchiMate).
-
Community & Templates: Includes examples like the Aqua Distilled Water Company diagram.
-
Pricing: Flexible tiers (free/community edition for basics, paid for advanced/AI features starting low monthly).
Compared to lighter tools (e.g., Lucidchart, Draw.io), Visual Paradigm offers deeper enterprise features like simulation and generative AI, making it ideal for serious process improvement projects.
To get started:
-
Download at visual-paradigm.com (desktop or online version).
-
Use built-in BPMN templates or import existing diagrams.
-
Recreate/optimize the water company process to experiment with changes.
If you’d like, I can help refine optimizations for this specific process, suggest alternative notations (e.g., adding CMMN for case handling), or explain how to implement this in a tool!
BPMN Articles
- What is BPMN? – Visual Paradigm Guide: An introductory guide explaining the purpose, structure, and benefits of BPMN in business process design.
- BPMN Notation Overview – Visual Paradigm Guide: A comprehensive overview of BPMN notation elements, including events, activities, gateways, and artifacts used in process modeling.
- How to Draw a BPMN Diagram – Visual Paradigm Tutorial: A step-by-step tutorial on creating professional BPMN diagrams using an intuitive interface and industry best practices.
- Understanding Pools and Lanes in BPMN – Visual Paradigm User Guide: A detailed explanation of how to use pools and lanes to represent different departments, organizations, or roles within a process.
- As-Is to To-Be Business Process Modeling Tutorial: A guide on analyzing current business processes (As-Is) and designing improved future processes (To-Be) using BPMN tools.
- How to Create a BPMN Conversation Diagram in Visual Paradigm: A comprehensive guide for modeling interactions between business partners using specialized conversation diagrams.
- How to Generate a RACI Chart from BPMN Models: Instructions on how to automatically generate a RACI matrix from existing BPMN diagrams to clarify roles and responsibilities.
- How to Animate Business Processes with Visual Paradigm: A tutorial on creating dynamic, animated business process diagrams to enhance visualization and team communication.
- Unlocking Efficiency: Performing Gap Analysis with BPMN: An article explaining how BPMN can be leveraged to visualize and analyze shortfalls in business processes for optimization.
- AI Business Process Improvement Tool – Visual Paradigm Product Updates: An announcement regarding a tool that uses AI to transition from a problem statement directly to diagrams, KPIs, and analysis.
