In today’s fast-paced software development landscape, delivering value early and continuously is no longer optional—it’s essential. User Story Mapping (USM) has emerged as one of the most powerful agile techniques for aligning teams, visualizing user journeys, and managing backlogs with clarity and purpose.
This comprehensive guide dives deep into the principles of User Story Mapping, explains how to create and maintain a living product backlog, and showcases how Visual Paradigm transforms this technique into a dynamic, collaborative, and integrated agile workflow—perfect for Scrum, Kanban, or hybrid teams.
🔍 What Is User Story Mapping?
User Story Mapping, popularized by agile pioneer Jeff Patton, is a visual technique that organizes a product backlog into a two-dimensional structure representing the customer’s journey through your application.
Unlike traditional flat lists of user stories, USM provides:
-
A clear narrative flow of user activities.
-
Contextual prioritization based on value delivery.
-
A shared understanding across cross-functional teams.
📊 The Two Axes of User Story Mapping
| Axis | Purpose |
|---|---|
| Horizontal (Left to Right) | Chronological or priority-based sequence of user activities — the “backbone” of the map. |
| Vertical (Top to Bottom) | Increasing levels of detail and sophistication — from minimal viable functionality (top) to rich features (bottom). |
This structure ensures that teams don’t just deliver isolated features, but end-to-end value in each release.
✅ Why It Works: USM helps teams see the big picture, avoid scope creep, identify gaps, and plan releases that deliver real user value from day one.
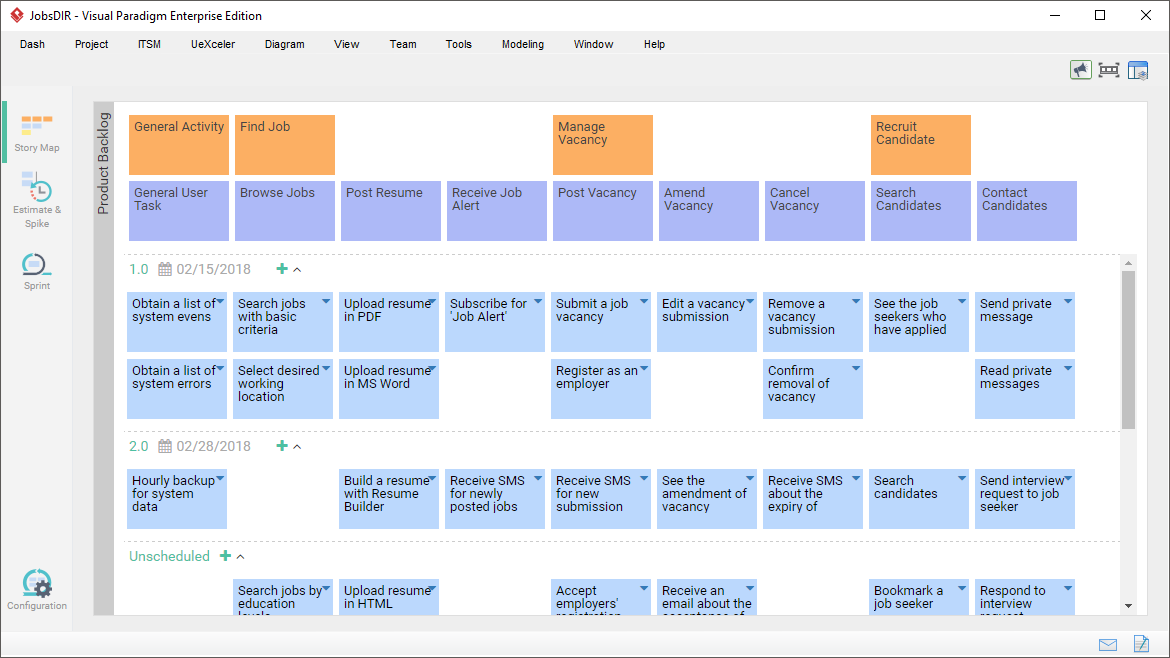
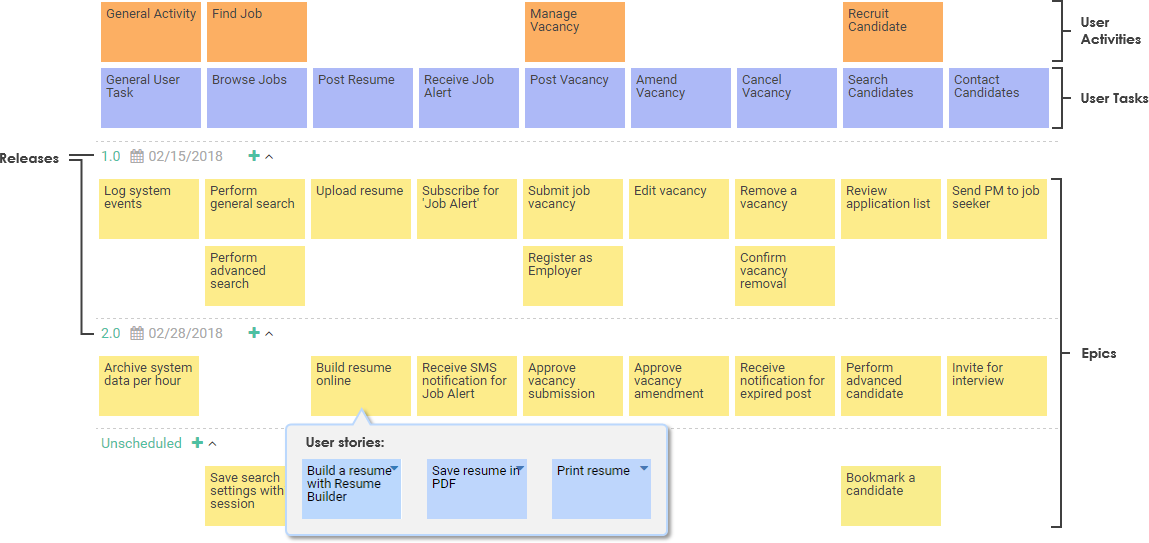
🧱 Key Components of a User Story Map
A well-structured user story map consists of several hierarchical layers:
1. Backbone: User Activities
The top row of high-level goals users want to achieve (e.g., Browse Products, Manage Account, Complete Purchase). These form the chronological spine of the user journey.
2. User Tasks (Walking Skeleton)
Sub-activities under each user activity — the steps needed to accomplish the goal. For example:
-
Under Complete Purchase: Add to Cart → Enter Shipping → Pay → Confirm Order
These tasks often form a minimal viable “walking skeleton” — a functional end-to-end flow that can be released early.
3. Epics (Optional, for Complex Projects)
Large bodies of work that group related stories. They sit between tasks and individual stories and are too big for a single sprint.
Example: “Implement Secure Checkout” could be an Epic containing multiple stories like “Add Payment Gateway,” “Validate Address,” etc.
4. User Stories
Small, testable units written in the format:
“As a [user], I want [feature] so that [benefit].”
These are the building blocks of sprints and deliverable increments.
5. Release Slices
Horizontal lines drawn across the map to define releasable increments:
-
MVP (Minimum Viable Product): Top row — core functionality.
-
Sprint 1, Sprint 2, etc.: Progressively richer features.
-
Future Releases: Lower rows for long-term vision.
💡 Pro Tip: Each slice should represent a coherent, usable product increment.
6. Themes (Optional)
Broader groupings of related epics or stories by functional area (e.g., Authentication, Reporting, Billing). Useful for organizing large-scale projects.
🛠️ How to Create and Use a User Story Map (Step-by-Step)
Follow this proven process to build and evolve your story map effectively:
✅ Step 1: Gather Requirements
Collect input from:
-
User interviews
-
Market research
-
Existing backlogs
-
Use case diagrams
-
BPMN process models
-
Mind maps or WBS
🔗 Visual Paradigm integrates seamlessly with these sources — see section on requirement transformation below.
✅ Step 2: Build the Backbone
Arrange user activities in chronological or priority order along the horizontal axis. Start with the most critical user goals.
📌 Tip: Use sticky notes (physical or digital) to brainstorm and rearrange until the flow feels natural.
✅ Step 3: Break Down Vertically
For each activity, decompose into sub-tasks (user tasks). Then break tasks into epics (if needed), and finally into individual user stories.
🔄 Iterate: Refine, reorder, and reorganize as new insights emerge.
✅ Step 4: Prioritize and Slice Releases
Drag items to reorder. Use horizontal release lines to define:
-
What goes into the MVP?
-
What’s next in Sprint 1?
-
What’s deferred to future releases?
This ensures progressive delivery of value.
✅ Step 5: Groom and Refine
Enhance stories with:
-
3Cs (Card, Conversation, Confirmation):
-
Card: Story text
-
Conversation: Notes, discussions
-
Confirmation: Acceptance criteria
-
-
Attach wireframes, storyboards, checklists, URLs, or diagrams.
-
Estimate effort using story points or hours.
-
Add spikes for research or uncertainty.
✅ Step 6: Collaborate and Iterate
Use the map in:
-
Sprint planning
-
Backlog refinement
-
Daily stand-ups
-
Retrospectives
Update it regularly to reflect changes, feedback, and evolving priorities.
🔄 Agile is iterative — so should be your story map!
🎯 Why Visual Paradigm Elevates User Story Mapping
While traditional USM tools are limited to whiteboards or basic diagrams, Visual Paradigm turns story mapping into a full-fledged agile lifecycle platform — combining visualization, collaboration, estimation, and integration.
Let’s explore how it enhances every stage of the process.
🌐 Advanced Mapping & Backlog Management
Visual Paradigm supports both 3-level and 4-level hierarchies:
-
3-Level: Activities → Tasks → Stories (ideal for small/medium projects)

-
4-Level: Activities → Tasks → Epics → Stories (for enterprise-scale complexity)
🔧 Key Features:
-
Intelligent Drag-and-Drop: Move any item (activity, task, epic, story), and the entire branch auto-updates with layout preservation.
-
Requirement Transformation: Directly import and convert elements from:
-
BPMN Process Diagrams
-
Use Case Diagrams
-
Mind Maps
-
WBS (Work Breakdown Structure)
-
🔄 All mapped items retain traceability — no data loss, no rework.
⚙️ Productivity & Estimation Tools
Stop guessing effort. Visual Paradigm brings precision to estimation.
📈 Affinity Table (Estimation Grid)
A powerful 2D grid that visualizes:
-
Effort (X-axis): Low to high
-
Risk/Complexity (Y-axis): Low to high
Place stories into quadrants to:
-
Identify high-effort/high-risk items
-
Auto-calculate sprint capacity
-
Spot outliers and plan spikes
🎯 Perfect for sprint planning and capacity forecasting.
🧩 Scrum Process Canvas (All-in-One Dashboard)
The Scrum Process Canvas integrates everything:
-
Story Map
-
Sprint Planning
-
Daily Stand-up
-
Burndown Charts
-
Scrum Board (Kanban-style)
-
Retrospective Templates
🔄 One-click sync between the story map and Scrum board — changes reflect instantly.
✍️ User Story 3Cs Editor
Rich editor for writing and enriching stories:
-
Card: Write the story in standard format
-
Conversation: Add notes, discussion threads, or team comments
-
Confirmation: Define acceptance criteria with checklists, scenarios, or test cases
🖼️ Attach wireframes, storyboards, diagrams, files, or URLs directly to stories.
🤝 Collaboration & Real-Time Synchronization
Remote or co-located — Visual Paradigm enables seamless teamwork.
🌐 Real-Time Online Editing
-
Collaborate in real time via browser (Cloud version)
-
Multiple users edit simultaneously
-
See cursor movements and live updates
👥 Ideal for distributed teams, workshops, or sprint planning sessions.
📣 Collaboration Tools
-
Followers & Notifications: Get alerts when someone comments or assigns you a task
-
Assignees & Statuses: Track ownership and progress
-
Tags & Filters: Organize stories by theme, priority, or team member
-
Change History: View who changed what and when
-
Shareable URLs: Invite stakeholders without requiring login
📎 No more version chaos — everyone works from the single source of truth.
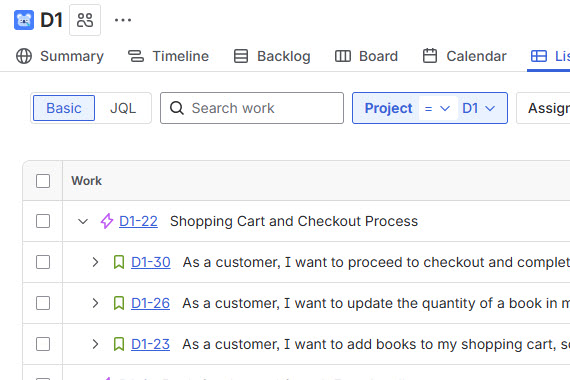
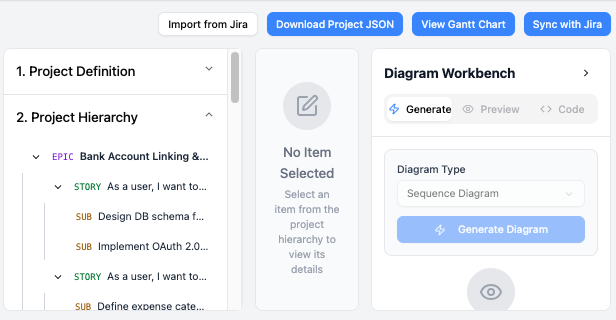
🔗 Integration with Jira & Other Tools
Break down silos between planning and execution.
🔄 Bi-Directional Jira Sync
-
From Visual Paradigm → Jira: Convert story map items into Jira issues (Epics, Stories, Tasks).
-
From Jira → Visual Paradigm: Pull back updated statuses, comments, and estimates.
-
Sync happens automatically — no manual entry.
🎯 Ideal for teams using Jira as their execution platform but wanting visual planning upfront.
🔄 Additional Integrations:
-
Tasifier: Sync tasks and track time
-
AI Assistant (Agilien): Generate or refine stories using natural language prompts
-
INVEST Criteria Validation: Automatically check if stories meet quality standards (Independent, Negotiable, Valuable, Estimable, Small, Testable)
🧠 Other Powerful Enhancements
-
AI-Powered Story Generation (Agilien): Type “Create a story map for an e-commerce checkout” — and Agilien generates a draft map with activities, tasks, and stories.
-
No Space Limits: Unlike physical whiteboards, you can scale infinitely — add 100+ activities or 1,000+ stories.
-
Export Options: Export maps as PDF, PNG, or HTML for sharing with stakeholders.
-
Theme Support: Group stories by business area, user role, or release phase.
🧩 Practical Example: E-Commerce User Story Map
Let’s visualize a real-world use case.
🛒 Backboned User Activities:
-
Browse Products
-
View Product Details
-
Add to Cart
-
Manage Cart
-
Complete Purchase
-
Track Order
-
Manage Account
📦 Example: “Complete Purchase” Activity
-
Task: Enter Shipping Address
-
Story: As a customer, I want to enter my shipping address so I can receive my order.
-
✅ Acceptance Criteria: Form validates email, phone, and address fields.
-
🖼️ Attached: Wireframe of checkout form
-
📌 Estimate: 5 story points
-
🧩 Epics: Secure Checkout, Payment Integration
-
-
🎯 Release Slicing:
-
Sprint 1 (MVP): Browse → Add to Cart → Complete Purchase (basic flow)
-
Sprint 2: Enter Shipping → Pay → Confirm Order
-
Sprint 3: Track Order, Manage Account
✅ Each slice delivers a working, testable product.
📚 Reference & Learning Resources
For deeper exploration, visit these official Visual Paradigm guides:
✅ Final Thoughts: From Vision to Value
User Story Mapping isn’t just a diagram — it’s a strategic tool for aligning product vision with execution. When combined with Visual Paradigm, it becomes more than a planning exercise. It evolves into:
-
A living product roadmap
-
A collaboration engine
-
A single source of truth
-
A driver of continuous value delivery
Whether you’re leading a startup, scaling a product team, or managing enterprise agility, Visual Paradigm turns user story mapping into a scalable, intelligent, and integrated agile powerhouse.
📌 Ready to Get Started?
👉 Download Visual Paradigm (Desktop or Online)
👉 Create your first story map in minutes
👉 Import from BPMN, Use Cases, or Mind Maps
👉 Sync with Jira and start sprint planning
🎯 Pro Tip: Start with a simple e-commerce or SaaS app map — you’ll see the power of USM in action within hours.
Empower your team. Visualize the journey. Deliver value — early and often.
With Visual Paradigm, user story mapping isn’t just visual — it’s transformative.
