


Designing complex systems requires more than just listing features. It demands a clear understanding of behavior over time. A UML State Machine Diagram offers that clarity. It visualizes how an object or system transitions between different conditions in response to events. This workshop guide walks you through the essential steps to create a robust state model without relying on specific tools or hype.
Whether you are modeling a login sequence, an order processing flow, or a traffic light controller, the principles remain consistent. This guide focuses on the logic, structure, and best practices for effective modeling. We will avoid jargon where possible and prioritize clear, actionable steps.
🧠 Understanding the Core Concepts
Before drawing lines and shapes, you must understand the vocabulary. A State Machine Diagram (SMD) is a behavioral diagram. It focuses on the dynamic aspects of a system rather than static structure. Here are the fundamental building blocks you will use throughout this workshop.
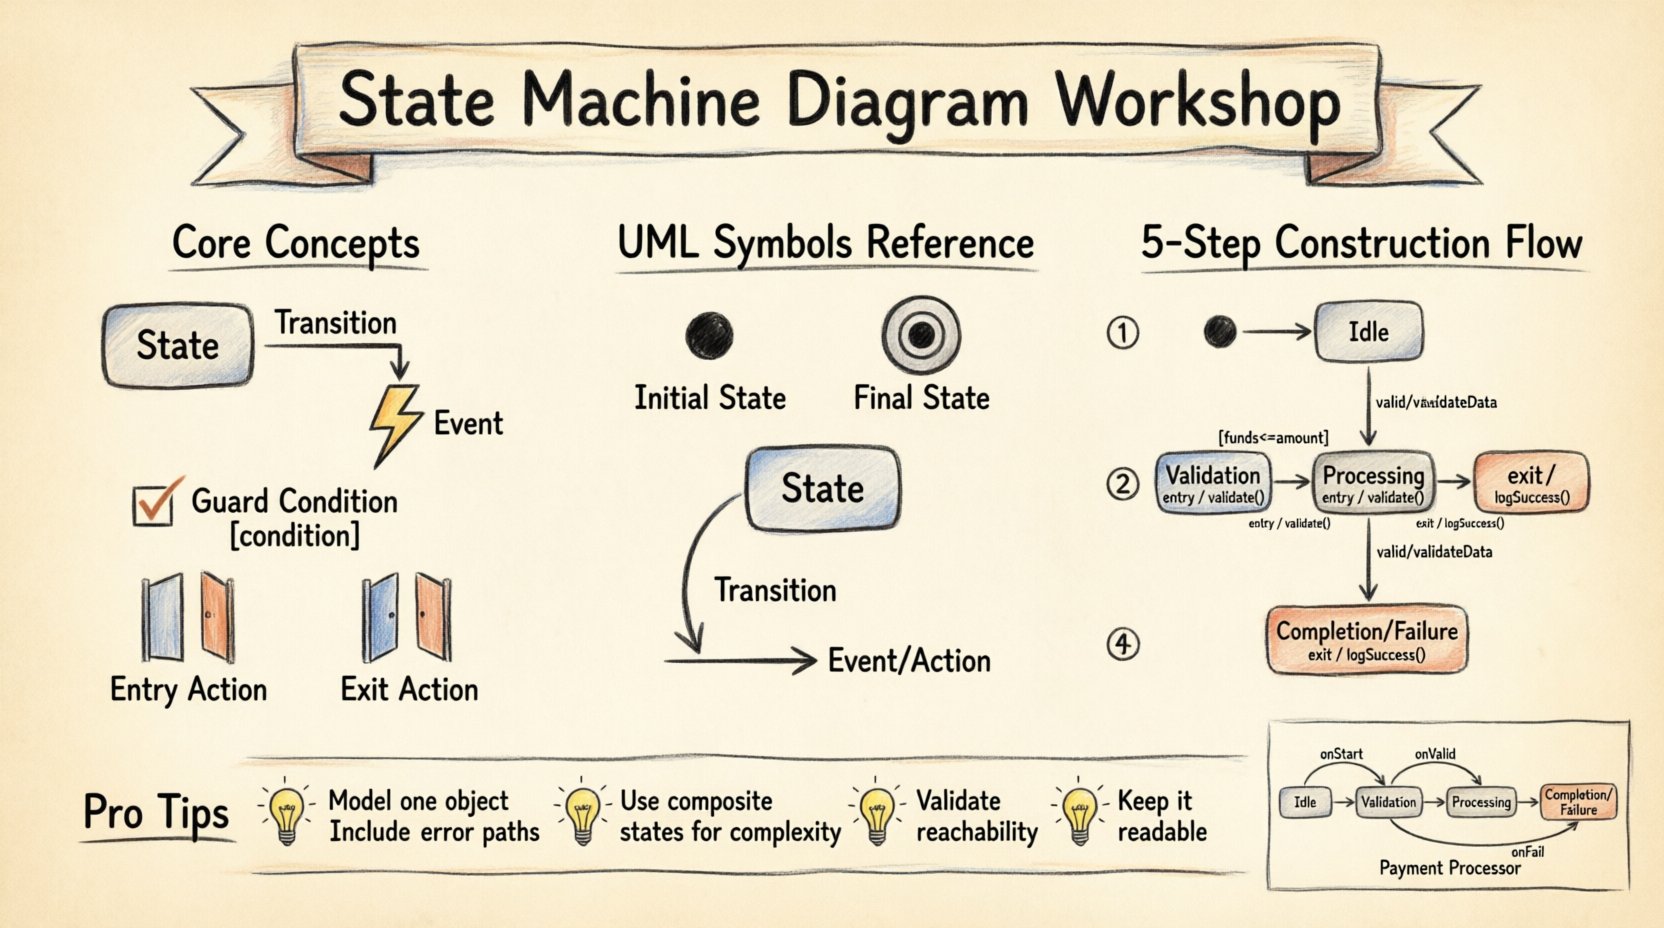
- State: A condition or situation during the life of an object during which it satisfies some condition, performs some activity, or waits for some event. Think of it as a snapshot of the system.
- Transition: The mechanism that causes the system to move from one state to another. This is triggered by an event.
- Event: A significant occurrence that triggers a transition. It could be a user action, a timer expiration, or a message from another system.
- Guard Condition: A boolean expression that must be true for a transition to occur. It adds logic to the flow.
- Entry/Exit Actions: Activities performed when entering or leaving a specific state.
Visualizing these elements helps prevent logical errors in code. If the diagram is clear, the implementation is often straightforward. Conversely, a messy diagram usually indicates confusion in the requirements.
📐 Notation and Symbols
UML uses standardized notation to ensure anyone reading the diagram understands the intent. Below is a reference table for the symbols you will encounter.
| Symbol | Meaning | Usage Context |
|---|---|---|
| 🔴 Solid Circle | Initial State | Where the process begins. |
| ⬛ Double Circle | Final State | Where the process ends. |
| 🟦 Rounded Rectangle | State | A distinct condition of the system. |
| ➡️ Arrow | Transition | Direction of movement between states. |
| 🏷️ Label on Arrow | Event / Action | What triggers the move and what happens during the move. |
🚀 Workshop Preparation
Building a diagram requires a defined scope. Trying to model an entire application at once leads to confusion. Follow these preparation steps before you start drawing.
- Select a Single Object: Focus on one class or entity. Do not try to map the entire system in one diagram. For this workshop, we will model a Payment Processor.
- Define the Lifecycle: Ask what the lifecycle looks like. Does it start with validation? Does it end with a receipt? Does it end with a failure?
- List Events: Write down every possible trigger. Submit Payment, Verify Funds, Timeout, Card Declined.
- Identify States: Based on the events, determine the distinct phases. Idle, Processing, Success, Error.
🖌️ Step-by-Step Construction
Now we move to the interactive part of the workshop. We will build the diagram logically, layer by layer. Assume you have a blank canvas ready.
Step 1: Define the Entry Point
Every state machine needs a start. Place the initial state symbol on your canvas. Connect it to the first logical state. For our Payment Processor, the system starts when it is ready to accept input. This state is often called Idle or Waiting.
- Place the solid black circle.
- Draw an arrow pointing to the first state box.
- Label the transition with the event that triggers the start (e.g., Start Transaction).
Step 2: Map the Primary States
Identify the main phases of the process. These are the major boxes on your canvas. For the Payment Processor, the core states are:
- Validation: Checking if data is complete.
- Processing: Communicating with the bank or gateway.
- Completion: The successful end of the transaction.
- Failure: The end state due to an error.
Draw a rounded rectangle for each. Arrange them in a flow that makes sense visually, typically from left to right or top to bottom.
Step 3: Connect the Transitions
This is where the logic lives. Connect the states using arrows. Ensure every state has a path to the next relevant state. Ask yourself: “What happens next?”
- From Validation, where can we go?
- If valid, move to Processing.
- If invalid, move to Failure.
Label the arrows clearly. Use the format Event / Action. For example, valid / validateData or invalid / logError.
Step 4: Add Guard Conditions
Sometimes, a transition depends on more than just an event. It depends on data values. These are guard conditions. They are written in square brackets.
- Example: From Processing, there might be a transition to Completion only if [funds >= amount].
- Example: A transition to Retry only if [attempt < 3].
Adding these conditions makes the diagram precise. It tells the developer exactly when a path is available.
Step 5: Define Entry and Exit Actions
Sometimes, specific logic must run every time a state is entered or left. This is common for logging, resetting variables, or updating UI indicators.
- Entry: Use the prefix entry/ inside the state box. Example: entry/startTimer().
- Exit: Use the prefix exit/ inside the state box. Example: exit/closeConnection().
Keep these actions simple. Complex logic should reside in the event handlers, not the state transitions themselves.
🧩 Handling Complexity
Real-world systems are rarely linear. They often have branches, loops, or parallel processes. Here is how to handle those scenarios.
Nested States (Hierarchical Diagrams)
If a state is complex, it can contain other states. This is called a composite state. For example, the Processing state might have internal states like Connecting and Authenticating.
- Draw a larger rectangle around the Processing state.
- Place the sub-states inside this boundary.
- Use the same transition rules for the internal states.
This keeps the high-level diagram clean while preserving detail where needed.
Parallel Regions (Orthogonal Regions)
Some systems perform multiple tasks simultaneously. For example, a Session might track both Authentication and Activity independently.
- Divide the state box into separate regions using a dashed line.
- Ensure each region has its own independent flow.
- Transitions in one region do not affect the other unless explicitly synchronized.
✅ Validation and Review
Once the diagram is drawn, you must validate it. A diagram that cannot be executed is useless. Use the following checklist to review your work.
- Reachability: Can every state be reached from the initial state?
- Completeness: Is there a final state for every path? Avoid dead ends.
- Determinism: Does a specific event in a specific state lead to only one next state? (Unless using guards to split paths).
- Clarity: Do the arrows cross too much? Can you trace the flow without confusion?
🛠️ From Diagram to Implementation
The end goal of a State Machine Diagram is often code. While you can generate code from diagrams manually, the diagram serves as the contract for the developer.
Identifying State Patterns
When you hand off the diagram, point out the patterns you used.
- State-Based Logic: The system behavior changes based on the current state.
- Event-Driven: The system waits for specific triggers.
- Guard Logic: Conditions that prevent transitions.
Avoiding Spaghetti Diagrams
A common mistake is creating a web of crossing lines. If your diagram looks like a plate of spaghetti, it is too complex. Refactor it.
- Split large states into composite states.
- Remove redundant transitions.
- Ensure the flow is linear where possible.
Clarity is more valuable than completeness of every edge case in the first draft. You can iterate.
📝 Common Pitfalls to Avoid
Even experienced modelers make mistakes. Here are the most frequent issues to watch out for during your workshop.
- Missing Error Paths: Designing only the happy path. Always model what happens when things go wrong.
- Too Many States: If a state has more than five transitions, consider splitting it.
- Ambiguous Events: Using generic names like Event instead of OrderSubmitted.
- Ignoring Timeouts: Systems often need to handle delays. Include a timeout event in critical states.
- Over-Modeling: Modeling states that do not affect behavior. If a state does not change logic, do not draw it.
📈 Integrating into Development
This diagram is not a static artifact. It should evolve with the project. Here is how to keep it relevant.
- Code Review: Compare the code logic against the diagram during reviews.
- Documentation: Use the diagram in technical documentation to explain system flow.
- Testing: Use the states as test cases. Ensure every state is reachable and every transition works.
🎓 Final Thoughts
Building a State Machine Diagram is a disciplined exercise in logic. It forces you to think about every possible condition of your system. By following these steps, you create a blueprint that reduces ambiguity and improves code quality.
Remember, the diagram is a communication tool. Its primary audience is your team. If they understand it, you have succeeded. Focus on clarity, use the notation correctly, and validate your logic before writing code. With practice, modeling system behavior becomes a natural part of your design process.
Start small. Pick a simple component. Draw the states. Draw the transitions. Review. Repeat. This iterative approach builds confidence and skill without overwhelming you.
Key Takeaways
- State Machine Diagrams model behavior over time.
- Define states, transitions, events, and guards clearly.
- Use composite states for complexity.
- Validate for reachability and completeness.
- Keep the diagram readable and aligned with code.
