


Designing embedded systems for the Internet of Things requires more than just wiring and code. It demands a clear understanding of logic flow and system behavior. A UML State Machine Diagram serves as the blueprint for this logic. In this guide, we explore the design process for a smart home temperature and humidity sensor. We focus on reliability, power efficiency, and clear state transitions without relying on specific commercial tools.
📡 Why State Machines Matter in IoT
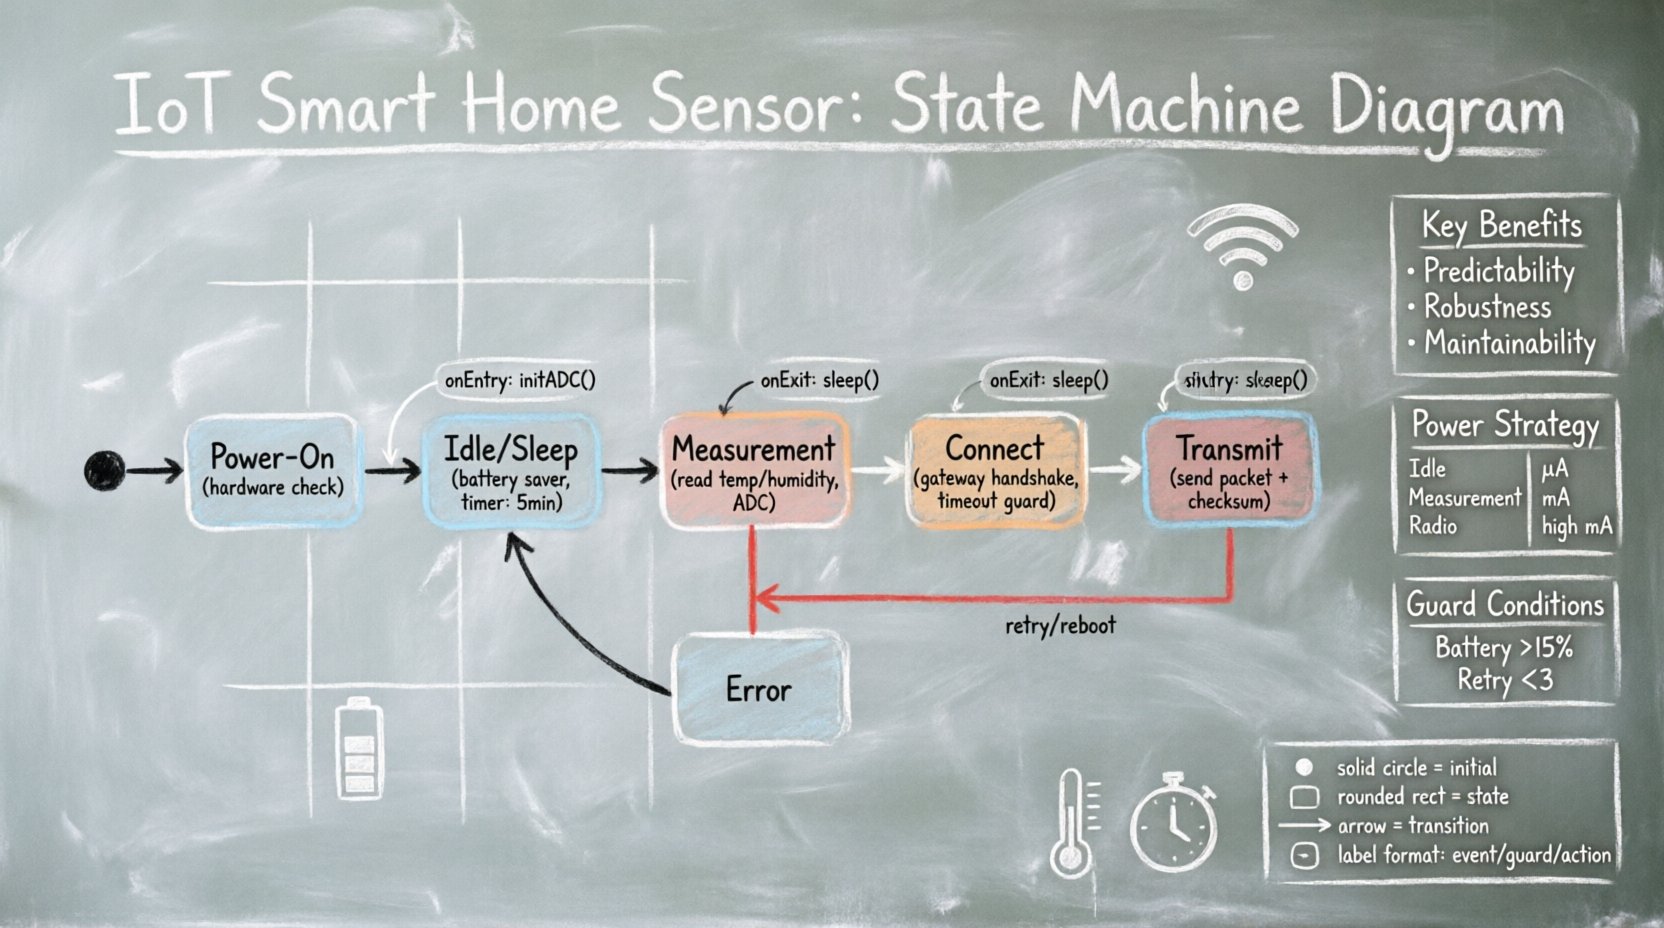
IoT devices operate in unpredictable environments. Network connectivity fluctuates, power sources vary, and external triggers are asynchronous. A linear script cannot handle these complexities effectively. A state machine provides a structured approach to managing system behavior.
- Predictability: Every action is tied to a specific state and an event.
- Robustness: Invalid inputs are handled explicitly through error states.
- Maintainability: Changes in logic are localized to specific transitions.
For a sensor device, battery life is often the primary constraint. The state machine dictates when the radio sleeps and when it wakes. This decision-making process must be precise.
🔍 Defining the System Scope
Before drawing the diagram, we define the functional requirements. This case study focuses on a standalone sensor node. It does not require complex user authentication or cloud database writes directly. Its primary job is data collection and transmission.
Core Functionalities:
- Read sensor data (Temperature, Humidity).
- Connect to a local gateway.
- Transmit data packets.
- Enter low-power modes to conserve battery.
- Handle communication errors gracefully.
⚙️ Identifying the States
The foundation of the diagram is the state list. A state represents a condition during which the system performs specific actions or waits for events. For this sensor, we identify the following distinct states.
1. Power-On State (Initial)
This is the entry point. The system performs a hardware check. It verifies the integrity of the microcontroller and the sensor module.
- Entry Action: Initialize GPIO pins.
- Exit Action: Load configuration from non-volatile memory.
2. Idle / Sleep State
When the device is not actively collecting or sending data, it must save energy. This is the most common state for battery-operated devices.
- Event Trigger: Timer expiration (e.g., every 5 minutes).
- Duration: Variable based on configuration.
3. Measurement State
The sensor wakes up to gather physical data. This state activates the ADC (Analog-to-Digital Converter).
- Entry Action: Power up sensor module.
- Processing: Read raw values, apply calibration offsets.
- Exit Action: Power down sensor module to save energy.
4. Connect State
Once data is ready, the device attempts to reach the gateway. This state handles the radio initialization and handshake protocol.
- Event Trigger: Data ready flag.
- Timeout: Critical. If the gateway is unreachable, the system must not hang.
5. Transmit State
The actual data payload is sent over the network interface.
- Entry Action: Format packet, add checksum.
- Exit Action: Clear transmit buffer.
6. Error State
If a critical failure occurs (e.g., sensor read failure, network timeout), the system enters this state. It logs the error and attempts a recovery sequence.
- Event Trigger: Exception handler.
- Recovery: Retry logic or reboot.
🔄 Defining Transitions and Events
Transitions define how the system moves from one state to another. They are triggered by events and guarded by conditions. In UML, these are represented as arrows connecting states.
Key Transition Paths:
- Idle → Measurement: Triggered by a periodic timer. Guard condition: Battery level > 10%.
- Measurement → Connect: Triggered by data acquisition complete.
- Connect → Transmit: Triggered by successful network handshake.
- Connect → Error: Triggered by network timeout.
- Transmit → Idle: Triggered by acknowledgement received or transmission complete.
- Any State → Power-On: Triggered by hardware reset.
Guards and Actions:
Guards ensure that a transition only occurs if specific conditions are met. For example, the device should not transmit if the battery is critically low.
| Source State | Event | Guard Condition | Target State |
|---|---|---|---|
| Idle | Timer Expire | Battery > 15% | Measurement |
| Connect | Timeout | Retry Count < 3 | Connect |
| Connect | Timeout | Retry Count = 3 | Error |
| Transmit | ACK Received | True | Idle |
| Measurement | Sensor Fail | True | Error |
📊 Visualizing the Diagram
Creating the visual representation requires adherence to UML standards. This ensures that other engineers can interpret the diagram without ambiguity.
Notation Rules
- States: Rounded rectangles with the state name centered.
- Initial State: A solid black circle.
- Final State: A solid black circle inside a larger circle.
- Transitions: Solid lines with open arrowheads.
- Labels: Event / Guard / Action (e.g.,
timer/ battery_ok / start_meas).
Hierarchy and Regions
Complex systems often use composite states. For example, the Connect state can be broken down into sub-states:
- Scan: Searching for the gateway.
- Auth: Verifying credentials.
- Ready: Connection established.
This hierarchy reduces clutter on the main diagram while maintaining detailed logic where needed. It also allows for shared entry and exit actions across the sub-states.
🧠 Implementation Considerations
Translating the diagram into code requires a disciplined approach. The state machine logic should be decoupled from the business logic.
1. State Variable Management
The current state must be stored in a variable that persists across function calls. If the device resets unexpectedly, the state should ideally recover to a safe default, such as Idle.
2. Event Queueing
Events often occur asynchronously. For example, a network packet might arrive while the device is in the Measurement state. An event queue buffers these signals so they can be processed when the system is ready.
- Priority: Critical errors (like battery critical) should have higher priority than routine data collection.
- Debounce: Physical buttons or sensor noise can trigger false events. Debouncing logic prevents state jumping.
3. Timeouts and Watchdogs
A state machine can get stuck in a loop if a transition condition is never met. A watchdog timer resets the system if it remains in a state longer than the maximum expected duration.
Example Scenario:
- System enters Connect state.
- Timer starts (e.g., 10 seconds).
- Network handshake fails.
- Timer expires.
- System transitions to Error state or reboots.
🛠️ Common Pitfalls and Solutions
Designing state machines is prone to specific errors. Being aware of these helps in creating a more robust system.
Pitfall 1: The Diamond Problem
Avoid situations where multiple transitions lead to the same state without a clear distinction. This makes debugging difficult.
- Solution: Ensure every transition has a unique event or guard condition.
Pitfall 2: Missing Exit Actions
If a state is exited without cleaning up resources (like closing a file handle or releasing a lock), memory leaks or hardware hangs can occur.
- Solution: Explicitly define exit actions for every state in the diagram.
Pitfall 3: Infinite Loops
Transitions that return to the same state without consuming an event or advancing a counter can cause infinite loops.
- Solution: Implement retry counters that increment on failure.
Pitfall 4: Over-Complexity
Trying to model every edge case in the main diagram makes it unreadable.
- Solution: Use nested states for complex sub-logic. Keep the top-level diagram focused on the main flow.
🔋 Power Consumption Strategy
For an IoT sensor, the state machine is the primary tool for power management. Each state has an associated power cost.
| State | Power Mode | Estimated Current | Duration |
|---|---|---|---|
| Idle | Deep Sleep | Low (µA range) | Minutes |
| Measurement | Active | Medium (mA range) | Seconds |
| Connect/Transmit | Radio Active | High (mA range) | Seconds |
| Error | Active | Medium | Until Fixed |
Optimizing the time spent in the Connect and Transmit states is crucial. If the network is unstable, the device should minimize retries to preserve battery.
📝 Data Consistency and Logging
When the sensor moves from Measurement to Transmit, data integrity is key. The state machine should ensure that data is not overwritten before it is sent.
- Double Buffering: Use two memory buffers. One is being read, the other is being written.
- Checksums: Verify data integrity upon receipt at the gateway. If a packet is corrupted, the gateway sends a NACK (Negative Acknowledgement).
- Retry Logic: The state machine must handle the NACK by re-entering the Transmit state with the same data.
Logging errors into non-volatile memory (like EEPROM or Flash) allows for post-deployment analysis. The Error state should write a timestamp and error code before transitioning to a safe state.
🚀 Final Considerations
Building a state machine diagram is an exercise in clarity. It forces the designer to consider every possible condition the system might face. For an IoT smart home sensor, this rigor translates directly to reliability.
Key Takeaways:
- Start with a clear list of states based on user requirements.
- Define transitions explicitly with events and guards.
- Use hierarchy to manage complexity.
- Always account for power consumption in state timing.
- Plan for error recovery in every critical path.
A well-designed diagram acts as a contract between the hardware and software teams. It reduces ambiguity and ensures that the final product behaves as expected, even when the network fails or the battery runs low. By following these structured steps, developers can create systems that are robust, efficient, and maintainable.
Remember, the goal is not to predict the future, but to handle the present reliably. With a solid state machine foundation, the sensor can adapt to the dynamic nature of the smart home environment.
