A burndown chart is a graphical representation of remaining work versus time. It is commonly used in Agile software development methodologies such as Scrum. However, a burndown chart can be applied to any project that involves measurable progress over time.
Typically, in a burndown chart, the amount of work is shown on the vertical axis, and time along the horizontal axis. It can be used to predict when all work will be completed. In Daily Scrum, the development team updates the Sprint Burn Down and plots the remaining work for the day. Because of the following reasons, the burndown chart is almost a “must-have” tool for any Scrum team:
- Monitoring project scope creep
- Keeping the team on track
- Comparing planned work against team progress
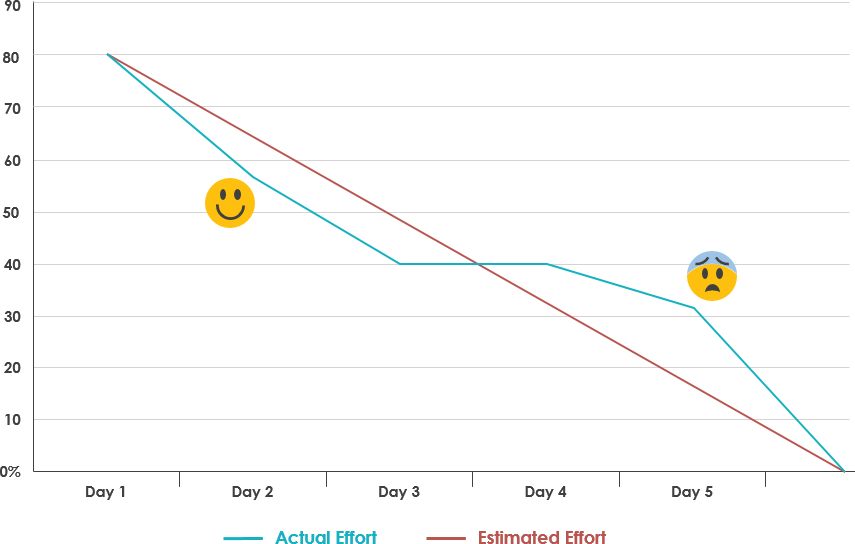
Burndown Chart and Emotion
How to Create a Burndown Chart
To create this chart, determine the total amount of work to be done and estimate the Sprint Backlog tasks each day of the Sprint. The remaining work in the Sprint is the sum of the remaining effort in the entire Sprint Backlog. Track these totals daily and use them to create a chart showing the remaining work over time.
Burndown Chart Example
- Duration: 5 days
- Sprint Backlog: 8 tasks
- Velocity: 80 hours
Step 1 – Create Estimated Effort
Assume you use the ideal baseline of available hours in the sprint. The simplest approach is to divide the total available hours by the number of days. In this example, 80 hours over 5 days equals 16 hours per day. To create the burndown chart, capture the data as a daily running total, starting at 80 hours, and subtract 16 hours at the end of each day (e.g., 80 – 16 = 64 hours remaining after Day 1, 48 hours after Day 2, etc.).

Burndown – Estimated Effort
Step 2 – Track Daily Progress
Then capture daily progress in a table for each task. It’s important to remember that the value captured each day is the estimated effort completed, not the actual effort.
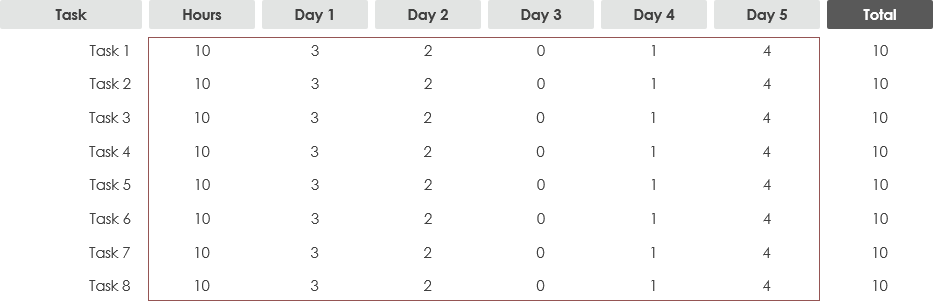
Burndown – Daily Progress
Step 3 – Calculate Actual Effort
At the end of each day, capture the total remaining effort. This is the sum (total) of all estimated effort still remaining at the end of the day.
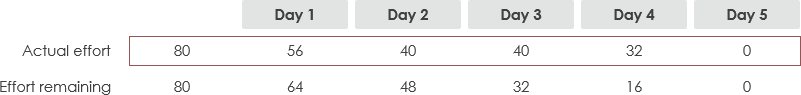
Burndown – Actual Effort
Step 4 – Obtain the Final Dataset
Once the data is available, you can create the burndown chart. Using the line chart option in Excel is relatively straightforward.
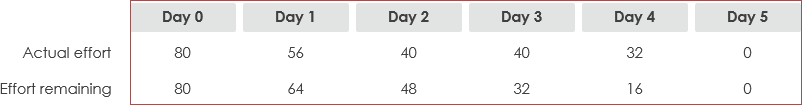
Burndown – Final Dataset
Highlight the summary table showing the daily totals of baseline effort and estimated effort. You should also capture the time period labels (Day 0, Day 1, etc.).
Step 5 – Plot the Burndown Using the Dataset
As long as you know the data to track, you can easily create a burndown chart like the one below.
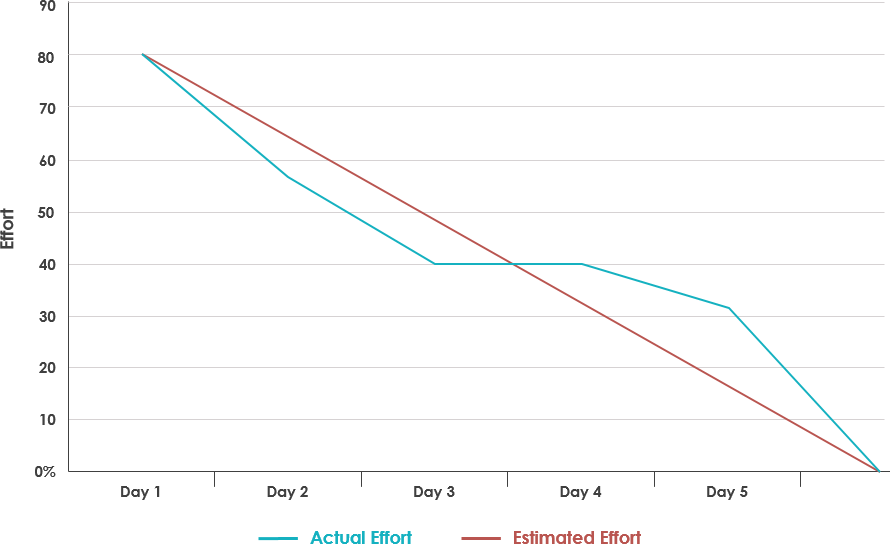
Burndown Chart Example
