


Sharing Real User Experiences with Practical Feature Lists
“Component diagrams helped me finally visualize how my microservices actually talk to each other. As someone who struggled with abstract architecture docs, seeing components with clear interfaces changed everything.” — Alex Johnson, Senior Product Manager
🔍 What Exactly IS a Component Diagram?
A UML Component Diagram is your system’s “physical blueprint.” While class diagrams show what your code does, component diagrams show how your compiled pieces fit together in the real world.
💡 Think of it this way: If your software were a car, class diagrams show the engine design. Component diagrams show how the engine, transmission, wheels, and electronics plug together.
Key Purpose: Visualize, specify, and document component-based systems for both forward engineering (design → code) and reverse engineering (code → design).
🎯 Why Should You Care?
| Scenario | How Component Diagrams Help |
|---|---|
| Onboarding new team members | Shows system structure without diving into code |
| Microservices architecture | Clarifies service boundaries and dependencies |
| Legacy system documentation | Reverse-engineers complex codebases visually |
| Stakeholder presentations | Communicates architecture to non-technical audiences |
| Release planning | Identifies which components need testing/deployment |
🗣️ User Experience: “During our cloud migration, component diagrams saved us weeks. We could spot circular dependencies before they broke production.” — Senior DevOps Engineer
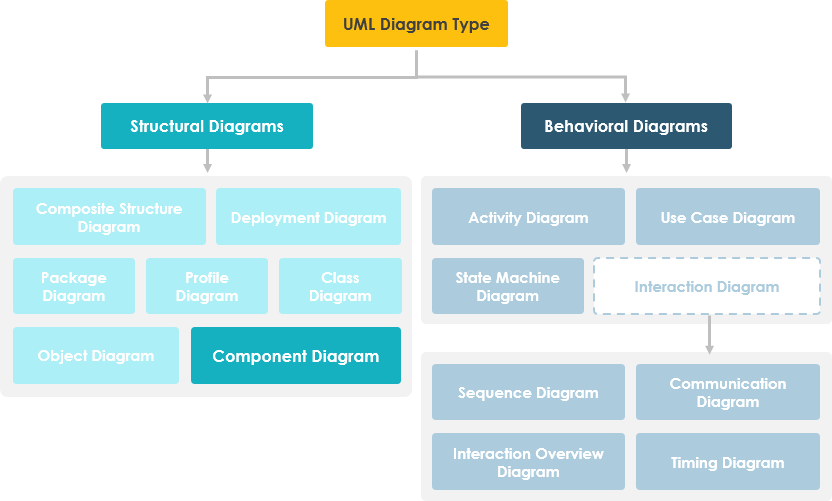
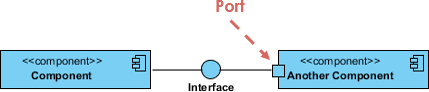
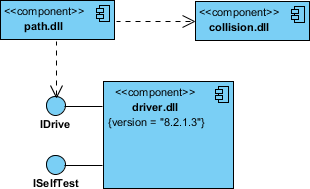
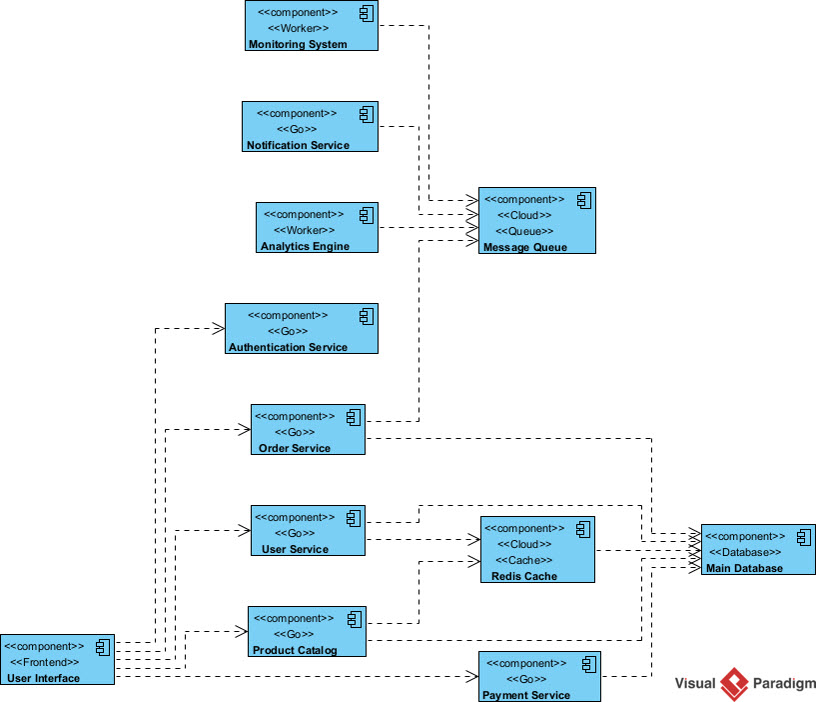
🖼️ Your First Component Diagram: Visual Breakdown

What you’re seeing:
-
🔷 Large box: Represents a subsystem or entire system
-
🔌 Right-side interfaces (required): Services this component needs to function
-
🔌 Left-side interfaces (provided): Services this component offers to others
-
➡️ Data flow: Information moves through internal components via connections
Beginner Tip: Start by drawing just 3-5 components. You can always expand later!
🧱 Core Building Blocks: Components
A component = a replaceable, modular piece of your system. In UML 2, you can represent it three ways:

-
Simple rectangle with component name (cleanest for beginners)
-
Rectangle with component icon (visual cue for tools)
-
Rectangle with
<<component>>stereotype (most explicit for documentation)
✅ Best Practice: Use the simple rectangle when learning. Add stereotypes later for formal documentation.
🔌 Interfaces: The Handshake Protocol
Interfaces define how components communicate. Two critical types:
| Interface Type | Symbol | Meaning | Real-World Analogy |
|---|---|---|---|
| Provided | 🍭 Lollipop (full circle) | “I offer this service” | A restaurant menu |
| Required | 🔌 Socket (half-circle) | “I need this service” | A power plug needing an outlet |
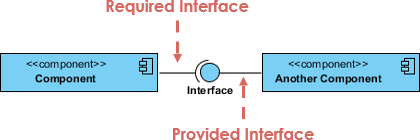
Practical Example: Order System
What’s happening:
-
OrderProcessorrequiresPaymentServiceandInventoryService -
OrderProcessorprovidesOrderConfirmationtoNotificationSystem -
Clear contracts = fewer integration bugs
💡 Pro Tip: Name interfaces with verbs:
IPaymentProcessing,IUserAuthentication. Makes dependencies self-documenting.
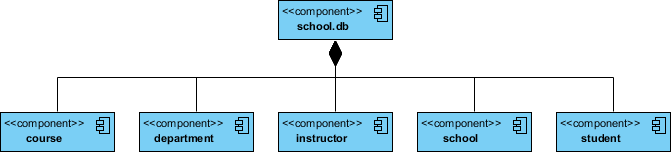
📦 Subsystems & Ports: Organizing Complexity
Subsystems
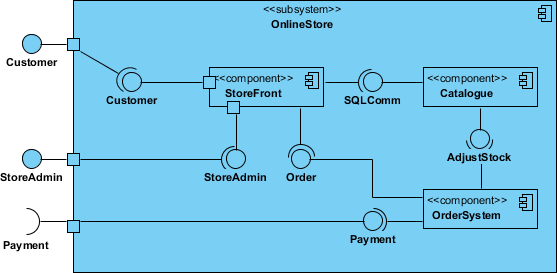
A subsystem is just a special component labeled <<subsystem>>. Use when:
-
Grouping related components (e.g.,
<<subsystem>> BillingModule) -
Showing architectural layers (Presentation, Business, Data)
Ports
Ports = controlled entry/exit points on a component’s edge. Think of them as:
-
🔐 Security checkpoints
-
🚦 Traffic controllers for data flow
-
🧩 Standardized connection points
When to use ports: When you need to enforce strict interface contracts or model hardware/software boundaries.
🔗 Relationships Cheat Sheet
Component diagrams use standard UML relationships. Here’s your quick reference:
| Relationship | Notation | When to Use | Beginner Warning |
|---|---|---|---|
| Association |  |
Components that “know about” each other | Don’t overuse—prefer interfaces |
| Composition |  |
Strong ownership (if parent dies, parts die) | Rare in distributed systems |
| Aggregation |  |
Weak “has-a” relationship | Often confused with composition |
| Dependency |  |
“Uses” relationship (most common!) | ✅ Start here as a beginner |
| Generalization |  |
Inheritance between components | Use sparingly in component design |
| Constraint |  |
Business rules or technical limits | Add as notes, not core structure |
🎯 Beginner Strategy: Master Dependency relationships first. They cover 80% of real-world scenarios.
🌍 Real-World Use Cases
1️⃣ Modeling Source Code
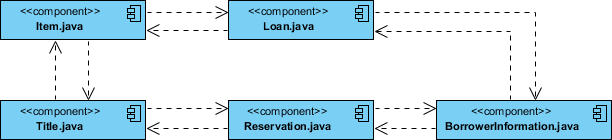
How to:
-
Stereotype files as
<<file>>components -
Use packages for folders/modules
-
Add tagged values:
{version="2.1", author="Alex"} -
Draw dependencies for compilation order
2️⃣ Modeling Executable Releases
Focus on:
-
Executables (
<<executable>>) -
Libraries (
<<library>>) -
Configuration files (
<<config>>) -
Deployment nodes (servers, containers)
3️⃣ Modeling Physical Databases
Map logical classes to:
-
Tables (
<<table>>components) -
Indexes, views, stored procedures
-
Physical distribution (shards, replicas)
💡 User Insight: “We used component diagrams to plan our database sharding strategy. Visualizing table relationships prevented costly redesigns.” — Database Architect
🛠️ Getting Started: Free Tools That Actually Work
🥇 Visual Paradigm Community Edition (Recommended for Beginners)
✅ Why beginners love it:
-
100% free for learning/personal use
-
Supports ALL UML diagram types
-
Intuitive drag-and-drop interface
-
Export to PNG, PDF, SVG
-
Active community forums
Other Options:
| Tool | Best For | Limitations |
|---|---|---|
| PlantUML | Code-first developers | Text-based learning curve |
| draw.io | Quick sketches | Limited UML semantics |
| StarUML | Professional features | Free version has watermark |
🗣️ My Experience: “I tried 4 free tools before settling on Visual Paradigm CE. The learning curve was gentle, and I had my first diagram in 20 minutes.” — Alex Johnson
✨ NEW: AI-Powered Component Diagram Generation
(March 2026)
🚀 Game Changer Alert: Visual Paradigm now generates component diagrams from plain English!
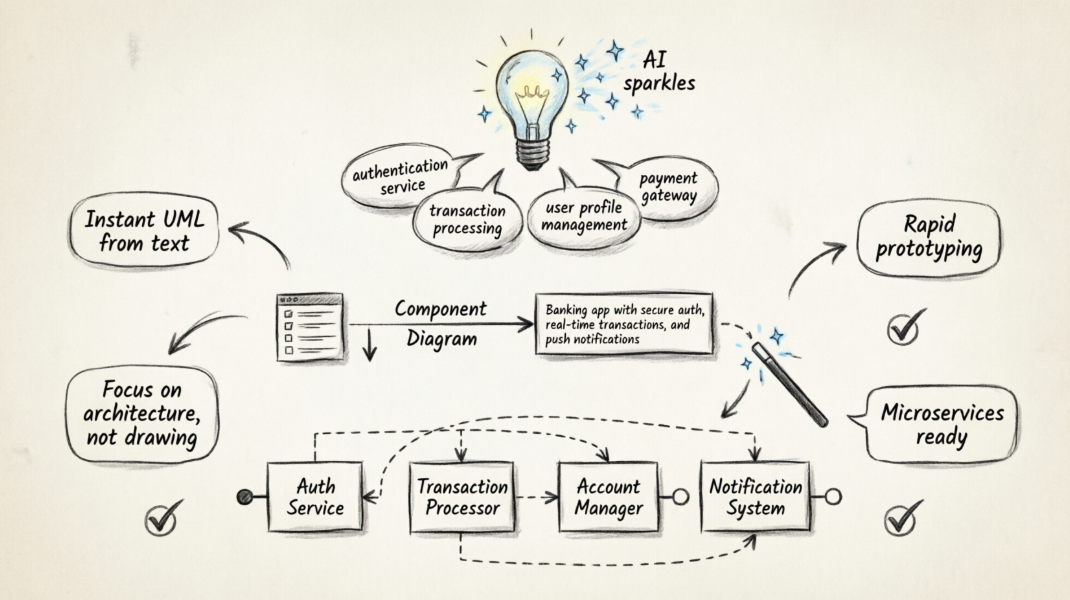
🔑 Key AI Features (Tested by Real Users)
| Feature | What It Does | Beginner Benefit |
|---|---|---|
| Text-to-Diagram | Type “Banking app with auth, transactions, notifications” → get full diagram | Skip manual drawing; focus on design |
| Auto UML Notation | AI applies correct lollipops, sockets, ports | No memorizing symbols |
| Conversational Refinement | Chat: “Add a logging component” → diagram updates | Iterate like brainstorming |
| Architecture Analysis | AI flags tight coupling or circular deps | Learn best practices in real-time |
| C4 Model Support | Generate C4-style component views | Bridge UML and modern architecture docs |
How to Use (3 Simple Steps)
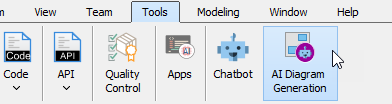
-
Tools → AI Diagram Generation
-
Select Component Diagram + type your prompt:
"Generate a Component Diagram for an e-commerce platform with: - User Management Service - Product Catalog Service - Order Processing Service - Payment Gateway Interface - Inventory Database" -
Click OK → Get instant diagram!
💡 Prompt Crafting Tip: Be specific about interfaces!
❌ “Make a social media app diagram”
✅ “Component diagram for social app: UserService provides IUserProfile, requires IPostStorage; PostService provides IContentFeed…”
Access Methods
| Platform | How to Access |
|---|---|
| Desktop App | Tools → AI Diagram Generation |
| Online Editor | Insert → Diagrams → Component Diagram → “Create with AI” |
| AI Chatbot | Chat directly at chat.visual-paradigm.com |
🔗 Chat with AI Now
🔗 AI Component Guide
📝 Step-by-Step: Create Your First Component Diagram (No AI)
For those who want to learn the fundamentals first
Phase 1: Plan (5 minutes)
-
List your system’s major pieces (e.g., “User Auth”, “Payment Processor”)
-
For each, ask: “What does this NEED? What does this OFFER?”
-
Sketch on paper: boxes + arrows
Phase 2: Build in Visual Paradigm (10 minutes)
-
File → New Diagram → Component Diagram
-
Drag Component from palette onto canvas
-
Double-click to name it (e.g.,
OrderService) -
Add interfaces:
-
Right-click component → Add → Provided Interface
-
Right-click → Add → Required Interface
-
-
Connect components with Dependency arrows
Phase 3: Refine (5 minutes)
-
Group related components in a subsystem box
-
Add ports if interfaces get complex
-
Insert notes for business rules
Phase 4: Export & Share
-
File → Export → PNG/PDF
-
Share with team for feedback
🎯 Beginner Win: “My first diagram had 4 components and 2 interfaces. It was messy, but my team understood our auth flow for the first time. Progress!” — Junior Developer
💡 Pro Tips from the Trenches
✅ Do This
-
Start small: 3-5 components max for your first diagram
-
Name interfaces clearly:
IEmailService>Interface1 -
Use color consistently: Blue for services, green for databases
-
Add version tags:
{v2.3}on components helps traceability -
Review with devs: Ensure diagram matches actual code
❌ Avoid This
-
Over-engineering: Don’t model every class as a component
-
Ignoring direction: Dependencies should point to what’s used
-
Skipping interfaces: Direct component-to-component links create tight coupling
-
Forgetting deployment: Show where components run (server, container, edge)
🔄 Maintenance Strategy
-
Reverse engineer monthly: Update diagrams from code
-
Link to tickets: Add Jira/issue IDs as component notes
-
Version control: Store
.vppfiles in Git alongside code -
Automate: Use CI/CD to generate diagrams from code comments
🗣️ Hard-Won Lesson: “We stopped updating diagrams after launch. Six months later, they were useless. Now we treat them like code: review, version, maintain.” — Engineering Manager
📋 Feature Checklist: What to Look For in a Component Diagram Tool
Essential for Beginners
-
Drag-and-drop component creation
-
Auto-align and distribute tools
-
Interface symbols (lollipop/socket) with one click
-
Dependency arrow with customizable labels
-
Export to common formats (PNG, PDF)
-
Undo/redo with history
Nice-to-Have
-
Code generation (forward engineering)
-
Code import (reverse engineering)
-
Team collaboration features
-
Cloud sync across devices
-
Template library for common patterns
Advanced (Future-Proofing)
-
AI-assisted diagram generation
-
C4 model support
-
Integration with Jira/Confluence
-
Real-time co-editing
-
Automated architecture validation
Visual Paradigm Community Edition Scorecard
| Feature | Available? | Notes |
|---|---|---|
| Drag-and-drop | ✅ | Very intuitive |
| Interface symbols | ✅ | One-click add |
| Export formats | ✅ | PNG, PDF, SVG, HTML |
| AI Generation | ✅ | New in 2026 update |
| Reverse Engineering | ✅ | Java, C++, C# support |
| Team Collaboration | ⚠️ | Limited in free version |
| Cloud Sync | ❌ | Desktop-only in CE |
💡 My Verdict: “For learning and personal projects, Visual Paradigm CE hits the sweet spot. Upgrade to Professional only if you need team features or advanced AI.” — Alex Johnson
- 📚 References & Further Learning
- AI Component Diagram Generator Update (OpenDocs): Announcement of AI-powered component diagram generation in Visual Paradigm OpenDocs, featuring text-to-diagram capabilities and conversational refinement.
- AI Component Diagram Generator Update (Desktop): Detailed release notes for AI diagram generation in Visual Paradigm Desktop, including step-by-step usage guide and architectural analysis features.
- Visual Paradigm Desktop Pricing & AI Features: Overview of Visual Paradigm editions, highlighting AI-powered apps, chatbot integration, and web diagram editors available across subscription tiers.
- VP Online Diagram Compatibility Guide: Documentation on VP Online (formerly VPository) capabilities, including team collaboration features and project repository management for distributed teams.
- Visual Paradigm AI Chatbot Features: Comprehensive guide to the AI Chatbot’s diagramming and modeling capabilities, including natural language processing for UML generation and architectural refinement.
- UML Component Diagram AI Chatbot Demo: Interactive demo page for generating component diagrams via conversational AI, with sample prompts and real-time editing.
- AI Component Diagram Tutorial (YouTube): Video walkthrough demonstrating text-to-diagram generation, interface modeling, and AI-assisted refinement in Visual Paradigm.
- Advanced AI Modeling Techniques (YouTube): Deep-dive tutorial on leveraging AI for complex architecture scenarios, including microservices decomposition and dependency analysis.
-
🌟 Final Thought: Component diagrams aren’t about perfect UML syntax—they’re about shared understanding. Start messy. Iterate. Let your diagram evolve with your system. And remember: the best diagram is the one your team actually uses.
- Happy modeling! 🎨✨
— Shared with ❤️ by Alex Johnson, Product Manager & UML Enthusiast
