


Introduction: What Is Value Stream Mapping (VSM)?
Value Stream Mapping (VSM) is a cornerstone of Lean management, offering a visual, systematic approach to analyzing and improving the flow of materials and information required to deliver a product or service to the customer. At its core, VSM helps organizations distinguish between value-added activities—those the customer is willing to pay for—and non-value-added activities, commonly known as waste.
By mapping the entire journey from customer demand to final delivery, VSM reveals inefficiencies such as overproduction, waiting times, excess inventory, unnecessary transport, and defects. The result? Shorter lead times, reduced costs, improved quality, and higher customer satisfaction.
VSM is widely adopted across industries including:
-
Manufacturing (e.g., automotive, food & beverage)
-
Healthcare (patient flow, appointment scheduling)
-
Software Development (SDLC, release cycles)
-
Logistics & Supply Chain
-
Retail & Services
It’s a key tool in Lean, Six Sigma, and Agile methodologies, enabling data-driven decision-making and sustainable operational excellence.
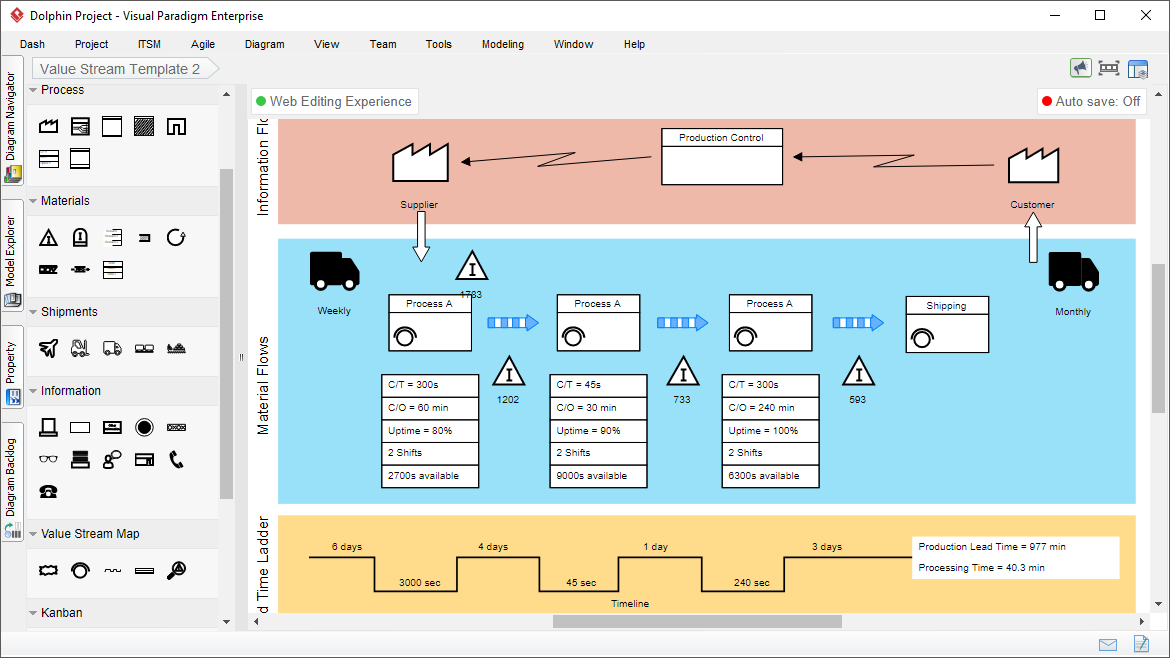
Core Components of a Value Stream Map
A well-constructed VSM provides a holistic view of the current state and serves as a blueprint for future improvements. Here are the essential elements:
| Component | Description |
|---|---|
| Information Flow (Top) | Shows how customer orders, production schedules, and communication travel between departments, suppliers, and customers. Typically represented with arrows and labeled with data types (e.g., POs, MRP signals). |
| Material Flow (Middle) | Illustrates the physical movement of products, components, or services through each stage of production or delivery. Includes transport, storage, and processing steps. |
| Process Boxes | Rectangular shapes representing individual operations or process steps (e.g., machining, assembly, testing). Each box contains a process name and identifier. |
| Data Boxes | Attached to process boxes, these display critical performance metrics: • Cycle Time (C/T) • Setup/Changeover Time • Uptime / Availability • Inventory Levels (WIP, Finished Goods) • Staffing Requirements • Takt Time (customer demand rate) |
| Lead Time Ladder (Timeline) | A zigzag or ladder-like structure at the bottom that breaks down total lead time into: • Value-Added Time (actual processing) • Non-Value-Added Time (waiting, queues, transport) Visually highlights where waste accumulates. |
| Lean Symbols | Standardized icons from the “Language of Lean”: • Inventory triangles • Push vs. Pull arrows • Transport icons • FIFO lanes • Kanban signals • Supplier/Customer icons |
Together, these components form a current state map—a baseline of reality—and enable the creation of a future state map with targeted improvements.
Why Use Visual Paradigm for Value Stream Mapping?
Visual Paradigm is a leading diagramming and modeling platform that brings AI-powered intelligence to traditional VSM practices. Whether you’re a Lean practitioner, operations manager, or process improvement specialist, Visual Paradigm simplifies and accelerates the VSM journey.
✅ Key Advantages:
-
AI-Driven Automation – Generate complete VSM diagrams from plain English.
-
Industry-Specific Templates – Jumpstart projects in manufacturing, healthcare, software, logistics, and more.
-
Real-Time Collaboration – Work with cross-functional teams in real time.
-
Smart Analytics & Calculations – Auto-compute lead time, PCE (Process Cycle Efficiency), and other KPIs.
-
Professional Output & Export Options – Share high-fidelity visuals in PDF, PNG, SVG, Markdown, and more.
💡 Visual Paradigm doesn’t just draw maps—it analyzes them, optimizes them, and guides you toward better outcomes.
Visual Paradigm’s VSM Tool: Features & Capabilities
🔧 Primary Tooling & Editing Experience
Drag-and-Drop Editor
Intuitive interface with alignment guides, snap-to-grid, and smart connectors. Easily arrange process boxes, flows, and data elements with precision using mouse or keyboard.
Rich Symbol Library
Access a comprehensive collection of industry-standard Lean symbols, including:
-
Process steps
-
Inventory (triangles)
-
Transport (trucks, conveyors)
-
Information flows (dashed lines, notes)
-
Kanban, FIFO, and pull signals
-
Supplier/customer endpoints
All symbols follow ISO/IEC standards for consistency and clarity.
Pre-Made Templates
Choose from ready-to-use templates:
-
Current State VSM
-
Future State VSM
-
Manufacturing (e.g., juice production, automotive assembly)
-
Healthcare (patient admission to discharge)
-
Software Development (CI/CD pipeline)
-
Logistics & Distribution
-
Retail & Service Operations
Perfect for onboarding new teams or starting projects quickly.
AI-Powered VSM Editor (Game-Changer!)
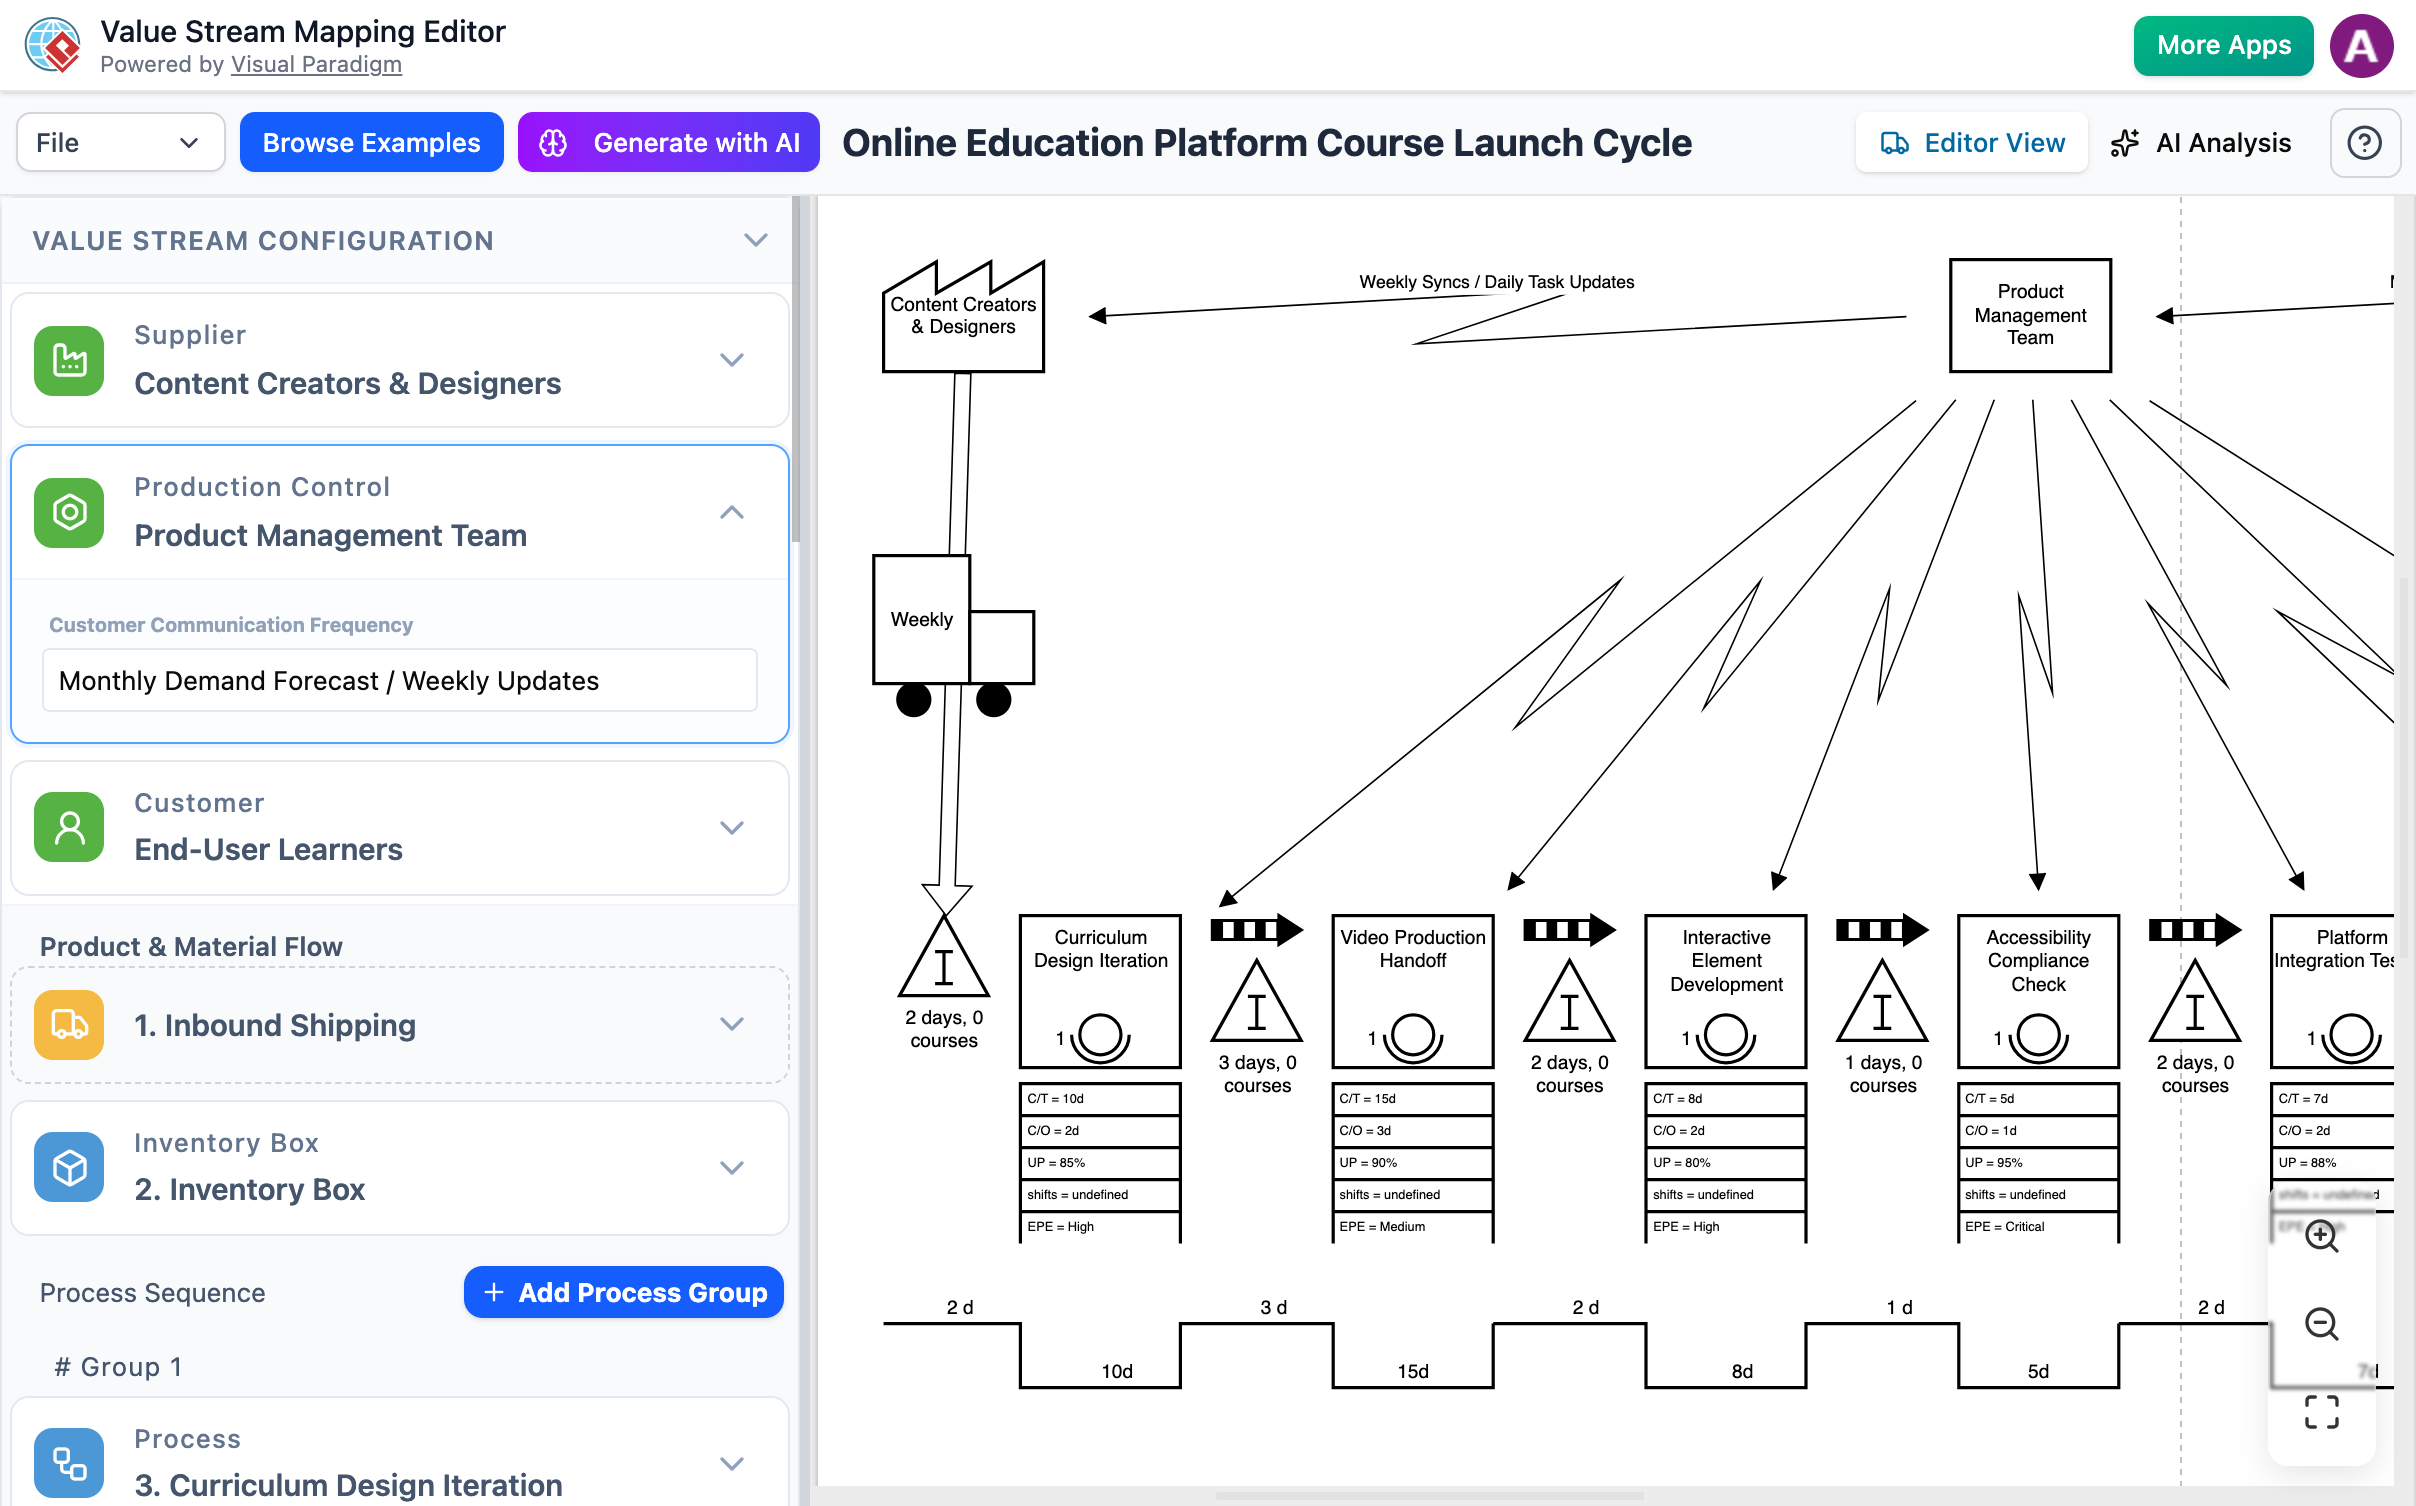
The standout feature: Generate a full VSM in minutes from natural language.
How It Works:
-
Input a description like:
“A customer orders 100 widgets. The process includes: raw material receipt (2 hrs), assembly (30 min/unit), quality inspection (15 min), packaging (10 min), and shipping (1 day). Inventory levels are 50 units at assembly and 20 in packaging.”
-
Or use structured form input to enter cycle times, setup times, inventory, takt time, etc.
-
The AI analyzes context, assigns correct symbols, connects flows, and generates a fully formatted, accurate VSM.
✅ No prior VSM experience needed.
✅ Instant professional-grade diagrams.
✅ Fully editable post-generation.
🚀 From idea to visual map in under 5 minutes.
📊 Analytical & Collaborative Features
Automated Metrics & Real-Time Calculations
As you enter data, Visual Paradigm automatically calculates:
-
Total Lead Time
-
Value-Added Time
-
Process Cycle Efficiency (PCE) = (Value-Added Time / Total Lead Time) × 100%
-
Non-Value-Added Time Ratio
-
Takt Time vs. Cycle Time Comparison
These insights help identify inefficiencies instantly.
AI Consultant & Optimization Engine
The AI doesn’t stop at creation—it analyzes your map.
It detects:
-
Bottlenecks (longest cycle times, high inventory)
-
7 Types of Waste:
-
Overproduction
-
Waiting
-
Transport
-
Over-processing
-
Inventory
-
Motion
-
Defects
-
-
Process Imbalances (e.g., takt time > cycle time = overcapacity)
Then delivers:
-
Actionable recommendations (e.g., “Reduce setup time by 20%”)
-
What-If Scenarios (simulate changes: “What if we reduce inspection time by 50%?”)
-
Predictive Impact Reports on lead time, cost, and throughput
-
Executive summaries for leadership reviews
🎯 Turns VSM from a static diagram into a dynamic improvement engine.
Real-Time Collaboration
Multiple users can edit the same map simultaneously. Use:
-
Commenting system for feedback
-
Version history to track changes
-
Live chat & @mentions for team alignment
Ideal for cross-functional Lean teams, Kaizen events, or remote workshops.
Dual-View Interface
Split-screen design with:
-
Left Panel: Data entry (metrics, process details)
-
Right Panel: Visual diagram (auto-updating in real time)
Ensures accuracy and consistency—no more mismatched data and visuals.
Export & Sharing Options
Export your final VSM in:
-
PNG / JPG (for presentations)
-
SVG (scalable vector graphics for web)
-
PDF (professional reports, documentation)
-
Markdown (for integration into wikis, Confluence, or internal portals)
Share via link or embed in dashboards, reports, or training materials.
Step-by-Step Guide: Creating a VSM in Visual Paradigm
Follow this proven workflow to create impactful maps—whether manually or with AI.
✅ Step 1: Access the Tool
-
Go to VP Online or install the desktop app.
-
Sign in or create a free account (includes full VSM features).
✅ Step 2: Start a New Diagram
-
Navigate to Diagrams > Value Stream Mapping.
-
Choose a template:
-
Current State VSM(baseline) -
Future State VSM(improvement vision) -
Industry-specific (e.g.,
Software Development VSM)
-
✅ Step 3: Choose Your Creation Method
Option A: Manual Creation (Traditional)
-
Drag process boxes from the library.
-
Add inventory triangles, transport icons, and information flow arrows.
-
Attach data boxes to each process.
-
Enter cycle time, setup time, inventory levels, takt time, etc.
-
Connect flows logically (material → process → info → next step).
Best for experts or when customizing existing processes.
Option B: AI-Assisted Creation (Fast & Smart)
-
Click “AI VSM Editor” in the toolbar.
-
Paste a plain English description of your process:
“Customer orders 50 units of Product X. Raw materials arrive in 2 days. Assembly takes 45 min per unit with 10 min setup. Testing takes 20 min. Packaging requires 15 min. Final shipment takes 1 day. Current WIP at assembly: 30 units. At packaging: 10 units.”
-
Click Generate.
-
Review the auto-generated map—edit, refine, or accept as-is.
Perfect for beginners, rapid prototyping, or large-scale mapping.
✅ Step 4: Customize & Analyze
-
Adjust cycle times, staffing, or inventory levels.
-
Use the AI Consultant to:
-
Detect bottlenecks
-
Identify waste
-
Suggest improvements
-
-
Run what-if scenarios:
-
“What if we reduce setup time from 10 to 5 minutes?”
-
“What if we implement kanban between assembly and testing?”
-
Watch real-time updates in lead time, PCE, and efficiency.
✅ Step 5: Create the Future State Map
-
Duplicate your current state map.
-
Apply improvements:
-
Reduce inventory
-
Balance workloads
-
Introduce pull systems
-
Implement continuous flow
-
-
Re-run AI analysis to validate gains.
Use this future state as a roadmap for implementation.
✅ Step 6: Export & Share
-
Export as PDF for executive presentations.
-
Save as PNG for posters or wall displays.
-
Share via link or embed in internal documentation.
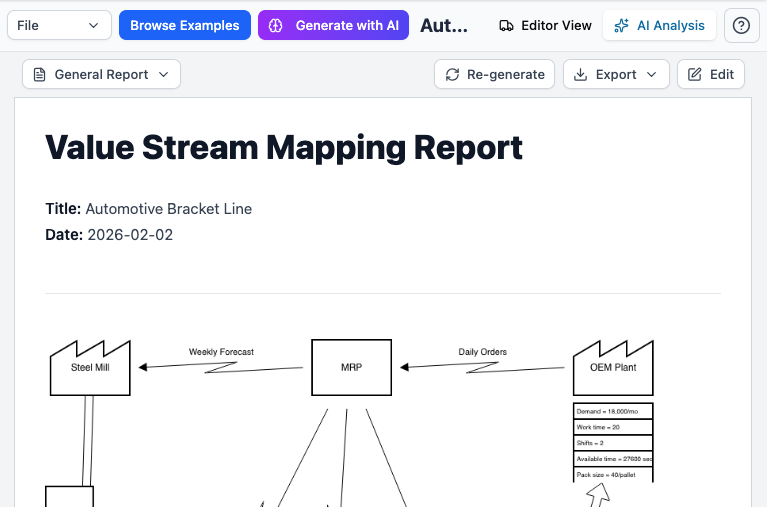
-
Generate automated reports with insights, recommendations, and KPIs.
Benefits of Using Visual Paradigm for VSM
| Benefit | Impact |
|---|---|
| Speeds up mapping | From hours to minutes with AI |
| Improves accuracy | Auto-calculations eliminate manual errors |
| Enables data-driven decisions | Metrics and AI insights guide actions |
| Supports collaboration | Teams work together in real time |
| Scales across industries | Templates for manufacturing, healthcare, software, logistics |
| Facilitates continuous improvement | Easy to update and re-analyze over time |
🌟 Ideal for Lean Six Sigma teams, Kaizen events, digital transformation initiatives, and operational excellence programs.
Advanced Use Cases & Integrations
Visual Paradigm isn’t limited to standalone VSM. It integrates seamlessly with other modeling tools for enterprise-level process optimization:
-
BPMN (Business Process Model and Notation) – Map detailed workflows and automate processes.
-
Customer Journey Mapping – Align VSM with customer experience touchpoints.
-
SIPOC (Suppliers, Inputs, Process, Outputs, Customers) – Use VSM to validate and enhance high-level process views.
-
Kanban & Agile Boards – Link VSM insights to sprint planning and backlog prioritization.
Use Visual Paradigm as a unified platform for Lean, Agile, and operational excellence.
Conclusion: Empower Your Organization with Intelligent VSM
Value Stream Mapping is no longer just a static diagram—it’s a dynamic, intelligent tool for transformation. With Visual Paradigm, organizations can:
-
Accelerate VSM creation with AI
-
Analyze deeply with automated metrics and AI insights
-
Collaborate effectively across teams
-
Visualize future state improvements with confidence
Whether you’re mapping a factory floor, a software release pipeline, or a patient care journey, Visual Paradigm turns complex processes into clear, actionable insights.
🚀 Start your Lean journey today—create your first VSM in minutes, not weeks.
References & Resources
- AI Value Stream Mapping (VSM) Editor | Visual Paradigm
Explore AI generation, analysis, and industry templates. - Value Stream Mapping Tool | Visual Paradigm
Core features: drag-and-drop, symbol library, collaboration, export. - Value Stream Mapping Software | VP Online
Online platform: templates, real-time collaboration, export formats. - Comprehensive Guide to Value-Stream Mapping | Visual Paradigm Blog
In-depth concepts, examples, and best practices. - AI Value Stream Mapping Tool Release | Visual Paradigm Updates
Official announcement with capabilities and benefits. - AI Value Stream Mapping Editor | Visual Paradigm Features
Detailed breakdown of input methods, automatic generation, and analysis.
Ready to Transform Your Processes?
👉 Start Your Free Trial of Visual Paradigm Today
🌐 No credit card required. Fully functional for 14 days.
