


Introduction
In systems analysis and software engineering, understanding how data moves through a system is just as critical as understanding the code that processes it. The Data Flow Diagram (DFD) remains one of the most effective tools for visualizing these movements. Unlike flowcharts, which depict control flow and decision logic, DFDs focus strictly on data transformation: where data comes from, how it is processed, where it is stored, and where it ultimately goes.
However, complex systems cannot be captured in a single diagram without becoming an unreadable “spaghetti” mess. This is where leveling becomes essential. Leveling allows analysts to decompose a system hierarchically, starting with a high-level context view and drilling down into granular sub-processes while maintaining strict consistency between layers.
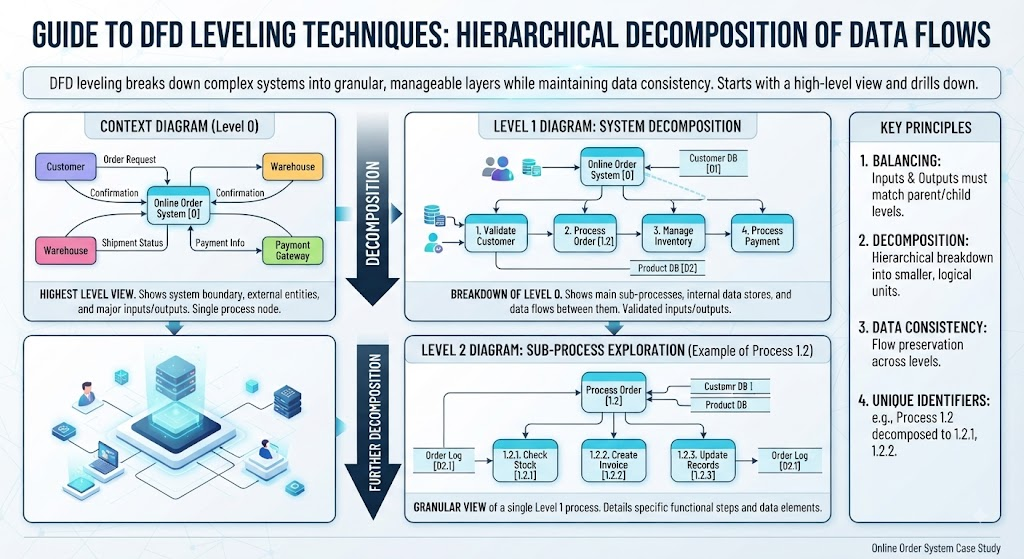
This guide provides a comprehensive walkthrough of leveled DFD modeling using a practical Online Order System case study. We will explore the core concepts of balancing, decomposition, and data store management, illustrating each principle with validated, internally consistent diagrams ranging from Level 0 (Context) to Level 2 (Sub-decomposition). Whether you are a student learning structured analysis or a practitioner documenting a legacy system, this guide will demonstrate how to build DFDs that are both visually clear and rigorously correct.
Key Concepts in Data Flow Modeling
Before examining the specific diagrams, it is vital to understand the foundational vocabulary and rules that govern DFDs.
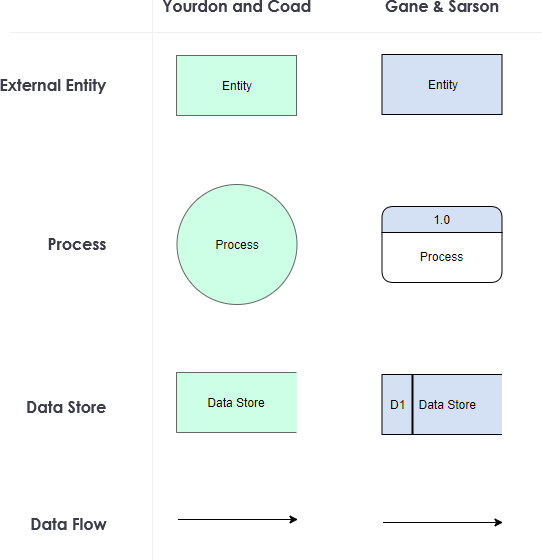
1. The Four Core Symbols
-
External Entity (Rectangle): Sources or destinations of data outside the system boundary (e.g., Customer, Supplier). They trigger or receive data but do not process it.
-
Process (Circle/Rounded Rectangle): A transformation of data. Every process must have at least one input and one output. Processes are numbered hierarchically (e.g., 1.0, 1.1, 1.2).
-
Data Store (Open-Ended Rectangle): A repository for data at rest (e.g., database tables, files). Data stores can be read from or written to by processes.
-
Data Flow (Arrow): The movement of data between entities, processes, and stores. Flows should be labeled with meaningful noun phrases (e.g., “Order Details,” not “Data”).
2. The Principle of Balancing
Balancing is the golden rule of leveled DFDs. It states that the inputs and outputs of a parent process must exactly match the combined inputs and outputs of its child processes.
-
If Process
2.0receives “Stock Availability” from a Supplier at Level 1, then one of its sub-processes (e.g.,2.2) must also receive “Stock Availability” at Level 2. -
New internal flows and stores may appear at lower levels, but external interfaces cannot change or disappear during decomposition.
3. Decomposition and Abstraction
Decomposition is the act of breaking a complex process into smaller, manageable sub-processes.
-
Level 0: Abstracts the entire system as a single black box.
-
Level 1: Reveals major functional areas.
-
Level 2+: Exposes detailed logic within a specific Level 1 process.
Each level should maintain a consistent scope; a Level 2 diagram should only detail one Level 1 process, not mix elements from multiple parents.
4. Data Store Consistency
A common error in DFD modeling is introducing a data store at a lower level that was not visible at the parent level. While a child diagram can show more detail about how a store is used, the store itself must be connected to the parent process in the higher-level diagram. If a sub-process writes to D4 Purchase Orders, the parent process 2.0 must also show a connection to D4. This prevents “magic” data stores from appearing out of nowhere.
Case Study: Online Order System DFDs
The following sections present a complete, validated set of DFDs for an Online Order System. These diagrams have been checked for internal consistency, ensuring that all flows balance across levels and all data stores are properly surfaced.
Level 0 — Context Diagram
The context diagram defines the system boundary. It treats the entire Online Order System as a single process (0) and identifies all external actors. This diagram answers the question: “What interacts with our system, and what data crosses the boundary?”
External Entities Identified:
-
Customer: Initiates orders and receives status updates.
-
Payment Gateway: External financial service for authorization.
-
Supplier: Provides stock data and receives dispatch instructions.
-
Admin: Manages catalog content and consumes analytical reports.
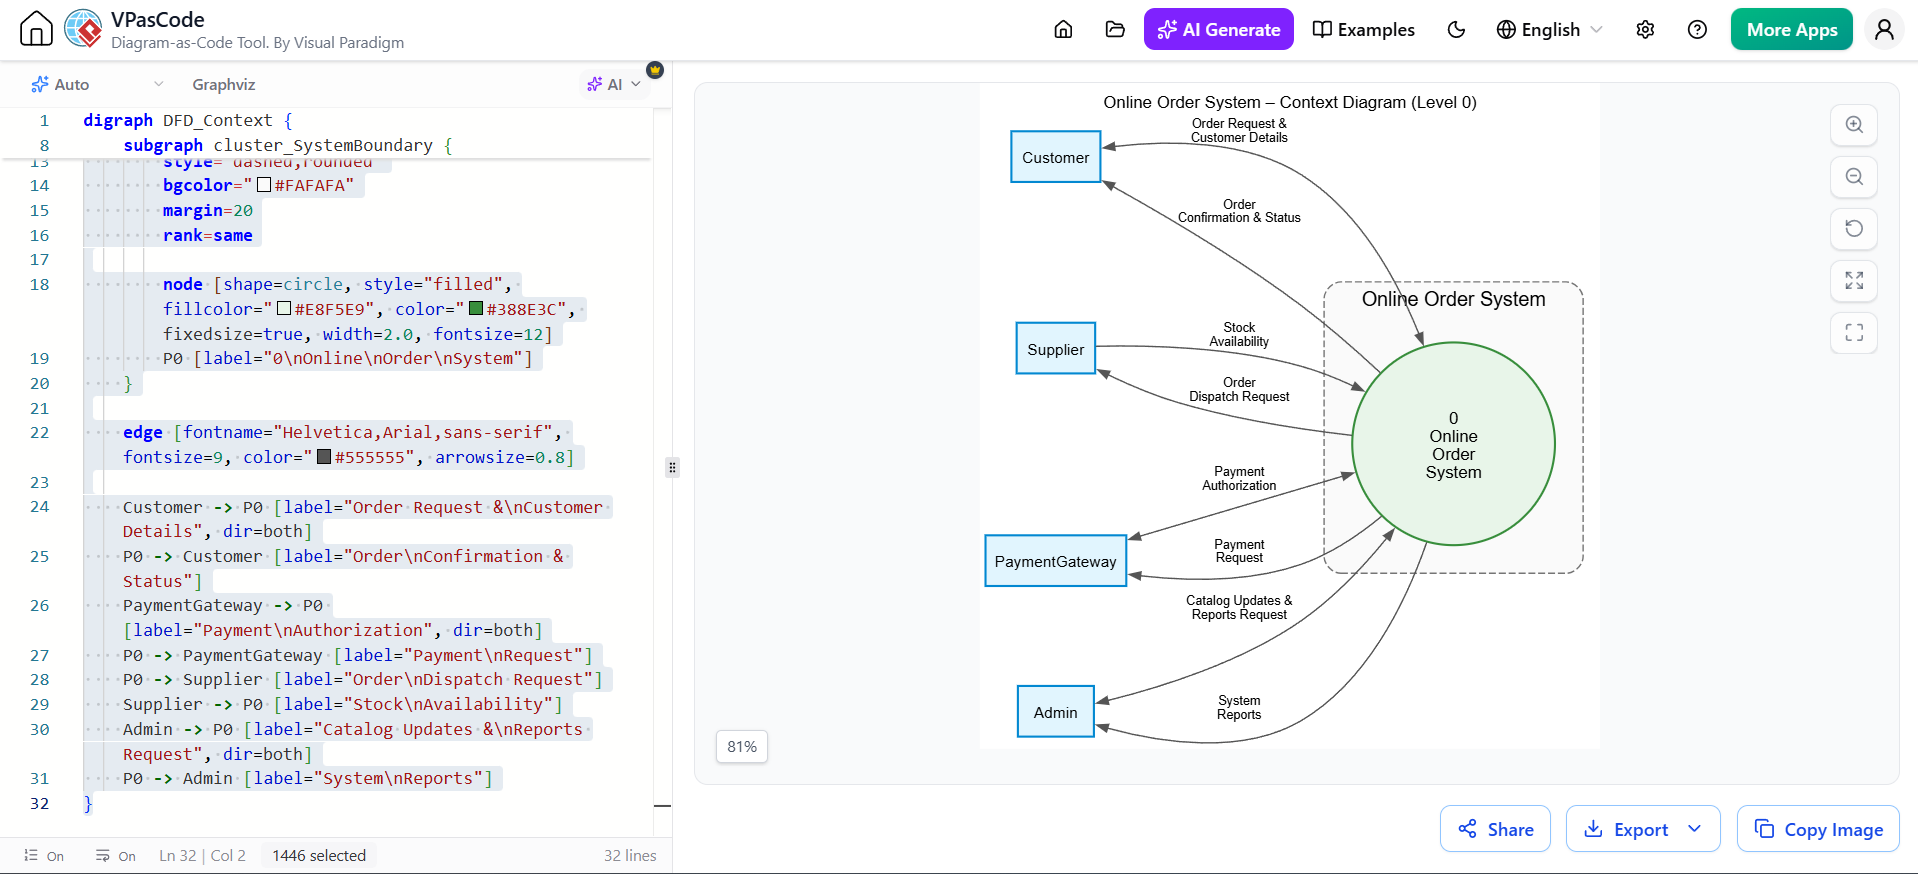
digraph DFD_Context {
    graph [rankdir=LR, splines=true, overlap=false, nodesep=0.6, ranksep=1.0, fontname="Helvetica,Arial,sans-serif", fontsize=12, label="Online Order System – Context Diagram (Level 0)", labelloc=t]
    node [fontname="Helvetica,Arial,sans-serif", fontsize=11, penwidth=1.5]

    node [shape=box, style="filled", fillcolor="#E1F5FE", color="#0288D1"]
    Customer; Supplier; PaymentGateway; Admin;

    subgraph cluster_SystemBoundary {
        label="Online Order System"
        fontname="Helvetica,Arial,sans-serif"
        fontsize=14
        color="#757575"
        style="dashed,rounded"
        bgcolor="#FAFAFA"
        margin=20
        rank=same

        node [shape=circle, style="filled", fillcolor="#E8F5E9", color="#388E3C", fixedsize=true, width=2.0, fontsize=12]
        P0 [label="0\nOnline\nOrder\nSystem"]
    }

    edge [fontname="Helvetica,Arial,sans-serif", fontsize=9, color="#555555", arrowsize=0.8]

    Customer -> P0 [label="Order Request &\nCustomer Details", dir=both]
    P0 -> Customer [label="Order\nConfirmation & Status"]
    PaymentGateway -> P0 [label="Payment\nAuthorization", dir=both]
    P0 -> PaymentGateway [label="Payment\nRequest"]
    P0 -> Supplier [label="Order\nDispatch Request"]
    Supplier -> P0 [label="Stock\nAvailability"]
    Admin -> P0 [label="Catalog Updates &\nReports Request", dir=both]
    P0 -> Admin [label="System\nReports"]
}
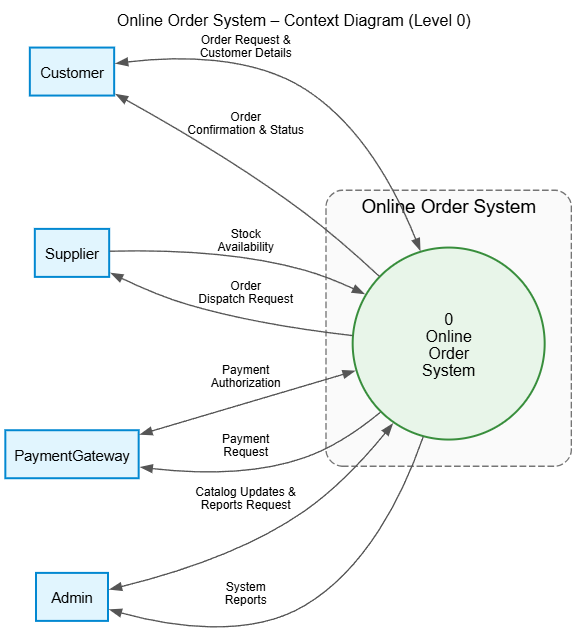
Analysis of Level 0:
Notice that no data stores appear here. At the context level, we are only concerned with the system’s interface with the outside world. Internal storage is an implementation detail hidden behind the 0 Online Order System process bubble. All flows are bidirectional where appropriate (e.g., the Customer sends requests and receives confirmations), establishing the complete external contract of the system.
Level 1 — System Decomposition
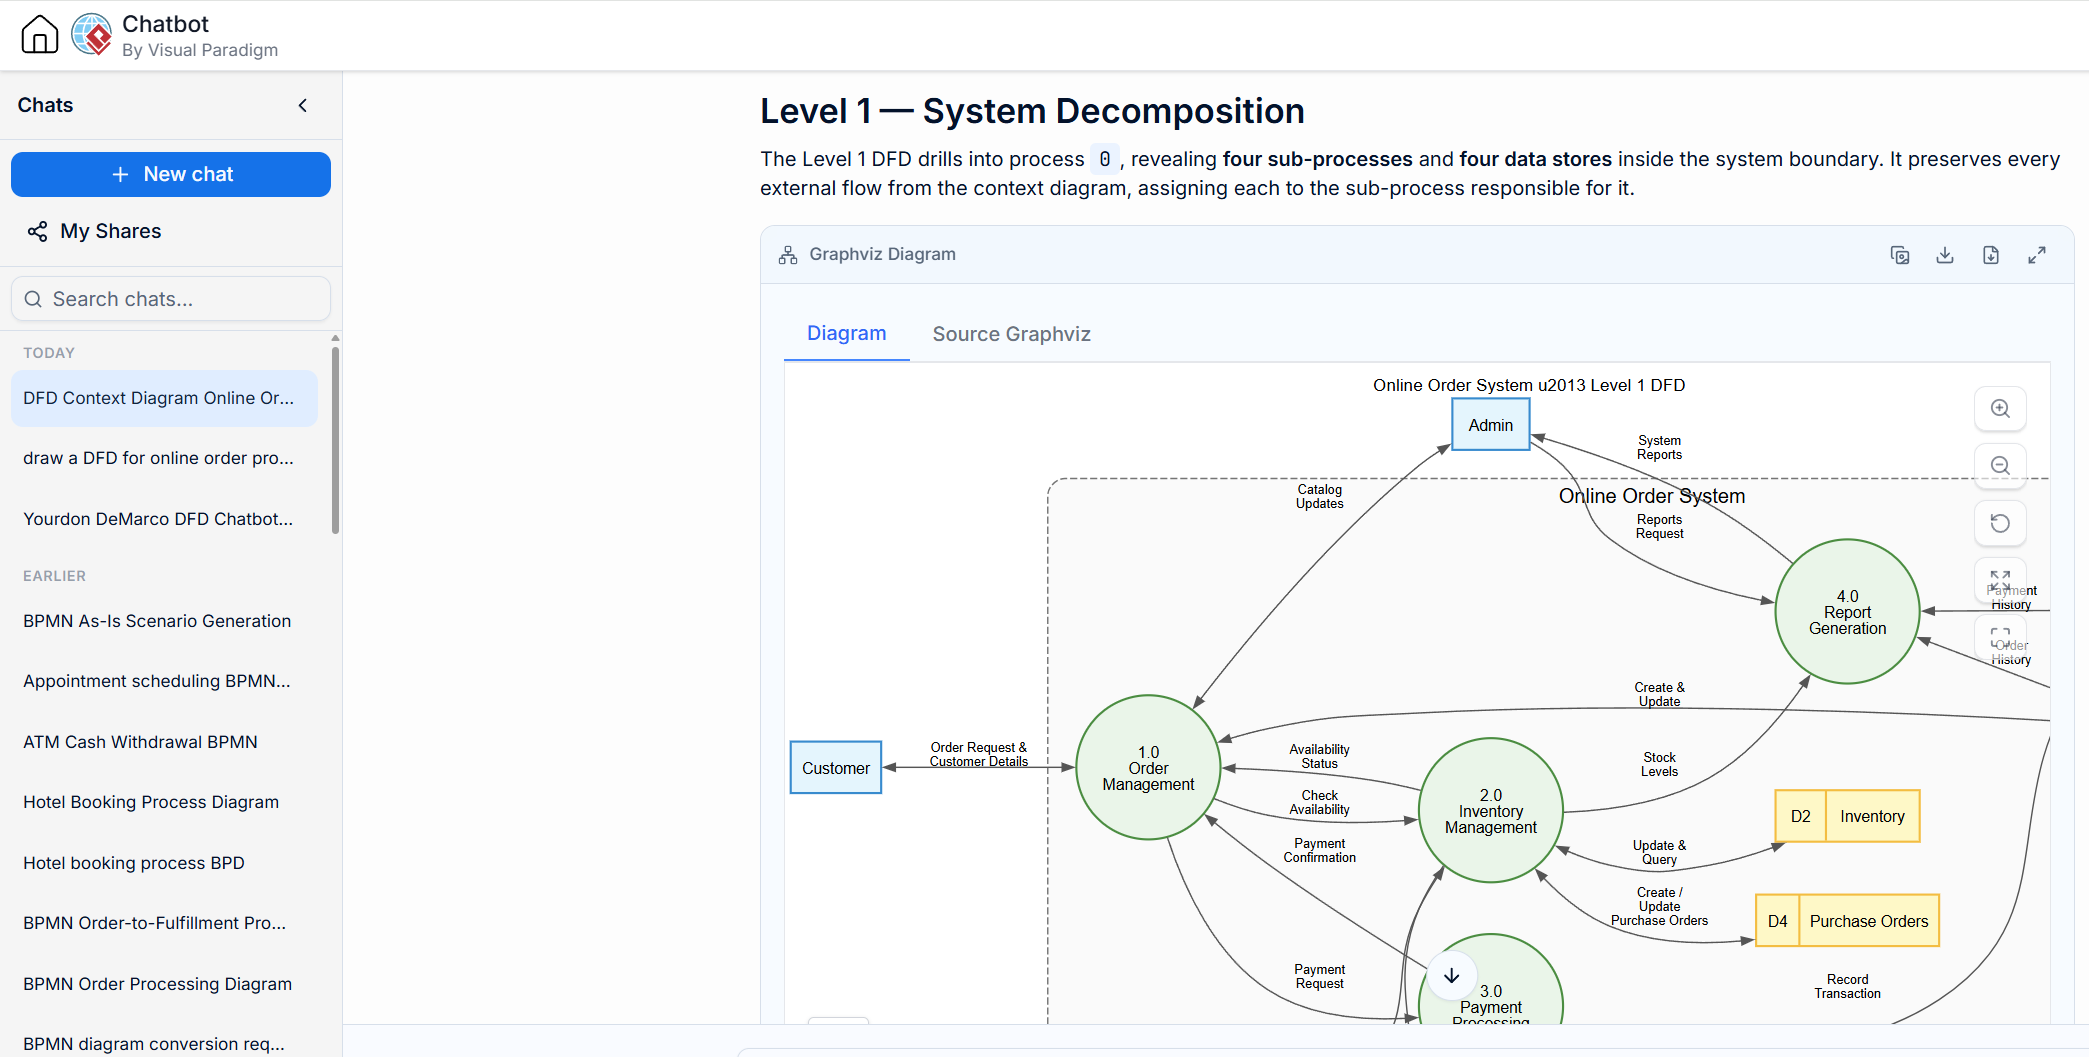
Level 1 explodes the single process 0 into four distinct functional sub-processes and introduces the internal data stores required to support them. Crucially, every external flow from Level 0 is preserved and routed to the specific sub-process responsible for handling it.
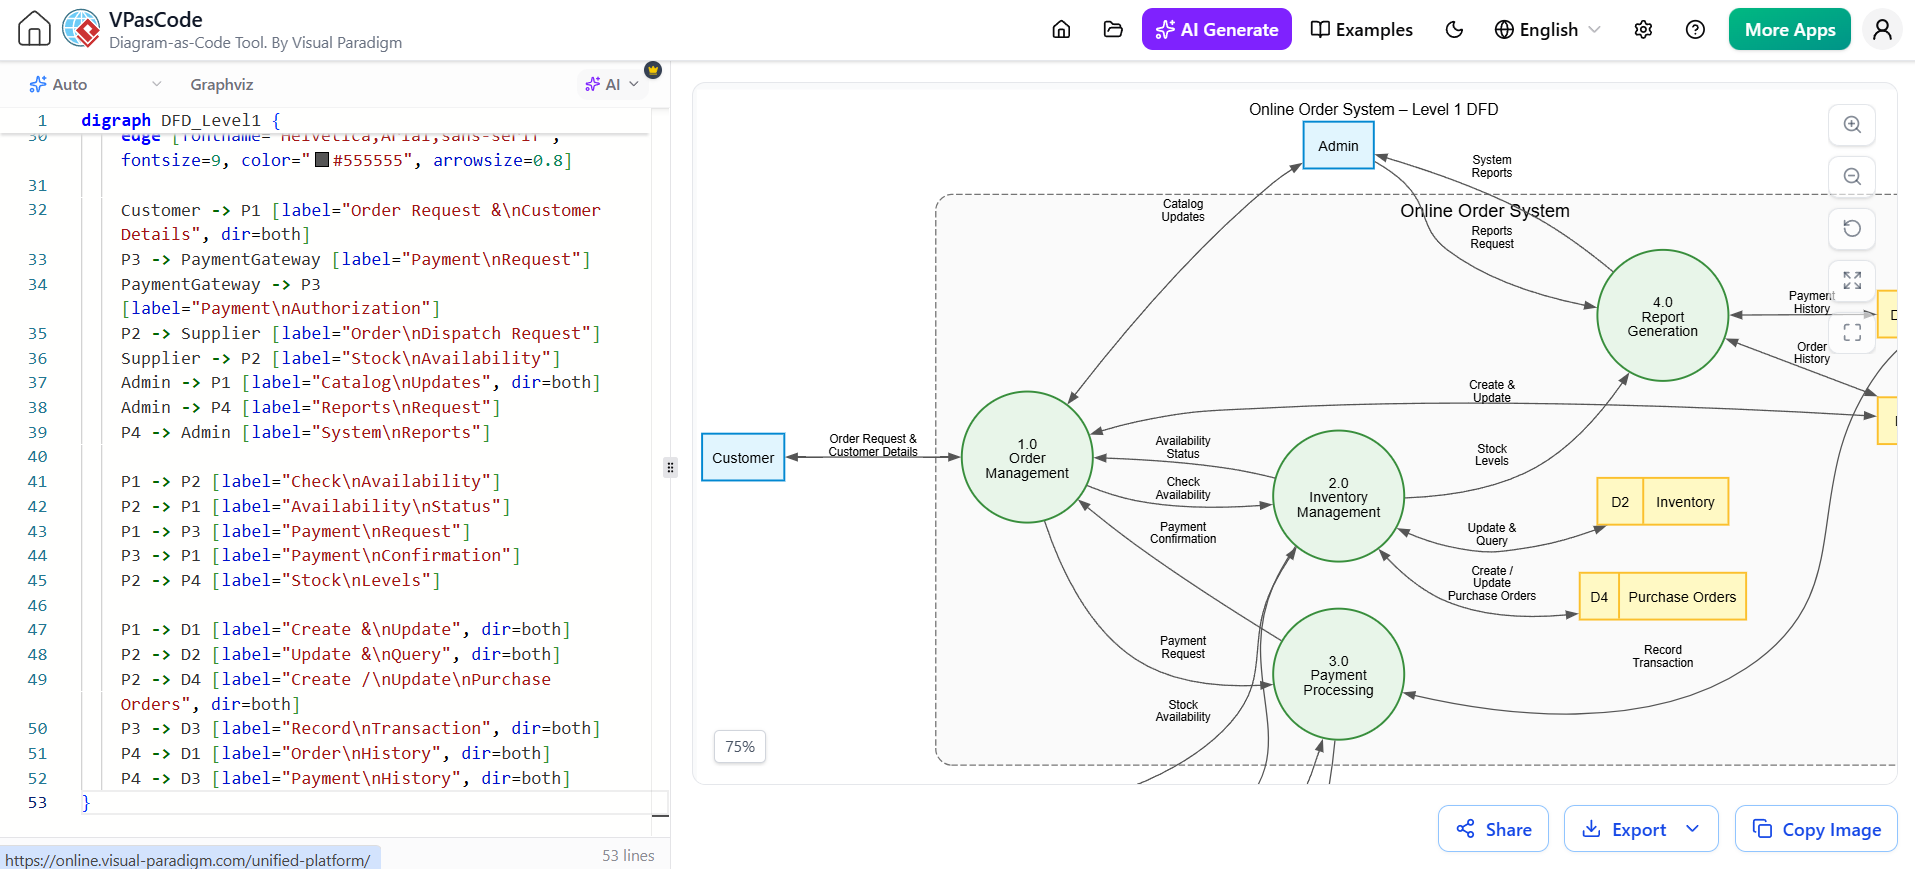
digraph DFD_Level1 {
    graph [rankdir=LR, splines=true, overlap=false, nodesep=0.5, ranksep=0.9, fontname="Helvetica,Arial,sans-serif", fontsize=12, label="Online Order System – Level 1 DFD", labelloc=t]
    node [fontname="Helvetica,Arial,sans-serif", fontsize=11, penwidth=1.5]

    node [shape=box, style="filled", fillcolor="#E1F5FE", color="#0288D1"]
    Customer; Supplier; PaymentGateway; Admin;

    subgraph cluster_SystemBoundary {
        label="Online Order System"
        fontname="Helvetica,Arial,sans-serif"
        fontsize=14
        color="#757575"
        style="dashed,rounded"
        bgcolor="#FAFAFA"
        margin=20

        node [shape=circle, style="filled", fillcolor="#E8F5E9", color="#388E3C", fixedsize=true, width=1.4]
        P1 [label="1.0\nOrder\nManagement"]
        P2 [label="2.0\nInventory\nManagement"]
        P3 [label="3.0\nPayment\nProcessing"]
        P4 [label="4.0\nReport\nGeneration"]

        node [shape=record, style="filled", fillcolor="#FFF9C4", color="#FBC02D", fixedsize=false]
        D1 [label="{ <id> D1 | Orders }"]
        D2 [label="{ <id> D2 | Inventory }"]
        D3 [label="{ <id> D3 | Payments }"]
        D4 [label="{ <id> D4 | Purchase Orders }"]
    }

    edge [fontname="Helvetica,Arial,sans-serif", fontsize=9, color="#555555", arrowsize=0.8]

    Customer -> P1 [label="Order Request &\nCustomer Details", dir=both]
    P3 -> PaymentGateway [label="Payment\nRequest"]
    PaymentGateway -> P3 [label="Payment\nAuthorization"]
    P2 -> Supplier [label="Order\nDispatch Request"]
    Supplier -> P2 [label="Stock\nAvailability"]
    Admin -> P1 [label="Catalog\nUpdates", dir=both]
    Admin -> P4 [label="Reports\nRequest"]
    P4 -> Admin [label="System\nReports"]

    P1 -> P2 [label="Check\nAvailability"]
    P2 -> P1 [label="Availability\nStatus"]
    P1 -> P3 [label="Payment\nRequest"]
    P3 -> P1 [label="Payment\nConfirmation"]
    P2 -> P4 [label="Stock\nLevels"]

    P1 -> D1 [label="Create &\nUpdate", dir=both]
    P2 -> D2 [label="Update &\nQuery", dir=both]
    P2 -> D4 [label="Create /\nUpdate\nPurchase Orders", dir=both]
    P3 -> D3 [label="Record\nTransaction", dir=both]
    P4 -> D1 [label="Order\nHistory", dir=both]
    P4 -> D3 [label="Payment\nHistory", dir=both]
}
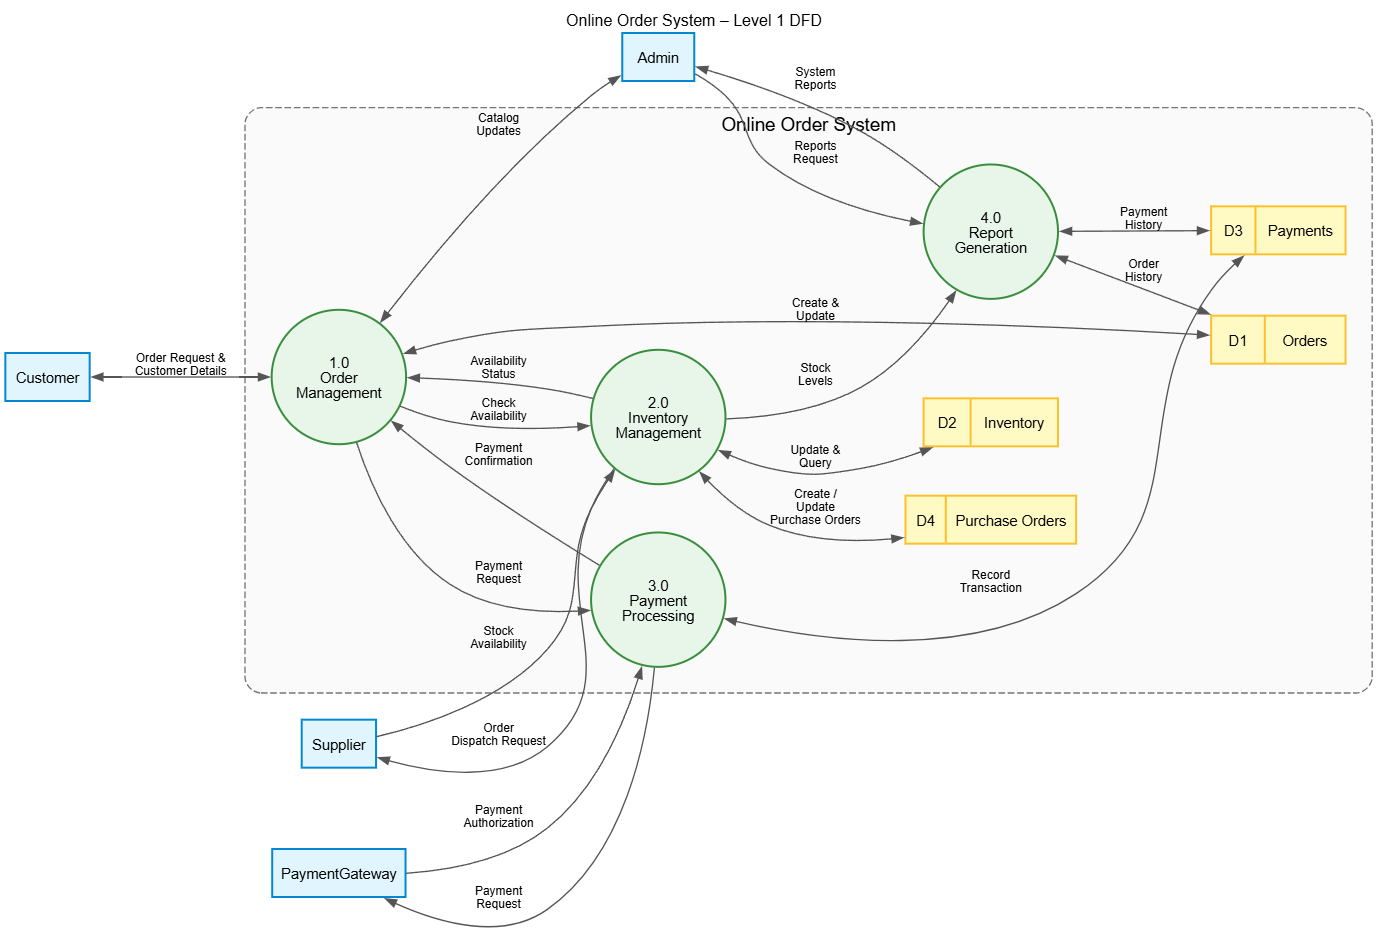
Functional Breakdown
-
1.0 Order Management: Acts as the primary orchestrator. It interfaces directly with the Customer and coordinates with Inventory (
2.0) and Payment (3.0). It owns theD1 Ordersstore. -
2.0 Inventory Management: Handles all stock-related logic. It communicates with the Supplier and manages both
D2 InventoryandD4 Purchase Orders. Note thatD4is explicitly connected here—this is a critical consistency point discussed below. -
3.0 Payment Processing: Isolates financial transactions. It talks exclusively to the Payment Gateway and maintains
D3 Payments. -
4.0 Report Generation: Is a read-heavy process. It pulls historical data from
D1,D3, and current levels from2.0to generate reports for the Admin.
Example of Balancing Verification
Compare the Supplier flows between Level 0 and Level 1:
-
Level 0:
Supplier ↔ Process 0(Stock Availability / Dispatch Request) -
Level 1:
Supplier ↔ Process 2.0(Stock Availability / Dispatch Request)
The flows are identical in name and direction, simply reassigned to the specific sub-process responsible. This confirms the diagram is balanced.
Level 2 — Decomposition of 2.0 Inventory Management
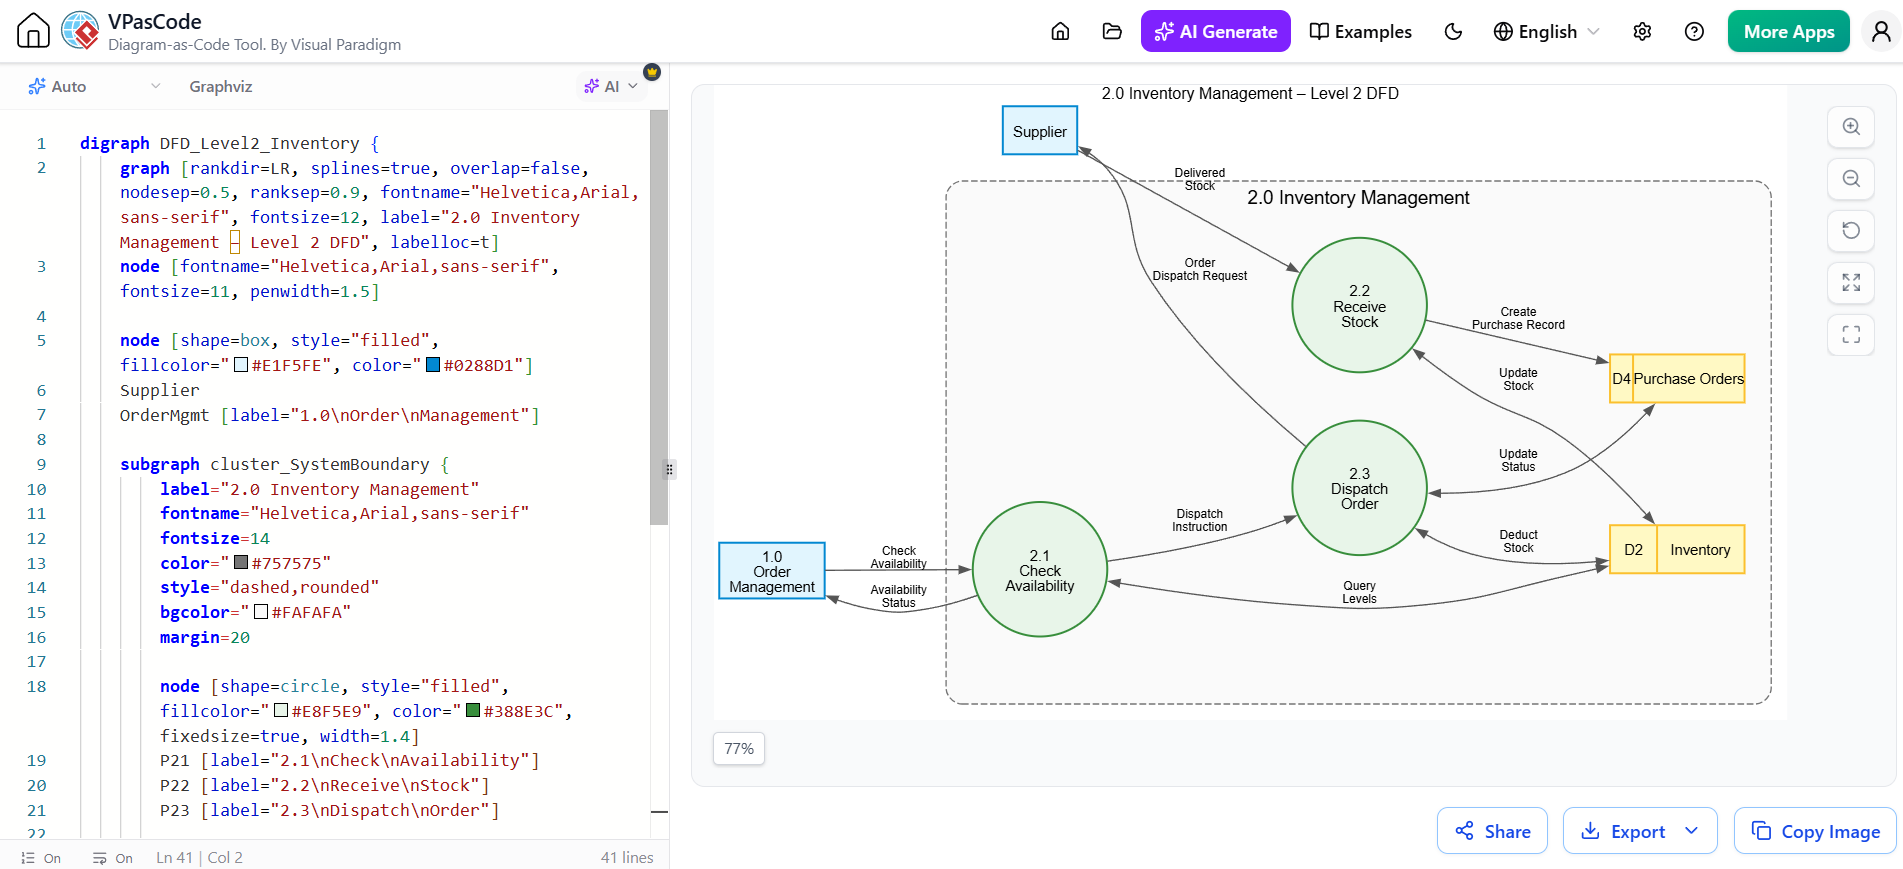
Level 2 takes a single process from Level 1 (2.0 Inventory Management) and reveals its internal mechanics. This diagram does not show 1.0, 3.0, or 4.0; it focuses exclusively on the children of 2.0.
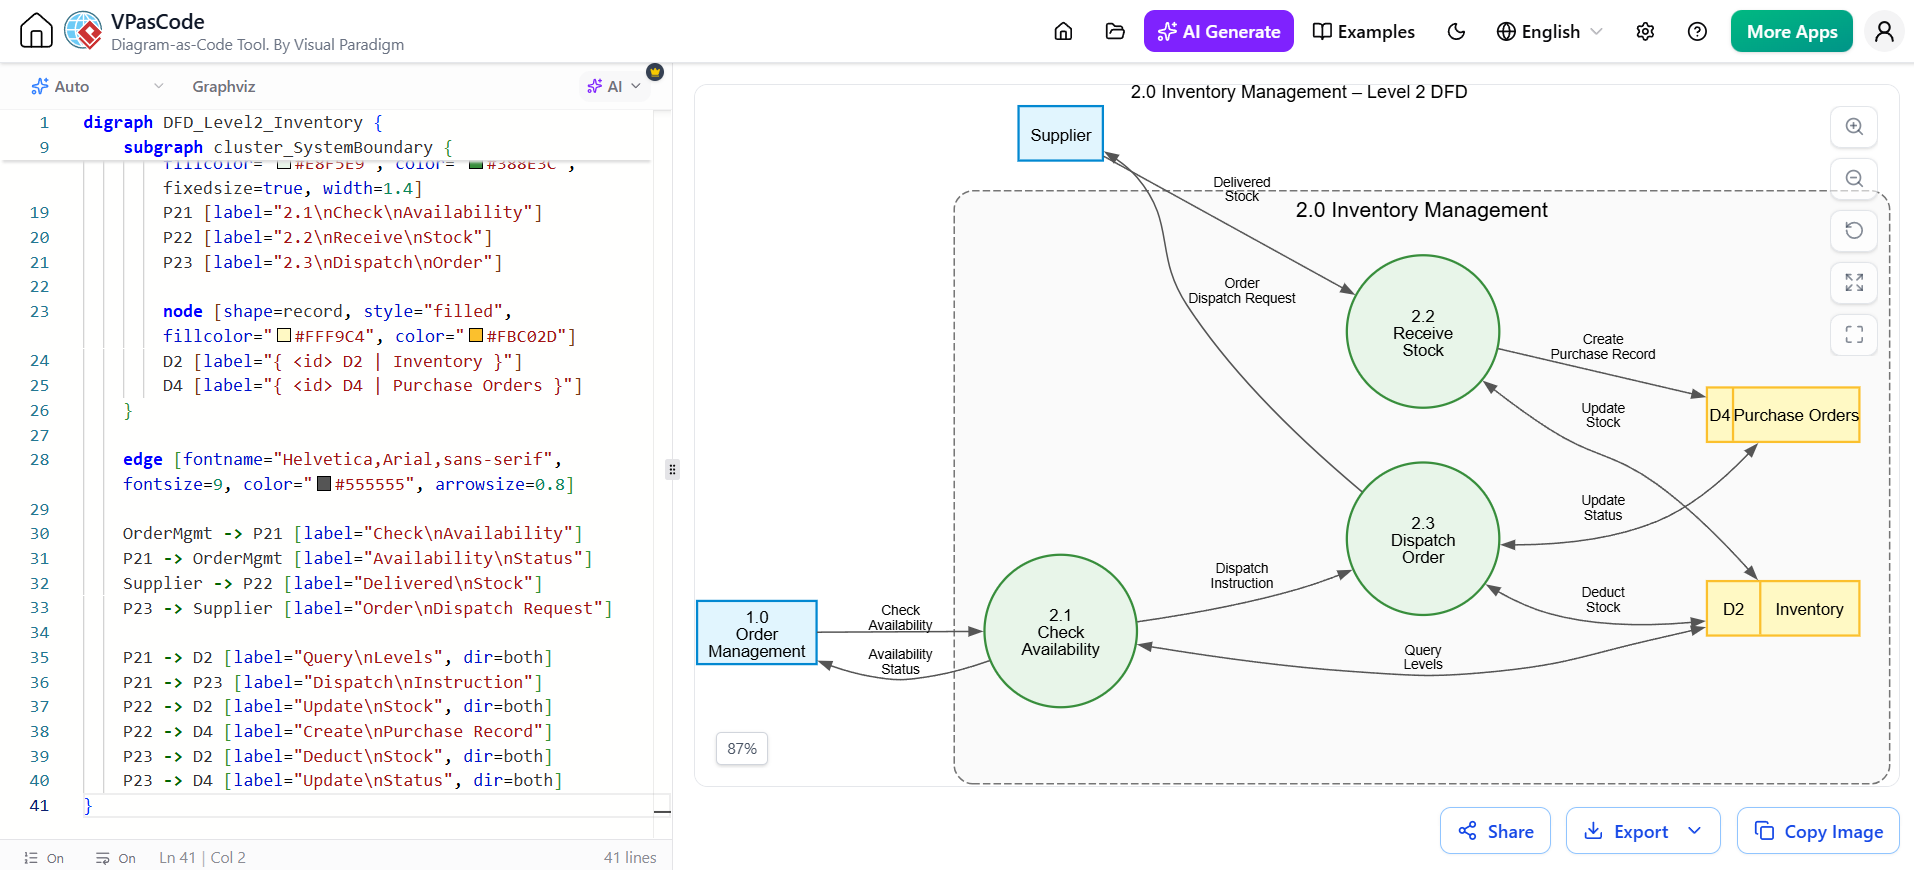
digraph DFD_Level2_Inventory {
    graph [rankdir=LR, splines=true, overlap=false, nodesep=0.5, ranksep=0.9, fontname="Helvetica,Arial,sans-serif", fontsize=12, label="2.0 Inventory Management – Level 2 DFD", labelloc=t]
    node [fontname="Helvetica,Arial,sans-serif", fontsize=11, penwidth=1.5]

    node [shape=box, style="filled", fillcolor="#E1F5FE", color="#0288D1"]
    Supplier
    OrderMgmt [label="1.0\nOrder\nManagement"]

    subgraph cluster_SystemBoundary {
        label="2.0 Inventory Management"
        fontname="Helvetica,Arial,sans-serif"
        fontsize=14
        color="#757575"
        style="dashed,rounded"
        bgcolor="#FAFAFA"
        margin=20

        node [shape=circle, style="filled", fillcolor="#E8F5E9", color="#388E3C", fixedsize=true, width=1.4]
        P21 [label="2.1\nCheck\nAvailability"]
        P22 [label="2.2\nReceive\nStock"]
        P23 [label="2.3\nDispatch\nOrder"]

        node [shape=record, style="filled", fillcolor="#FFF9C4", color="#FBC02D"]
        D2 [label="{ <id> D2 | Inventory }"]
        D4 [label="{ <id> D4 | Purchase Orders }"]
    }

    edge [fontname="Helvetica,Arial,sans-serif", fontsize=9, color="#555555", arrowsize=0.8]

    OrderMgmt -> P21 [label="Check\nAvailability"]
    P21 -> OrderMgmt [label="Availability\nStatus"]
    Supplier -> P22 [label="Delivered\nStock"]
    P23 -> Supplier [label="Order\nDispatch Request"]

    P21 -> D2 [label="Query\nLevels", dir=both]
    P21 -> P23 [label="Dispatch\nInstruction"]
    P22 -> D2 [label="Update\nStock", dir=both]
    P22 -> D4 [label="Create\nPurchase Record"]
    P23 -> D2 [label="Deduct\nStock", dir=both]
    P23 -> D4 [label="Update\nStatus", dir=both]
}
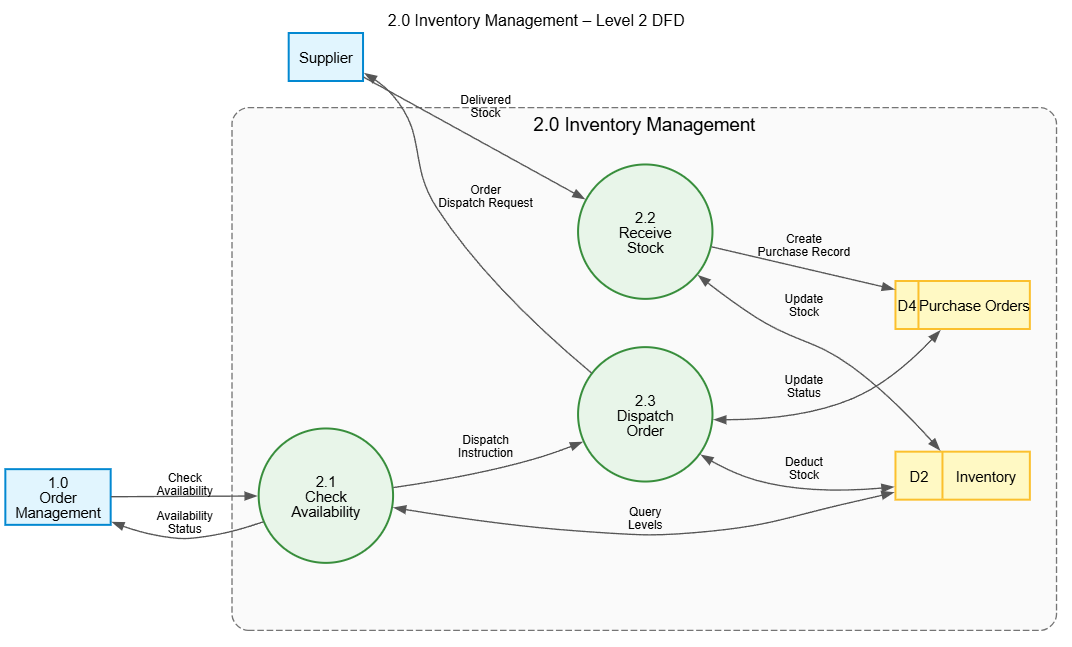
Sub-Process Logic
-
2.1 Check Availability: Receives queries from
1.0 Order Management. It readsD2and returns status. If available, it triggers2.3via an internal “Dispatch Instruction” flow. -
2.2 Receive Stock: Handles inbound logistics. When the Supplier delivers goods, this process updates
D2(increasing quantity) and creates a record inD4. -
2.3 Dispatch Order: Handles outbound logistics. It deducts from
D2, updates the dispatch status inD4, and sends the formal request to the Supplier.
Critical Consistency Note: The D4 Purchase Orders Store
In many draft DFDs, analysts accidentally introduce D4 only at Level 2 because that is where purchase orders are actually created. However, this violates balancing rules. If D4 exists in Level 2, it must be visible in Level 1 connected to parent process 2.0.
In this validated article, D4 has been correctly surfaced in Level 1 with the flow 2.0 ↔ D4 [Create / Update Purchase Orders]. This ensures that a reader tracing data from Level 1 to Level 2 never encounters an unexplained data store. This attention to detail is what distinguishes a professional, implementable model from a rough sketch.
Tooling: Accelerating DFD Development with Visual Paradigm, AI Chatbots, and VPasCode
Creating balanced, multi-level Data Flow Diagrams manually is a labor-intensive process prone to human error. While the theoretical principles of leveling and consistency are straightforward, enforcing them across dozens of processes and data stores requires disciplined tooling. Modern systems analysis leverages an integrated ecosystem where Visual Paradigm, AI Chatbots, and VPasCode work in concert to transform DFD creation from a drawing exercise into a rigorous, automated engineering workflow.
Visual Paradigm: The Single Source of Truth
Visual Paradigm serves as the foundational modeling environment for the Online Order System diagrams presented in this guide. Unlike generic drawing tools (e.g., Visio or Lucidchart), Visual Paradigm is a model-driven platform that understands DFD semantics rather than just rendering shapes.
-
Automated Balancing Checks: Visual Paradigm can automatically validate parent-child consistency. If you add
D4 Purchase Ordersto Level 2 but forget to connect it to2.0 Inventory Managementat Level 1, the tool flags a balancing violation immediately. This eliminates the manual cross-referencing that traditionally consumes hours of review time. -
Cross-Level Navigation: Clicking on process
2.0at Level 1 instantly navigates to its Level 2 decomposition. This hyperlink-style navigation ensures that analysts never lose context when drilling down, and any changes made at the child level propagate metadata back to the parent. -
Centralized Data Dictionary: All data flows and stores are defined once in a repository. Renaming “Stock Availability” to “Inventory Status” in the dictionary updates every occurrence across all three levels simultaneously, preventing terminology drift.
-
Export to Multiple Formats: The same underlying model generates the DOT/Graphviz code shown in this article, PNG/SVG images for documentation, and even structured specifications for developers, ensuring all artifacts remain synchronized.
AI Chatbots: Semantic Validation and Requirements Elicitation
AI chatbots integrated into the modeling workflow act as an intelligent co-analyst, bridging the gap between unstructured requirements and formal DFD syntax. Their role extends far beyond simple text generation.
-
Requirements-to-Model Translation: Paste raw stakeholder interview transcripts or user stories into the chatbot, and ask it to “Extract external entities, processes, and data stores relevant to inventory management.” The AI identifies candidates like
Supplier,2.2 Receive Stock, andD2 Inventory, providing a validated starting point that reduces initial modeling bias. -
Natural Language Balancing Audits: Ask the chatbot: “Compare the inputs and outputs of Process 2.0 at Level 1 against its children at Level 2. List any missing or extra flows.” The AI performs semantic analysis that complements Visual Paradigm’s syntactic checks, catching issues like mismatched flow labels (
"Stock Info"vs."Stock Availability") that automated tools might miss. -
Consistency Narrative Generation: The explanatory text surrounding each diagram in this article—including the “Critical Consistency Note” about
D4—was drafted with AI assistance. The chatbot analyzes the model structure and generates human-readable justifications for design decisions, accelerating documentation without sacrificing accuracy. -
Stakeholder Communication: Non-technical stakeholders often struggle with DFD notation. The chatbot can translate diagram elements into plain-language summaries: “Process 2.3 deducts stock from the Inventory database and sends a dispatch request to the Supplier” — making validation sessions more productive.
VPasCode: Model-as-Code and Version-Controlled Diagrams
VPasCode (Visual Paradigm as Code) represents the most significant paradigm shift for teams adopting DevOps practices. It treats DFDs not as binary files but as version-controlled, human-readable code, enabling collaboration workflows previously impossible with GUI-only tools.
-
Git-Native DFD Management: The entire Online Order System DFD set can be stored as YAML/JSON/text files in a Git repository. Branches, pull requests, and diffs apply to diagrams just as they do to application code. A reviewer can see exactly which flows were added to Level 2 in a PR diff, rather than comparing two opaque image files.
-
CI/CD Integration for Diagram Validation: Configure your CI pipeline to run Visual Paradigm’s validation engine on every commit. If a developer pushes a change that breaks balancing between Level 1 and Level 2, the build fails automatically. This enforces consistency as a gate, not an afterthought.
-
Programmatic Model Generation: For large-scale systems with repetitive patterns (e.g., 20 similar CRUD processes), VPasCode allows you to script diagram generation. Define a template for a standard “Entity Management” subprocess and instantiate it programmatically, ensuring uniformity and eliminating copy-paste errors.
-
Documentation-as-Code Pipeline: The Markdown article you are reading, complete with embedded DOT diagrams, can be auto-generated from the VPasCode repository. When the model changes, the documentation regenerates in the CI pipeline, guaranteeing that published guides never lag behind the actual system design.
Integrated Workflow: How the Tools Combine
The true power emerges when these three tools operate as a unified pipeline:
| Phase | Primary Tool | Supporting Tools | Outcome |
|---|---|---|---|
| Elicitation | AI Chatbot | — | Structured entity/process list from raw requirements |
| Initial Modeling | Visual Paradigm | AI Chatbot (label suggestions) | Draft Level 0–2 diagrams with semantic guidance |
| Validation | Visual Paradigm + AI Chatbot | VPasCode (CI check) | Syntactic + semantic balancing confirmed |
| Version Control | VPasCode | Git + CI Pipeline | Change-tracked, reviewable model commits |
| Documentation | VPasCode + AI Chatbot | Visual Paradigm (export) | Auto-generated articles with embedded, current diagrams |
| Maintenance | All Three | — | Model, docs, and code stay synchronized indefinitely |
This integrated approach transforms DFD development from a solitary, error-prone task into a collaborative, auditable engineering discipline. For the Online Order System specifically, it means the D4 Purchase Orders consistency fix wasn’t discovered during a painful peer review—it was caught by automated validation, documented by AI, and committed through VPasCode with full traceability. The result is a model set that is not only correct today but remains maintainable as the system evolves tomorrow.
Practical Guidelines for Creating Balanced DFDs
Based on the Online Order System example, follow these best practices when creating your own leveled DFDs:
-
Start Outside-In: Always draw Level 0 first. You cannot decompose a system until you have firmly established its boundaries and external interfaces.
-
Name Flows Precisely: Avoid generic labels like “Data” or “Info.” Use domain-specific terms (“Payment Authorization,” “Stock Availability”). This makes balancing verification significantly easier.
-
Validate Before Decomposing: Do not create Level 2 until Level 1 is verified against Level 0. Errors propagate downward; fixing a missing flow at Level 0 after drawing three Level 2 diagrams is costly.
-
Surface Stores Early: If you know a sub-process will use a database table, add that store to the parent level immediately, even if the parent doesn’t directly manipulate it. Connect it with a general label like “Read/Write” at the parent level, then specify exact operations at the child level.
-
Avoid Control Flow: DFDs are not flowcharts. Do not draw arrows labeled “If stock > 0” or “Wait for approval.” Instead, model the data that carries the condition (e.g., “Availability Status”) and let the process description handle the logic.
-
Use Numbering Rigorously: Adopt a strict hierarchical numbering scheme (1.0, 1.1, 1.1.1). This provides an immediate visual cue about parent-child relationships and makes cross-referencing in documentation straightforward.
Conclusion
A well-constructed set of leveled Data Flow Diagrams serves as both a communication tool and a validation mechanism. As demonstrated with the Online Order System, the progression from Context (Level 0) through System Decomposition (Level 1) to Sub-Process Detail (Level 2) allows stakeholders to engage with the model at their appropriate level of abstraction. Executives can verify system boundaries at Level 0, architects can validate functional allocation at Level 1, and developers can understand data persistence and transformation logic at Level 2.
The key takeaway from this guide is that consistency is non-negotiable. The rigorous application of balancing rules and data store surfacing ensures that the diagrams form a single, coherent model rather than a collection of disconnected sketches. By adhering to these principles, you transform DFDs from simple drawings into reliable blueprints that accurately reflect the data architecture of your system and reduce ambiguity during implementation. Whether documenting a new e-commerce platform or reverse-engineering a legacy application, the disciplined approach outlined here will produce models that are both intellectually sound and practically useful.
References
- Mastering Data Flow Diagrams: A Comprehensive Guide to AI-Assisted Top-Down Decomposition with Visual Paradigm: A detailed walkthrough demonstrating how the VP AI Chatbot assists in creating leveled DFDs (Levels 1-3) for an online order system, highlighting features like top-down decomposition, shared session resumption, and branching .
- AI-Powered DFD Generator in Visual Paradigm AI Chatbot: Generate Data Flow Diagrams with AI Instantly: An official announcement detailing the new AI-powered DFD generation feature, with concrete examples like prompts for Hospital Management and Airline Reservation Systems .
- From ‘Drawing Chores’ to ‘Articulation’: An overview of the AI Chatbot’s role in the broader ecosystem, highlighting its ability to generate various diagram types, including DFDs, from natural language prompts .
- How Visual Paradigm’s AI Chatbot Revolutionizes Diagram Creation: An analysis of the chatbot’s “true modeling intelligence,” emphasizing its understanding of diagram semantics and its integration within a unified workspace, which makes it distinct from general LLMs .
- AI Data Flow Diagram Generator | Visual Paradigm AI: A guide explaining how the AI works across different VP platforms (Desktop, Online, Chatbot) to generate, refine, and export professional DFDs, addressing challenges like “blank canvas syndrome” .
- What Makes Visual Paradigm’s AI Chatbot Different from Other AI Diagram Tools?: A detailed comparison highlighting the chatbot’s foundation in formal modeling standards (UML, SysML, ArchiMate), ensuring generated diagrams are structurally and conceptually valid .
- How to Create DFD with Visual Paradigm Desktop: A foundational guide for manually creating DFDs using Visual Paradigm Desktop, covering context diagrams, decomposition, and balancing checks .
- Mastering Data Flow Diagrams with Visual Paradigm: A Step-by-Step Guide: A beginner-friendly tutorial covering the basics of DFD creation, including the identification of external entities, processes, and data stores, using practical examples .
- Case Study: Enhancing System Modeling Efficiency with Visual Paradigm’s AI-Powered Chatbot: A case study demonstrating the chatbot’s efficiency in generating and explaining diagrams, though the primary example is a sequence diagram, it showcases the broader capabilities that apply to DFD modeling .
- Beginner’s Guide to SSADM DFD Diagrams with Visual Paradigm Online: A guide for learning Data Flow Diagrams using the SSADM methodology with Visual Paradigm Online, offering a collection of templates for practical learning .
Related posts:
 Visual Paradigm Online PowerPoint Web Viewer: Convert PPT to HTML5 with Animations & Transitions
 Complete Guide to Visual Paradigm Online Office Suite
 VPasCode Feature Review Guide: The Ultimate Diagram-as-Code Solution for Modern Teams
Mastering Business Process Modeling: A Practical Guide to BPMN 2.0
VPasCode Feature Review Guide: The Ultimate Diagram-as-Code Solution for Modern Teams
Mastering Business Process Modeling: A Practical Guide to BPMN 2.0

 English
 Arabic
 Chinese (Simplified)
 Dutch
Dutch French
 German
 Italian
 Japanese
 Korean
 Portuguese
 Russian
 Spanish