


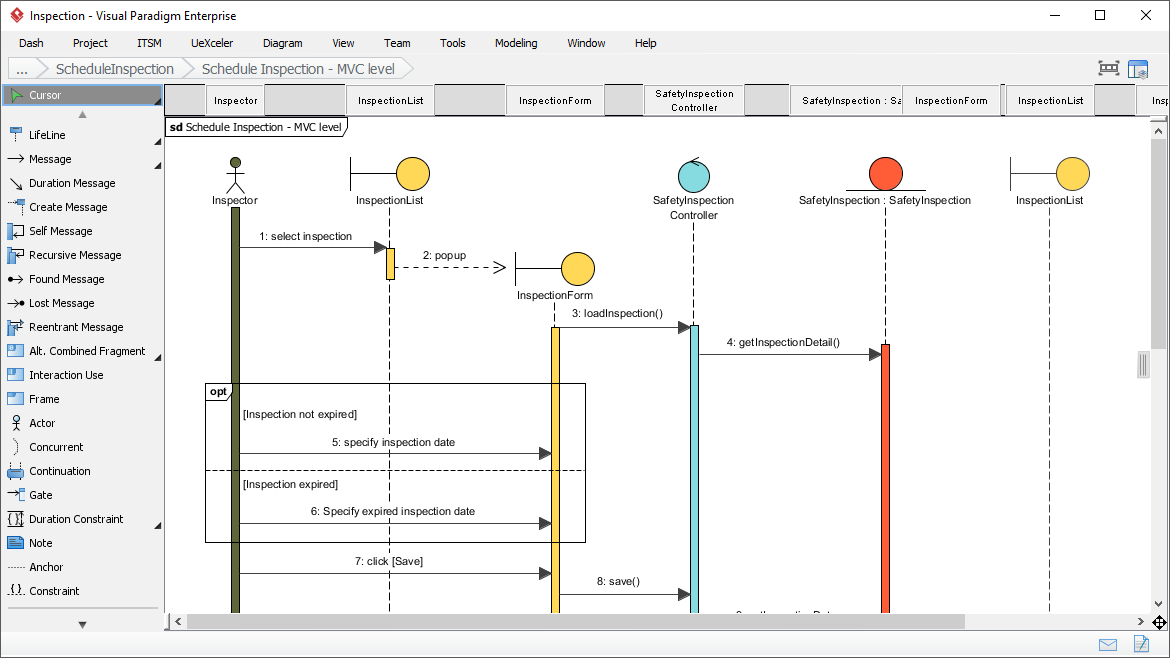
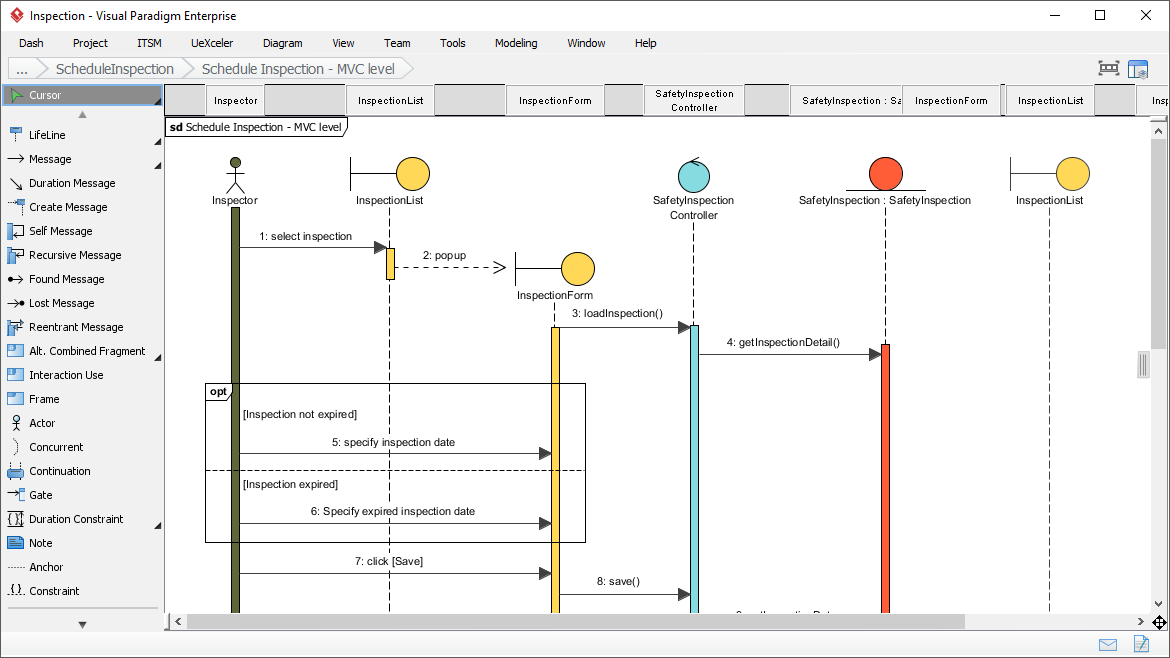
Welcome to this comprehensive tutorial on Sequence Diagrams, a cornerstone of the Unified Modeling Language (UML). In this guide, we will dissect a complex, real-world system interaction—the “Schedule Inspection” process—to understand how software components collaborate to execute a specific use case. We will analyze the architecture shown in the Visual Paradigm interface, breaking down the roles of actors, controllers, and boundary objects.
Understanding the Core Concepts
A Sequence Diagram is a dynamic view of a system. Unlike a Class Diagram, which shows static structure, a Sequence Diagram illustrates how objects interact over time. It answers the question: “What happens when a user tries to schedule an inspection?”
The diagram is built upon three fundamental pillars:
- Lifelines: These are the vertical dashed lines representing the participants in the interaction. In our example, these include the Inspector (Actor), InspectionList (Boundary), InspectionForm (Boundary), and the SafetyInspectionController (Controller).
- Messages: The horizontal arrows connecting lifelines. They represent the flow of data or control. You will see different arrow types: solid lines for synchronous calls (wait for response) and dashed lines for return messages.
- Activation Bars: The narrow rectangles on the lifelines (e.g., on InspectionList or SafetyInspectionController). These indicate the period during which an object is performing an action or waiting for a response.
Architecture Pattern: MVC in Action
By observing the lifelines in the diagram, we can identify the classic Model-View-Controller (MVC) architectural pattern often used in enterprise applications:
- View (Boundary Objects): InspectionList and InspectionForm handle the user interface. They do not contain business logic; they simply gather input and display data.
- Controller: The SafetyInspectionController acts as the brain. It receives requests from the View, processes the logic, and coordinates with the Model (not explicitly shown, but implied by the controller’s actions).
- Actor: The Inspector represents the human user initiating the workflow.
Step-by-Step Interaction Analysis
Let’s trace the lifecycle of the “Schedule Inspection” scenario shown in the diagram:
Phase 1: Initialization and Navigation
The sequence begins with the Inspector interacting with the InspectionList. The inspector selects an item to inspect (Message 1: select inspection). This triggers a popup menu (Message 2: popup) which allows the user to select the “Schedule Inspection” option.
Phase 2: Screen Transition and Data Loading
Once the option is selected, the InspectionList delegates the task to the InspectionForm (Message 3: loadInspection()). The InspectionForm then communicates with the SafetyInspectionController (Message 4: getInspectionDetail()) to retrieve the necessary data from the backend system.
Phase 3: Conditional Logic (The opt Frame)
One of the most powerful features of sequence diagrams is the ability to show conditional logic. In the image, we see a box labeled opt (Optional Fragment) with a header [Inspection not expired]. This indicates that the steps inside the box only happen if the inspection is valid.
- Condition 1: Not Expired (Message 5): If valid, the form asks the user to
specify inspection date. - Condition 2: Expired (Message 6): If the inspection has expired (indicated by the separator line below the first condition), the form asks the user to
Specify expired inspection date.
This structure elegantly handles branching logic without cluttering the diagram with separate diagrams for every scenario.
Phase 4: Committing the Data
Once the date is specified, the inspector clicks the [Save] button (Message 7). The InspectionForm sends a final command to the SafetyInspectionController to save() the changes (Message 8), completing the transaction.
Tooling: Visual Paradigm
To design and implement diagrams as complex as the one analyzed above, you need a robust modeling environment. Visual Paradigm stands out as the premier solution for professional UML modeling.
Why Visual Paradigm?
- Versatility and Compatibility: Visual Paradigm supports the full spectrum of UML 2.0 diagrams, ensuring that your Sequence Diagrams, Use Case Diagrams, and Class Diagrams remain consistent across different operating systems (Windows, Linux, Mac).
- Intuitive Design Experience: With its drag-and-drop interface, creating complex interactions like the one shown is seamless. You can easily add messages, create lifelines, and use alignment tools to keep your diagrams professional.
- Seamless Integration: Visual Paradigm allows you to link your Sequence Diagrams to Use Cases and Class Diagrams. This ensures that if you change a class attribute, the diagram updates to reflect that change.
- Code Engineering: You can reverse engineer Java source code directly into Sequence Diagrams, allowing you to document legacy systems instantly.
- Team Collaboration: With features like online publishing, versioning, and visual comparison, Visual Paradigm is built for teams working together on complex software architecture.
Ready to elevate your modeling game? Don’t let complex tools hinder your creativity. Visual Paradigm simplifies the design process, making it a breeze for individuals and teams alike. Get started today and experience the power of seamless UML modeling!

 English
 Arabic
 Chinese (Simplified)
 Dutch
Dutch French
 German
 Italian
 Japanese
 Korean
 Portuguese
 Russian
 Spanish