


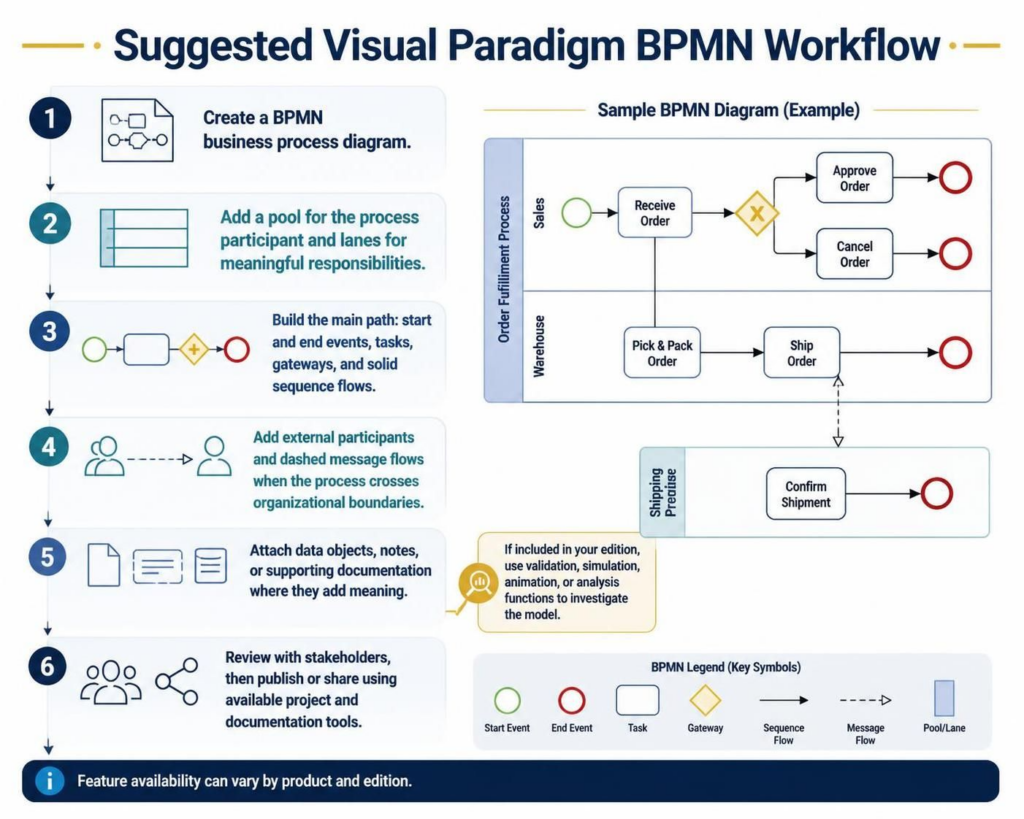
In the world of business process management, clarity is currency. Visual Paradigm has revolutionized how organizations translate abstract concepts into actionable blueprints by integrating AI-assisted modeling. This tutorial breaks down the architecture of the BPMN workflow, guiding you from a simple text description to a fully validated, enterprise-ready diagram.
1. The AI Advantage: From Text to Model
Traditionally, creating a Business Process Model and Notation (BPMN) diagram required manual dragging and dropping of shapes. Today, Visual Paradigm leverages AI-supported workflows to automate this initial phase.
If you have a written process description—such as a Standard Operating Procedure (SOP) or a requirements document—you can input this text directly into the AI engine. The system will parse the text to infer:
- Roles and Responsibilities: Identifying who performs which action.
- Decisions and Conditions: Spotting “if/then” logic to create gateways.
- Exception Paths: Detecting error handling or alternative flows.
2. The Six-Step Modeling Architecture
Whether you are building from scratch or refining an AI draft, the core architecture of a BPMN diagram follows a logical progression. Here is how to structure your workflow effectively.
Step 1: Initialize the Canvas
Begin by creating a blank BPMN business process diagram. This is your canvas. It provides the sandbox where you will define the scope of the process. Ensure your canvas is set to the correct BPMN version (typically 2.0) to ensure compatibility with industry standards.
Step 2: Define Structure (Pools and Lanes)
Before adding tasks, you must define the container. In BPMN, a Pool represents a major participant (like a company or a specific department), while Lanes divide the pool to show specific responsibilities.
Best Practice: Do not create too many lanes. A good rule of thumb is to limit the number of lanes to the number of distinct roles that directly influence the flow of the specific process being modeled.
Step 3: Build the Main Path (The Happy Path)
Once the structure is set, build the “Happy Path”—the ideal sequence of events where everything goes according to plan. This consists of:
- Start Event: The trigger (e.g., “Receive Order”).
- Tasks: The actual work performed (e.g., “Pick & Pack Order”).
- Gateways: Decision points where the path might split (e.g., “Approve” vs. “Cancel”).
- End Event: The successful conclusion of the process.
Step 4: Manage External Participants
Real-world processes rarely happen in a vacuum. They often cross organizational boundaries. When a process involves an external entity (like a Shipping Provider or a Customer), you must use Message Flows.
In Visual Paradigm, these are represented by dashed lines connecting pools. This visual distinction is crucial: solid lines represent internal flow, while dashed lines represent communication between different participants.
Step 5: Enrich with Data and Metadata
A process diagram is not just about flow; it’s about context. Use Data Objects to represent documents (like “Purchase Order”), and attach Notes or Supporting Documentation to clarify complex logic. This transforms a simple flowchart into a comprehensive technical specification.
3. Validation and Simulation
Once your diagram is built, the workflow moves to validation. Visual Paradigm offers powerful tools to investigate your model before publishing:
- Validation: Checks for syntax errors or logical dead-ends (e.g., a task that is never reached).
- Simulation: Allows you to “run” the process to see how long it takes or where bottlenecks occur.
- Animation: Provides a visual walkthrough of the process flow.
4. Stakeholder Review and Publishing
The final step is collaboration. Review the diagram with stakeholders to ensure it aligns with business reality. Once confirmed, publish the diagram using the available project and documentation tools. This ensures that the diagram remains a “single source of truth” accessible to the entire organization.
Summary of Symbols
To ensure your diagrams are universally understood, always adhere to the standard BPMN legend:
- Circle (Green/Red): Start or End Events.
- Rectangle: Tasks.
- Diamond: Gateways (Decision points).
- Arrow (Solid): Sequence Flow.
- Arrow (Dashed): Message Flow.
By following this structured approach, you transform complex business requirements into clear, executable models that drive efficiency and clarity across your enterprise.

 English
 Arabic
 Chinese (Simplified)
 Dutch
 French
 German
 Italian
 Japanese
 Korean
 Portuguese
 Russian
 Spanish