


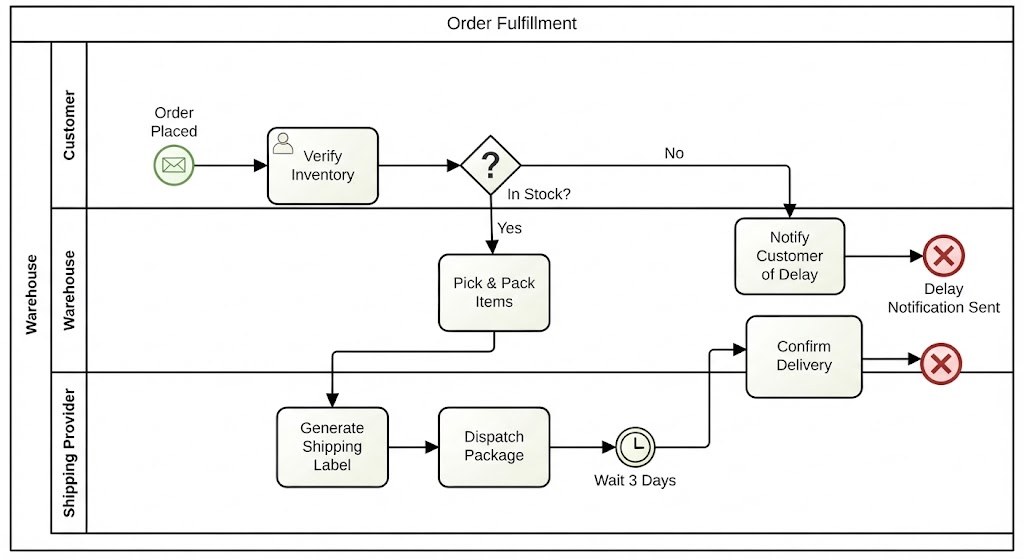
In the realm of business process management, clarity is king. When modeling real-world scenarios like Online Order Fulfillment, the complexity often lies not in the individual steps, but in understanding who performs each action and how decisions are made. The diagram provided illustrates a classic business process scenario using BPMN 2.0 standards, leveraging swimlanes to distinguish between the Customer, Warehouse, and Shipping Provider.
This tutorial breaks down the architecture of this system, explaining the specific modeling elements—from Start Events to Gateways—and how they combine to create a robust, automated logic flow.
1. The Architecture of Swimlanes
The diagram is organized into a Pool named “Order Fulfillment.” Within this pool, we see three distinct Lanes:
- Customer: Represents the initiator of the process and the recipient of notifications.
- Warehouse: Responsible for inventory management, picking, packing, and final delivery confirmation.
- Shipping Provider: Handles the logistics, including label generation and dispatching.
Key Takeaway: Swimlanes are crucial for defining “Process Ownership.” Without them, a process diagram is just a flowchart; with them, it becomes an organizational blueprint that clarifies accountability.
2. The Process Lifecycle: Step-by-Step Analysis
Phase 1: Initiation and Verification
The process begins in the Customer lane with an Intermediate Catch Event (the green circle with an envelope icon), labeled “Order Placed.” This signifies that the process starts upon receiving an external signal or message.
Following the arrow, the flow moves to the Warehouse lane where the first actual work task occurs: “Verify Inventory.” This task checks if the requested items are available. This transition highlights the handover of responsibility from the customer’s action to the warehouse’s internal check.
Phase 2: The Decision Logic (Exclusive Gateway)
After inventory verification, the flow encounters a Gateway (the diamond shape) labeled “In Stock?”. This is a logical decision point that splits the path based on a condition.
- The “Yes” Path: If items are in stock, the flow proceeds to “Pick & Pack Items.” This action is critical as it transitions the item from a static inventory to a dynamic shipping package.
- The “No” Path: If items are not in stock, the flow diverts to “Notify Customer of Delay.” This path terminates with an End Event (the red circle with an ‘X’), indicating an abnormal termination or a specific exception state.
Phase 3: Logistics and Handoffs
Once items are packed, the responsibility shifts to the Shipping Provider. The process flow moves through two distinct tasks:
- Generate Shipping Label: The system creates the necessary documentation for transport.
- Dispatch Package: The physical item is handed off to the carrier.
Phase 4: Time-Based Events
Following dispatch, the diagram introduces a time constraint. An Intermediate Catch Event (the clock icon) labeled “Wait 3 Days” pauses the process. This represents a timer event, a common requirement in fulfillment to ensure packages arrive within a specific window before triggering the next step.
After the timer expires, the flow returns to the Warehouse for “Confirm Delivery.” This task validates that the customer has received the order, closing the loop.
3. Advanced Modeling Concepts
Understanding the visual syntax of the diagram is essential for creating accurate models. Let’s look at the specific elements used:
- Sequence Flow: The solid black lines with arrowheads dictate the order of execution. They represent the direct flow of control.
- Intermediate Event (Message): The green envelope icon at the start is a “Message Start Event.” It implies the process is triggered by an external message (the order).
- Intermediate Event (Timer): The clock icon represents a “Timer Start Event” or “Timer Intermediate Catch Event,” used to model time delays.
- End Event (Error/Cancel): The red circle with an ‘X’ at the end of the “Notify Customer of Delay” path is an “Error End Event.” It signifies that this specific process instance has failed or been cancelled due to the lack of stock.
When visualizing this in a tool like Visual Paradigm or Mermaid, the logic is rendered as a directed graph where nodes represent these events and edges represent the sequence flow. The swimlanes act as containers that group these nodes by their responsible actor.
Conclusion
This “Order Fulfillment” diagram is a perfect example of how process modeling bridges the gap between business requirements and technical implementation. By separating concerns into swimlanes and using gateways to handle logic, we create a map that is readable by humans and actionable for automated systems. Whether you are planning a manual workflow or coding a BPM engine, mastering these visual elements is the first step toward operational excellence.

 English
 Arabic
 Chinese (Simplified)
 Dutch
 French
 German
 Italian
 Japanese
 Korean
 Portuguese
 Russian
 Spanish