


Introduction
In the complex world of software architecture and business analysis, clarity is currency. When stakeholders, developers, and designers look at a system, they often see different things: code modules, user interfaces, or database schemas. But what binds these elements together is data. How does information enter the system? How is it transformed? Where does it rest? And how does it leave?
Data Flow Diagrams (DFDs) answer these questions by stripping away the noise of control logic, timing, and implementation details. They focus purely on the movement and transformation of data. However, a common pitfall in creating DFDs is “analysis paralysis”—trying to map every single detail in one massive, unreadable diagram.
This guide introduces a refined perspective on DFDs: Top-Down Decomposition as a Narrative Tool. Instead of viewing decomposition merely as a technical requirement, we view it as a storytelling technique. We start with the “headline” (the Context Diagram), move to the “chapter summaries” (Level 0), and then dive into the “paragraphs” (Level 1+) only where necessary.
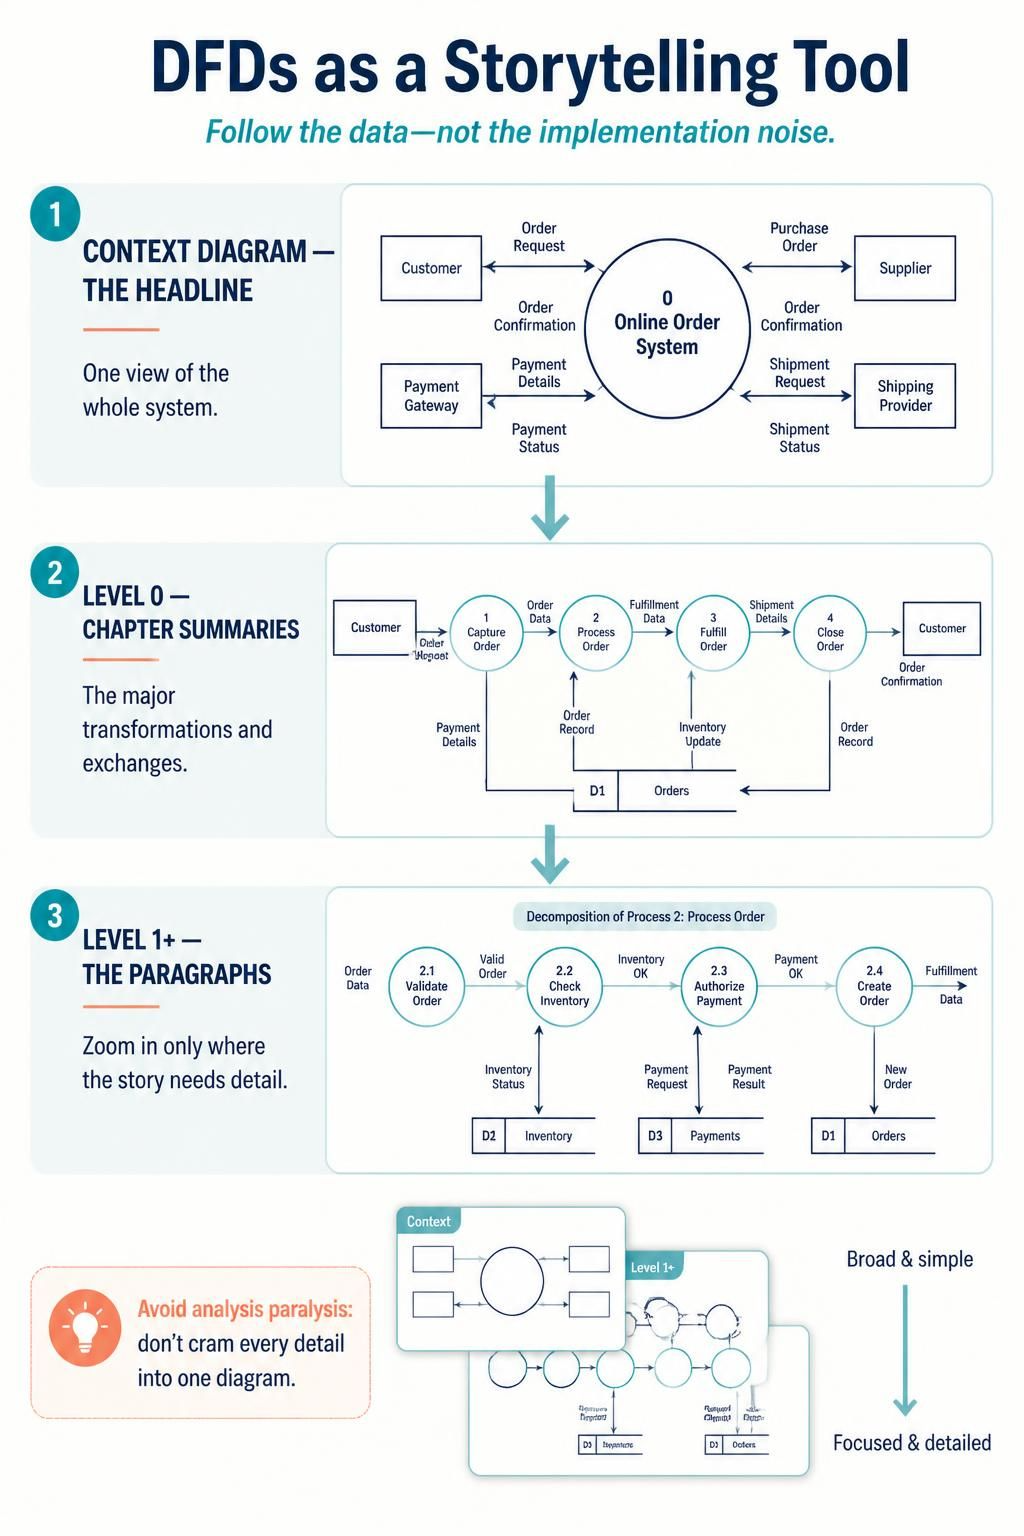
Furthermore, we will explore how modern tooling, specifically Visual Paradigm combined with AI assistance, can accelerate this process, ensuring accuracy, balance, and professional presentation without the manual drudgery of traditional diagramming.
1. The Core Philosophy: Data Over Control
Before drawing a single box, it is crucial to internalize what a DFD is not. It is not a flowchart. It does not care about if-else statements, loops, or the order of operations unless that order affects data transformation.
Key Concepts Reframed
-
The System as a Black Box: Initially, the system is opaque. We only care about its interface with the outside world.
-
Transformation is Key: A process must change data. If data passes through unchanged, it’s not a process; it’s just a flow.
-
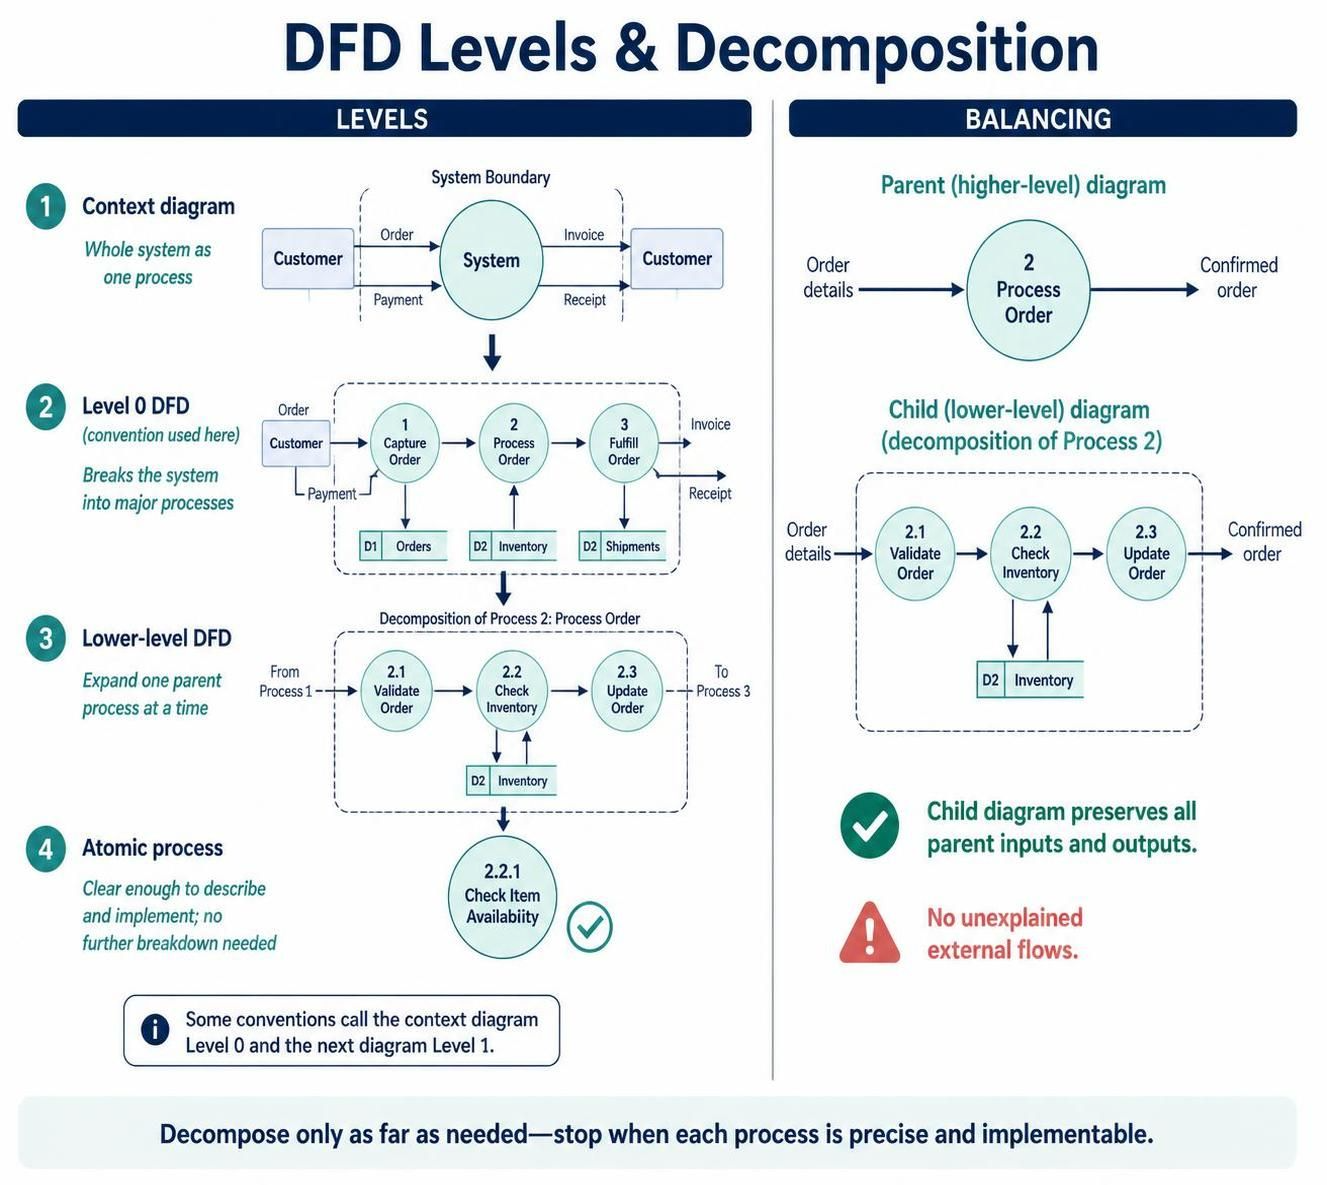
Balancing as Integrity: Think of balancing like a financial audit. The money (data) going into a department (parent process) must equal the money accounted for in its sub-departments (child processes). You cannot create or destroy data out of thin air.
The Four Pillars of DFD
-
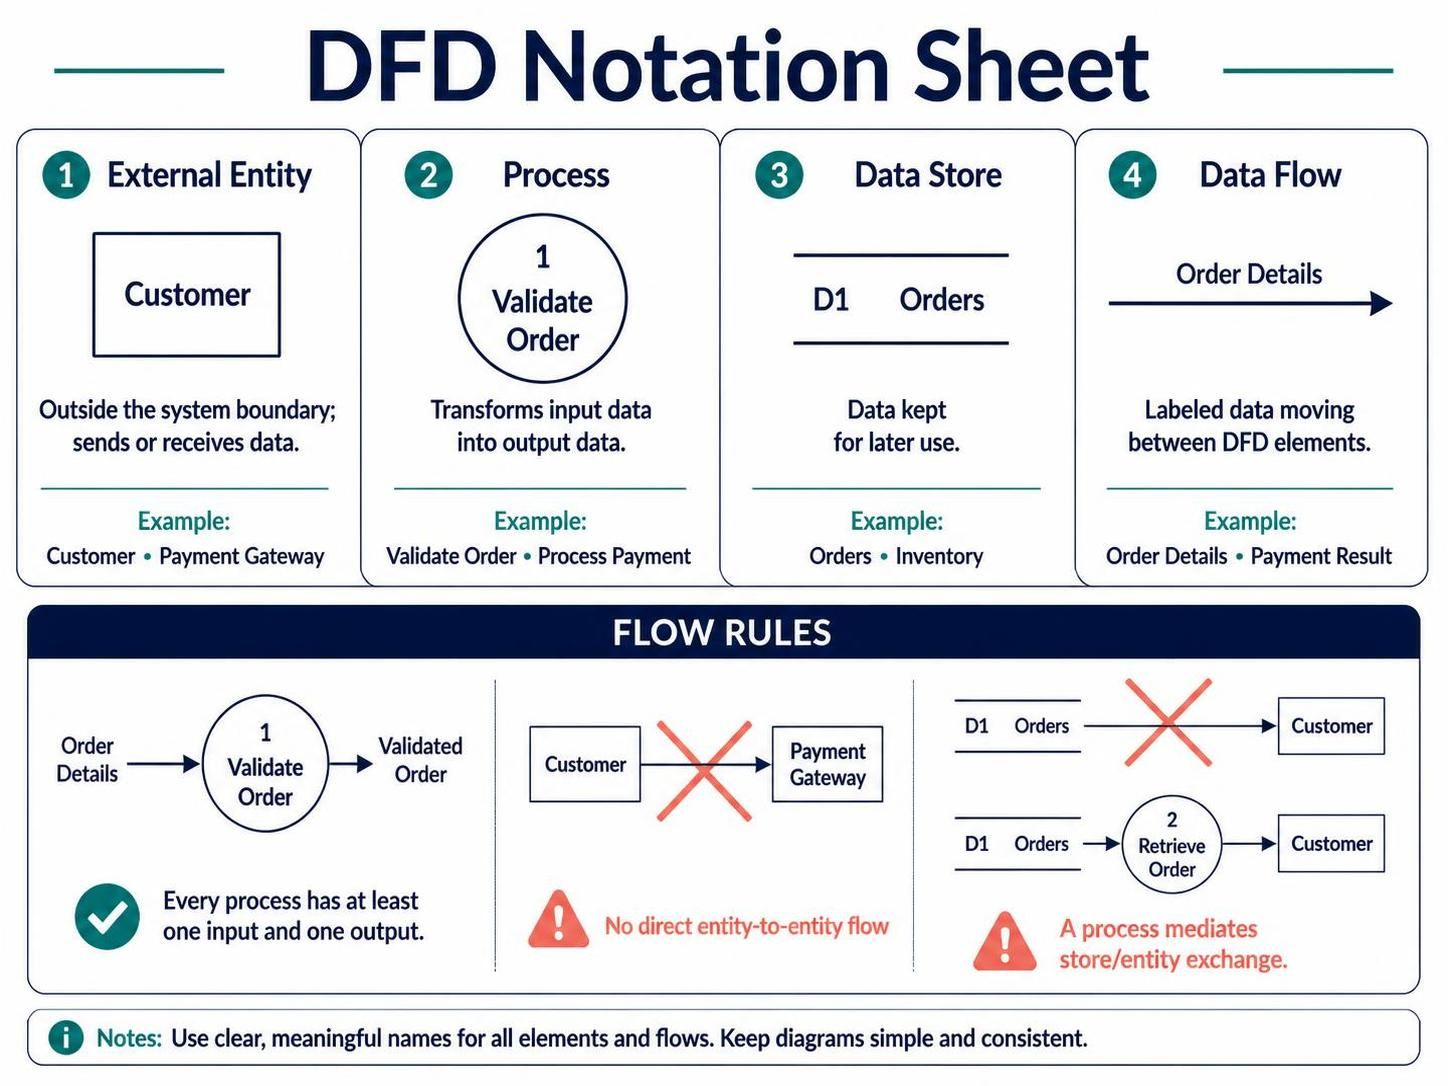
External Entity: The actors. Who triggers the system? Who receives the output? (e.g., Customer, Payment Gateway).
-
Process: The verbs. What happens to the data? (e.g., Validate, Calculate, Transform). Rule: Must have at least one input and one output.
-
Data Store: The nouns at rest. Where is data saved for later use? (e.g., Database tables, files). Rule: Cannot connect directly to an external entity.
-
Data Flow: The arrows. The labeled packets of information moving between the above elements.
2. The Narrative Arc: Top-Down Decomposition
Top-down decomposition is not just about breaking things down; it’s about managing cognitive load. We guide the reader from the general to the specific.
Level 0: The Context Diagram (The Headline)
This is the highest level of abstraction. The entire system is represented as a single process bubble. This defines the system boundary. Anything outside is an external entity; anything inside is hidden.
Case Study Application:
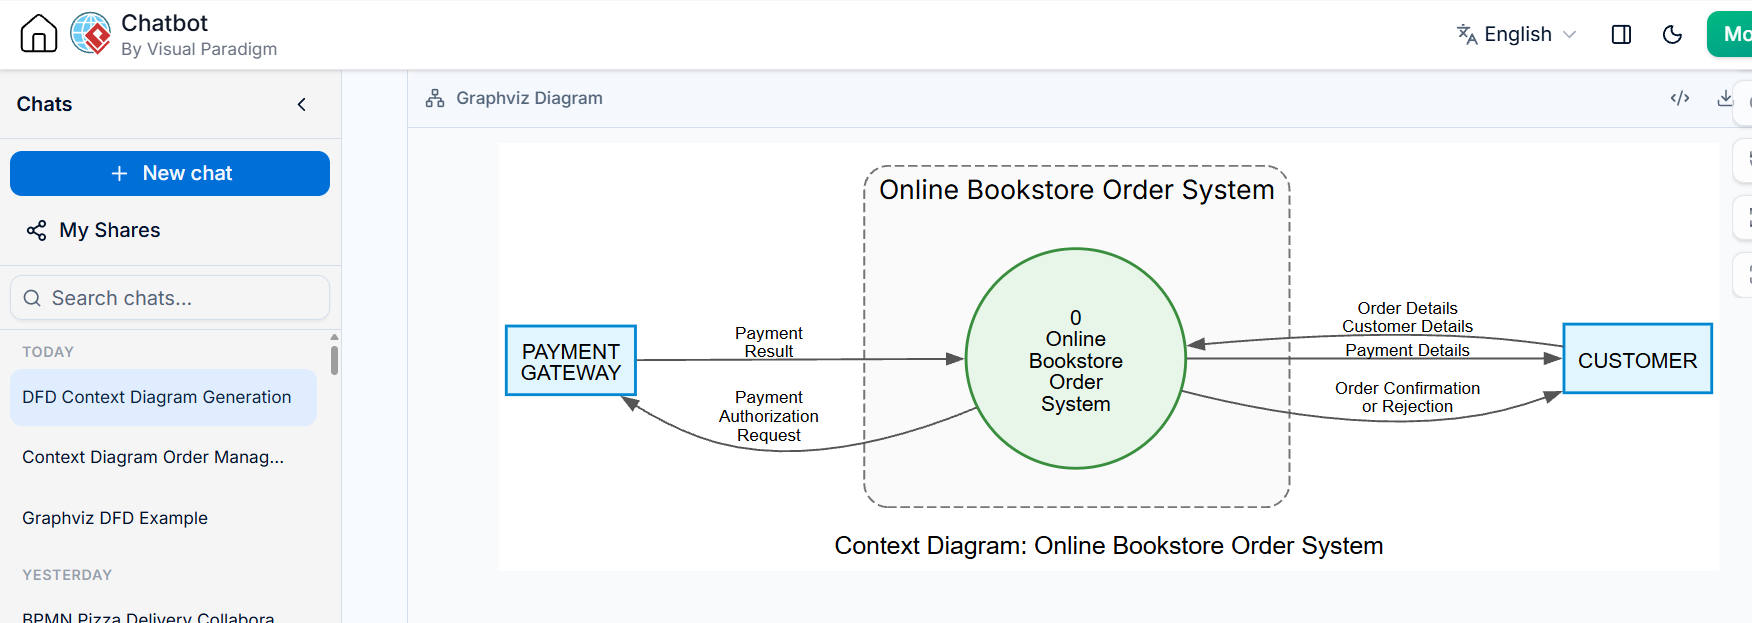
For our Online Bookstore Order Processing System, the context diagram looks like this:
-
Process 0: Online Bookstore Order System
-
Inputs: Order Details, Customer Details, Payment Details (from Customer); Payment Result (from Payment Gateway).
-
Outputs: Order Confirmation/Rejection (to Customer); Payment Authorization Request (to Payment Gateway).
Why this matters: Stakeholders can immediately agree on scope. If “Shipping” isn’t connected here, it’s out of scope. Simple.
Level 1: The Major Functions (The Chapter Summaries)
Now we crack open Process 0. We identify the major functional areas. For the bookstore, we identify four key stages:
-
1.0 Capture Order
-
2.0 Validate Order and Check Stock
-
3.0 Authorize Payment and Record Order
-
4.0 Notify Customer
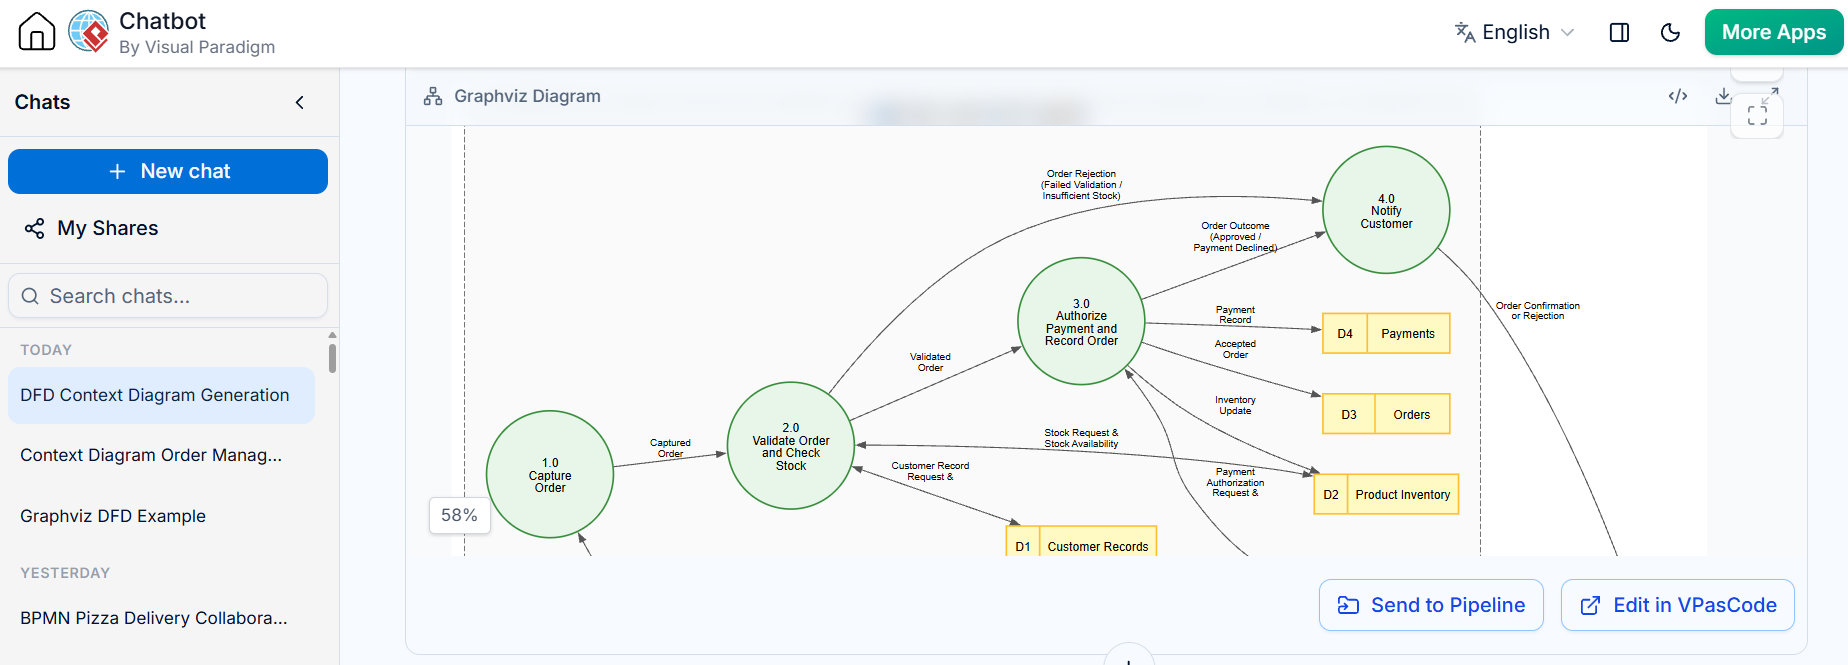
Notice the introduction of Data Stores (D1–D4). These are now visible because we are looking inside the system.
-
D1 Customer Records
-
D2 Product Inventory
-
D3 Orders
-
D4 Payments
Key interactions include checking stock against D2 and retrieving customer info from D1. The flow moves logically from capture → validation → payment → notification.
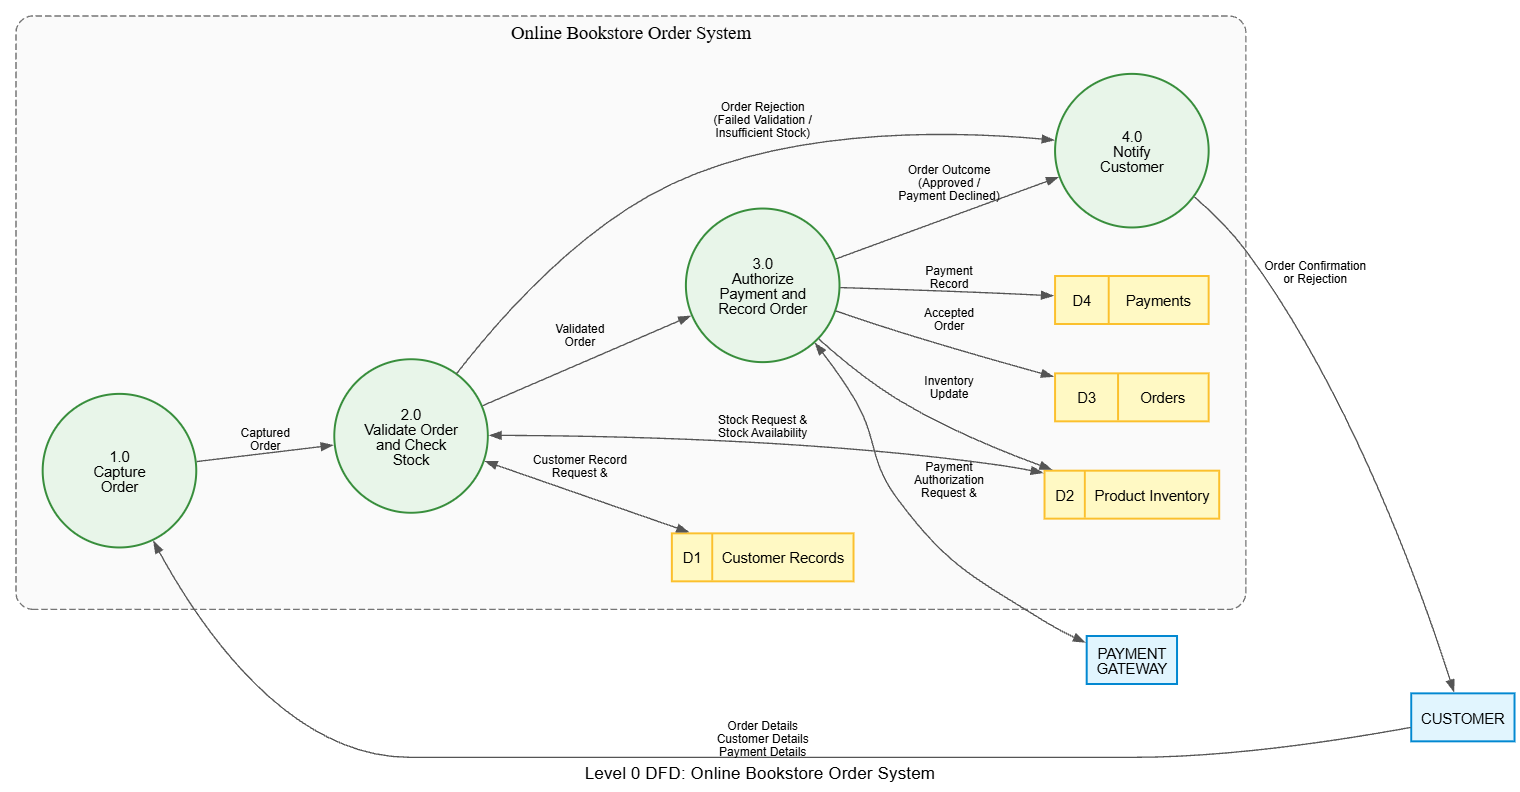
Note on Error Handling: The diagram implicitly handles failures. If validation fails in 2.0, the flow still leads to 4.0 Notify Customer, but with a rejection message rather than a confirmation.
Level 2: Drilling Down (The Paragraphs)
We don’t need to decompose every process. We only decompose those that are complex or ambiguous. In this case, 2.0 Validate Order and 3.0 Authorize Payment are the most critical risk areas.
Decomposing Process 2.0: Validate Order and Check Stock
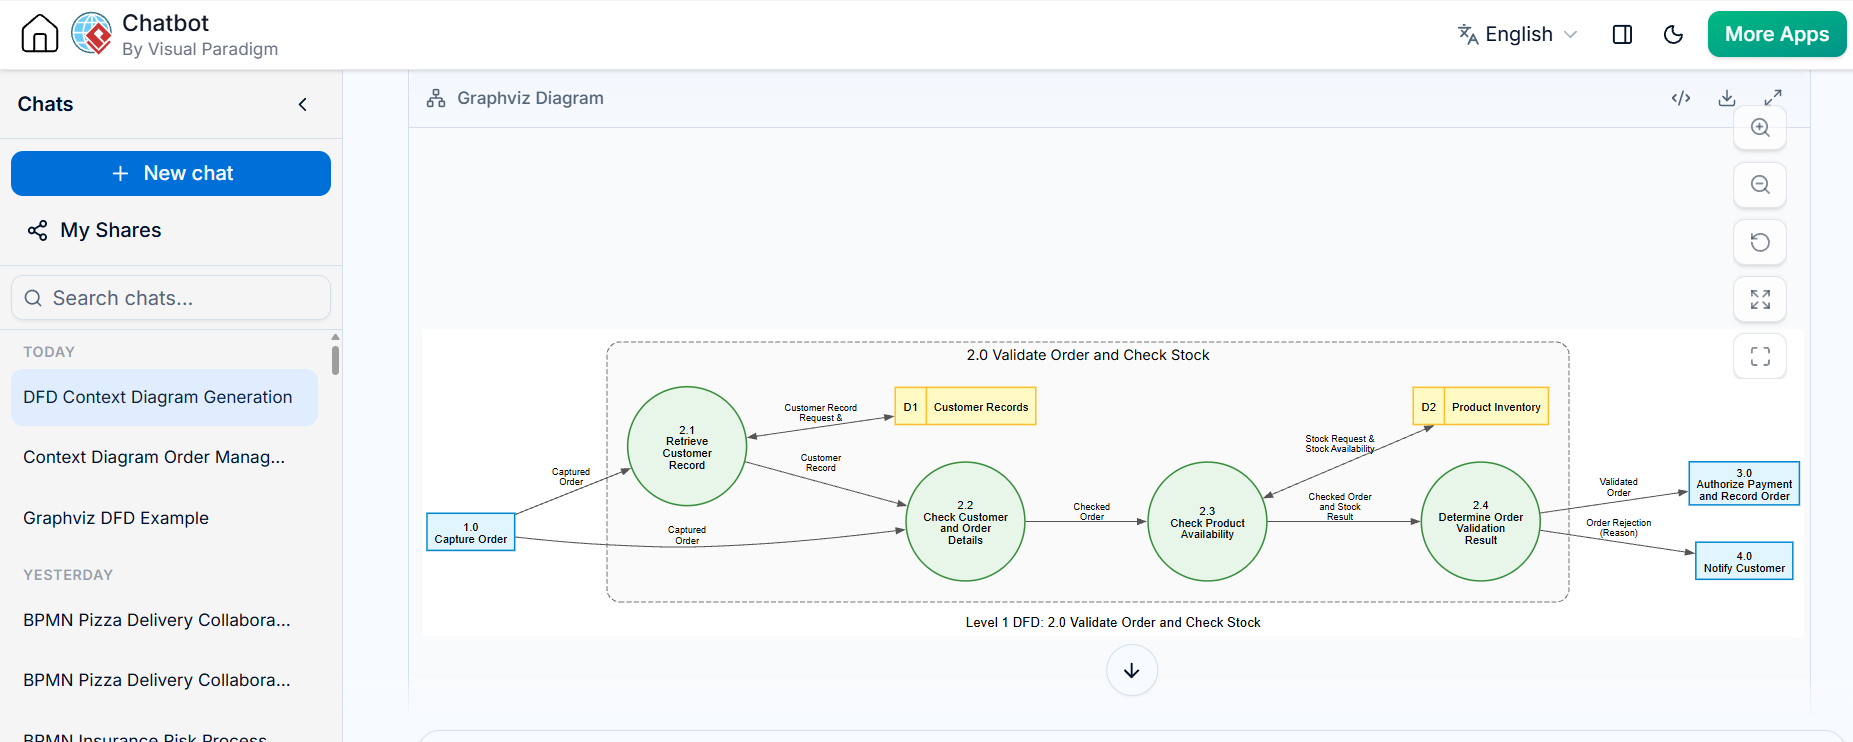
Here we see the atomic steps:
-
2.1 Retrieve Customer Record: Fetches data from D1.
-
2.2 Check Details: Ensures data integrity.
-
2.3 Check Availability: Queries D2.
-
2.4 Determine Result: Decides if the order is valid or rejected.
Balancing Check: The parent process (2.0) took in a “Captured Order” and outputted a “Validated Order” or “Rejection.” The child diagram does exactly this, just showing the internal mechanics. No new external inputs were added.
Decomposing Process 3.0: Authorize Payment and Record Order
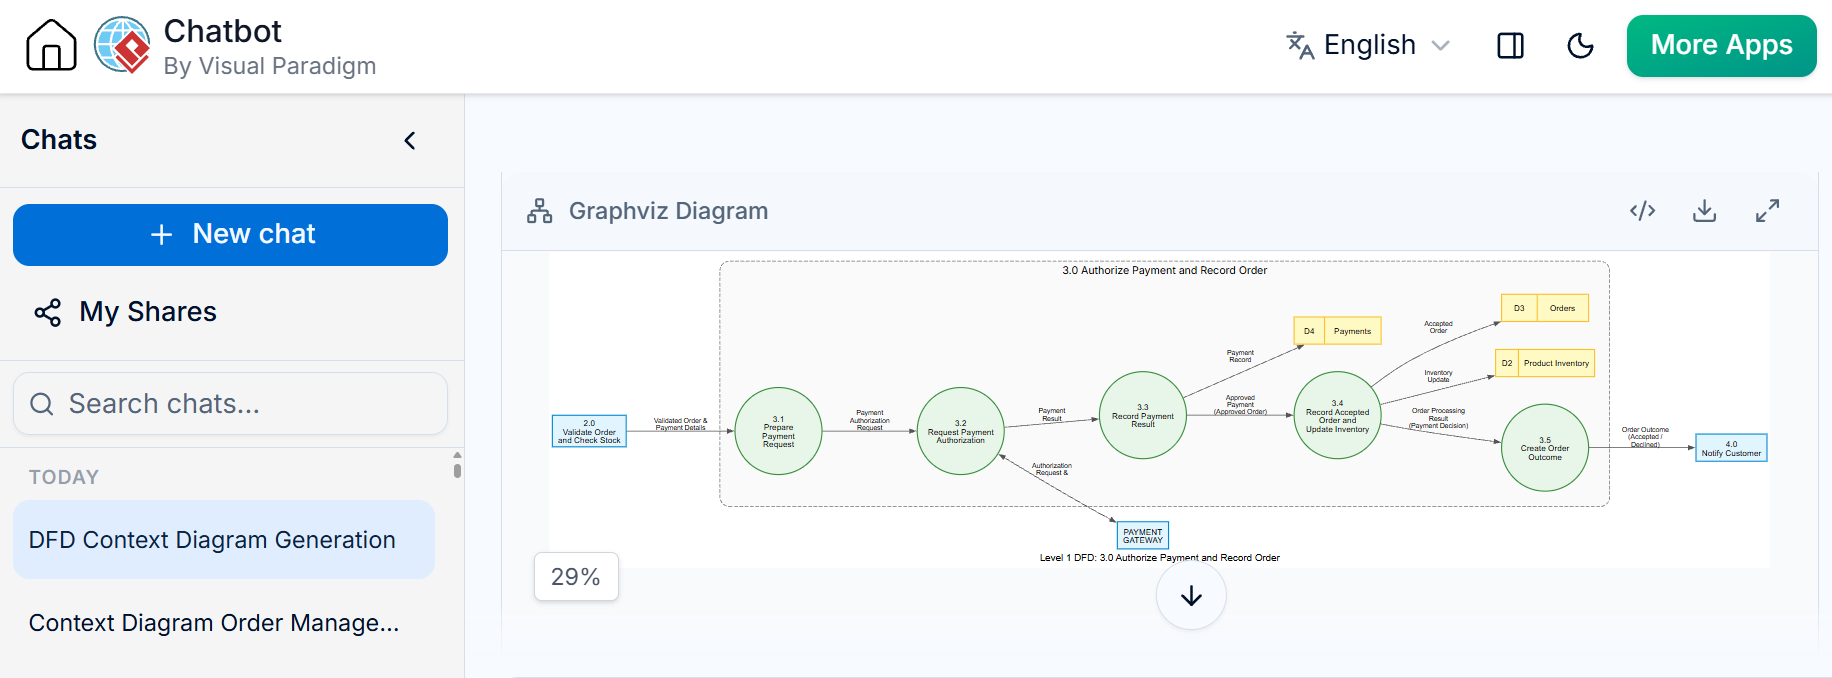
This process handles the financial transaction:
-
3.1 Prepare Request: Formats data for the gateway.
-
3.2 Request Authorization: Communicates with the external Payment Gateway.
-
3.3 Record Result: Saves the transaction log in D4.
-
3.4 Update Inventory & Order: If successful, updates D2 and D3.
-
3.5 Create Outcome: Prepares the final status for notification.
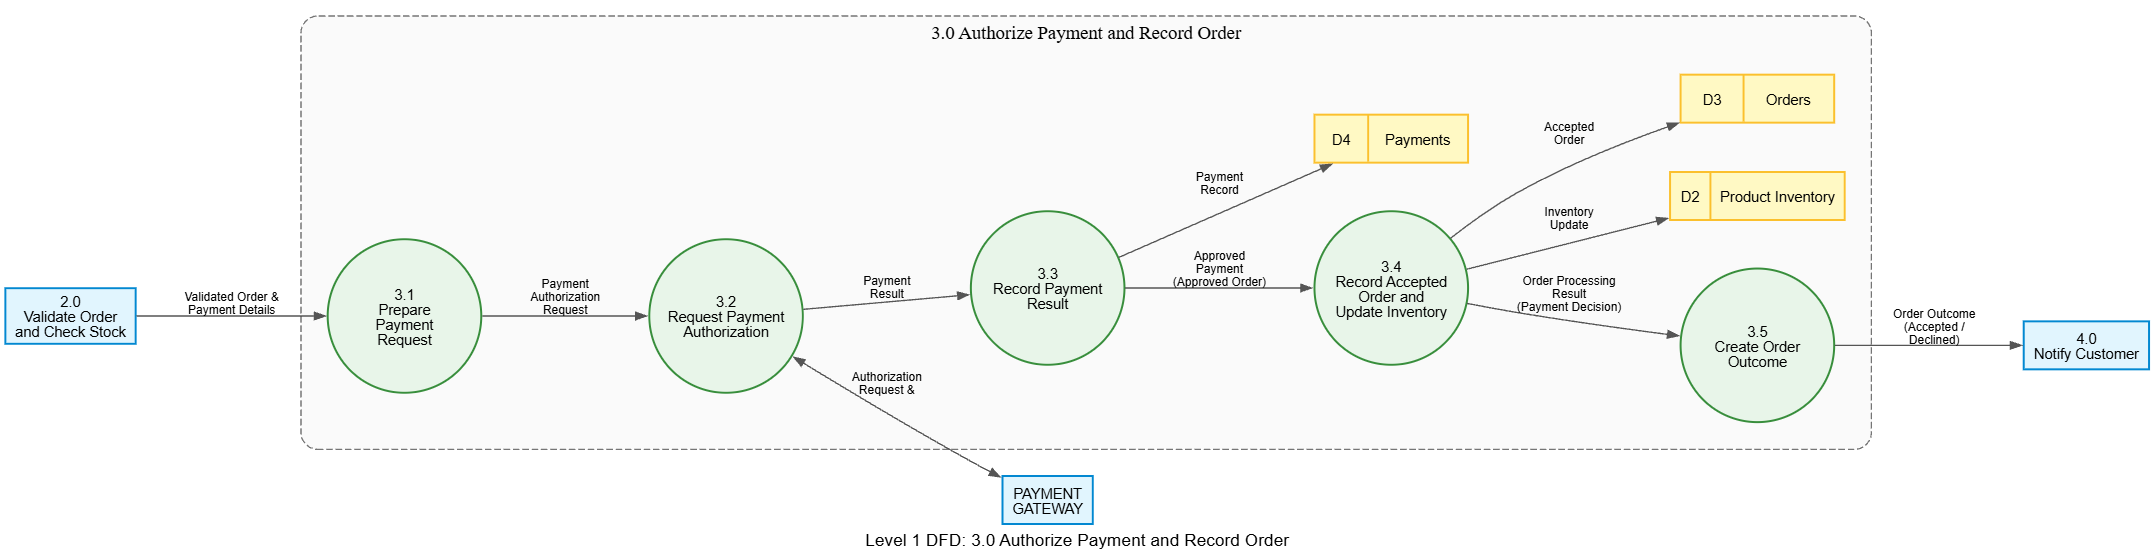
Again, balancing is maintained. The interaction with the Payment Gateway and the updates to D2/D3 are all accounted for within the boundary of the parent process 3.0.
3. Modernizing the Workflow: Visual Paradigm + AI
Creating balanced, hierarchical DFDs manually is error-prone. Modern tools like Visual Paradigm offer robust DFD support, but when combined with AI capabilities, the workflow transforms from drafting to refining.
Why Visual Paradigm?
-
Strict Syntax Enforcement: Prevents invalid connections (e.g., Entity-to-Entity flows).
-
Auto-Balancing Checks: Some advanced versions can flag if child diagrams don’t match parent inputs/outputs.
-
Hierarchy Management: Easily navigate from Context to Level 1 to Level 2 with click-through drilling.
The AI Advantage
Integrating AI into your DFD tooling (either via built-in AI features in modern CASE tools or using LLMs to generate initial text-based descriptions) offers three key benefits:
-
Rapid Prototyping: You can describe the system in natural language (“An online bookstore that checks stock and processes payments”) and have the AI generate a draft list of entities, processes, and stores.
-
Gap Analysis: AI can review your DFD description and ask questions: “You mentioned updating inventory, but where is the data store for Inventory defined?”
-
Label Optimization: AI can suggest clearer, more consistent labels for data flows, reducing ambiguity.
Practical Step: Use AI to generate the textual specification of your DFD first, then import or draw it in Visual Paradigm. This ensures your logic is sound before you worry about the visual layout.
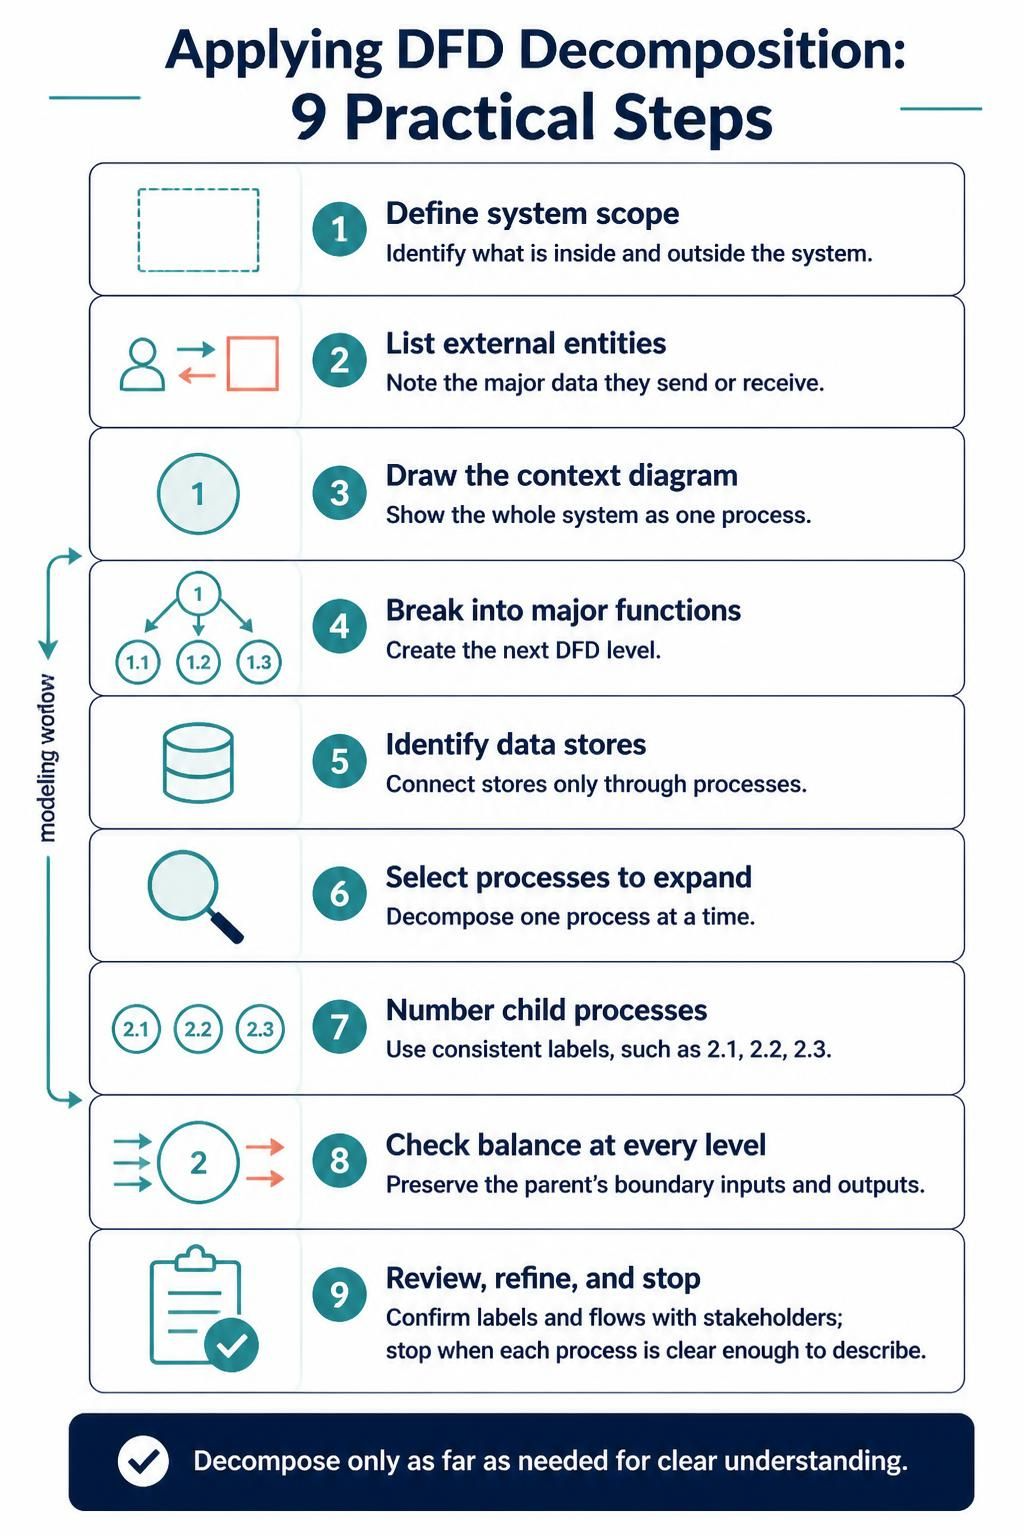
4. Practical Steps for Applying the Technique
-
Define Scope: What is in? What is out? Draw the boundary.
-
Identify Actors: Who interacts with the system? (External Entities).
-
Draw Context Diagram: One big process. Connect the actors.
-
Identify Major Functions: Break the big process into 3–7 high-level processes (Level 0).
-
Add Data Stores: Where does data rest? Connect them to processes.
-
Select Complex Processes: Which processes are unclear? Decompose only those.
-
Decompose & Number: Use consistent numbering (2.1, 2.2…).
-
Balance: Verify inputs/outputs match the parent.
-
Review with Stakeholders: Use the diagrams as conversation starters.
-
Stop: When the process is atomic enough to be coded or understood without further breakdown.
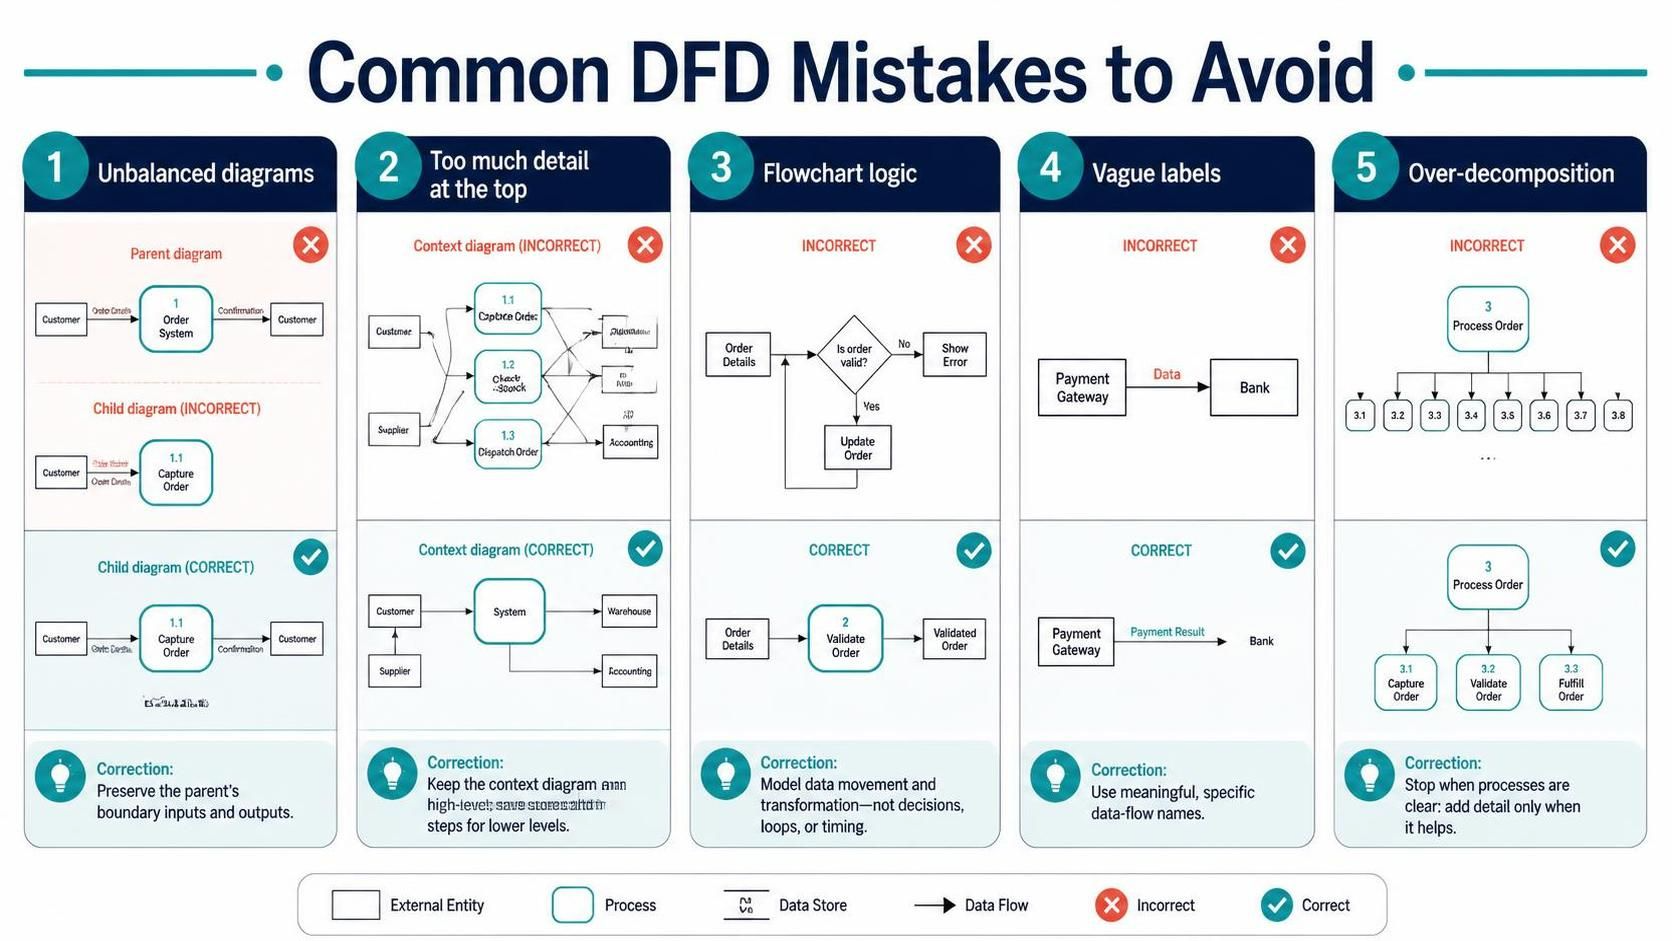
5. Common Mistakes to Avoid
-
The “Spaghetti” Diagram: Trying to put everything on one page. Solution: Use decomposition.
-
Control Flow Confusion: Adding decision diamonds or loops. Solution: Remember, DFDs show data movement, not logic control.
-
Unbalanced Levels: Adding a new data input in a Level 2 diagram that wasn’t present in the Level 1 parent. Solution: Audit boundaries rigorously.
-
Vague Labels: Using “Data” or “Info” as flow labels. Solution: Be specific: “Credit Card Token,” “Stock Quantity.”
-
Over-Decomposition: Breaking a simple “Save Record” process into five sub-steps. Solution: Stop when the process is clear.
Conclusion
Data Flow Diagrams remain one of the most powerful tools for understanding system architecture because they force us to focus on what truly matters: data. By employing top-down decomposition, we transform a potentially overwhelming technical specification into a clear, layered narrative. We start with the big picture, ensuring stakeholder alignment, and then drill down into the mechanics only where necessary.
With the aid of modern tools like Visual Paradigm and the analytical power of AI, creating these diagrams is no longer a tedious chore but a strategic activity. It allows teams to catch logical errors early, ensure system integrity through balancing, and communicate complex ideas with simplicity. Whether you are designing a simple bookstore app or a complex enterprise system, remember: clarity is not just nice to have—it is essential. Start with the context, decompose with purpose, and let the data tell the story.

 English
 Arabic
 Chinese (Simplified)
 Dutch
 French
 German
 Italian
 Japanese
 Korean
 Portuguese
 Russian
 Spanish