


Introduction
In an era where complexity is the norm, clarity is a competitive advantage. Whether you are designing software architecture, optimizing business workflows, or planning a personal project, understanding the sequence of actions and decisions is critical. Flowcharts serve as the universal language for this purpose. They transform abstract processes into concrete, visual maps that teams can understand, analyze, and improve.
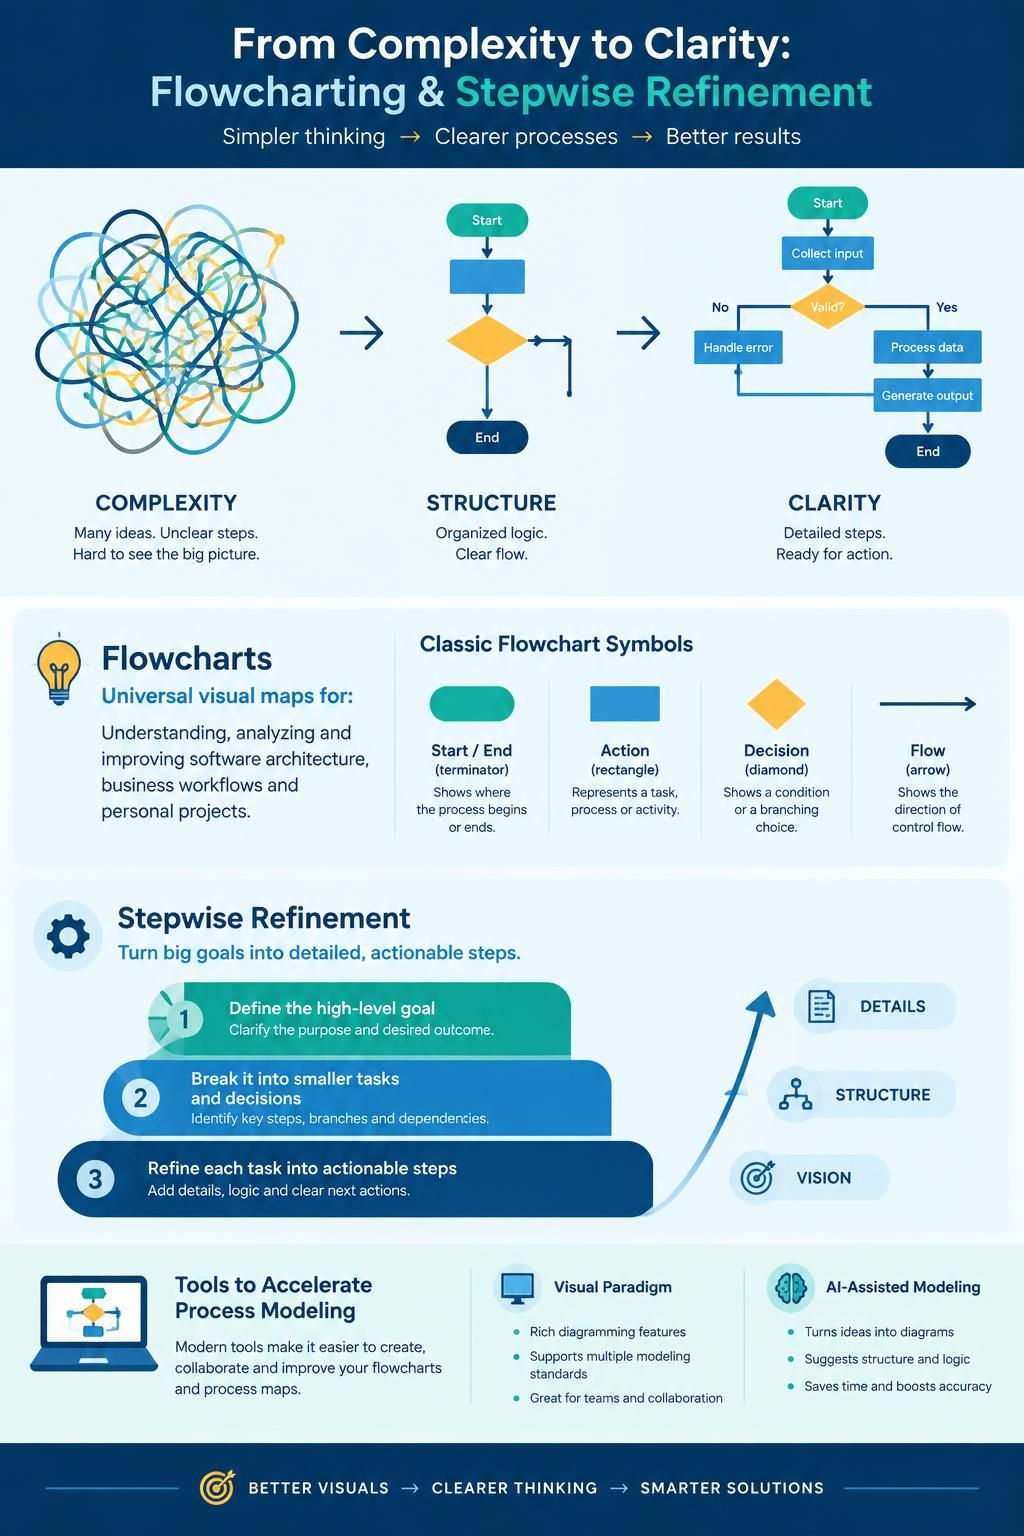
This guide explores the fundamentals of flowcharting, introduces the powerful technique of Stepwise Refinement, and demonstrates how modern tools like Visual Paradigm and its AI-assisted features can accelerate your process modeling efforts. By mastering these concepts, you can bridge the gap between high-level strategy and detailed execution.
Why Use Flowcharts?
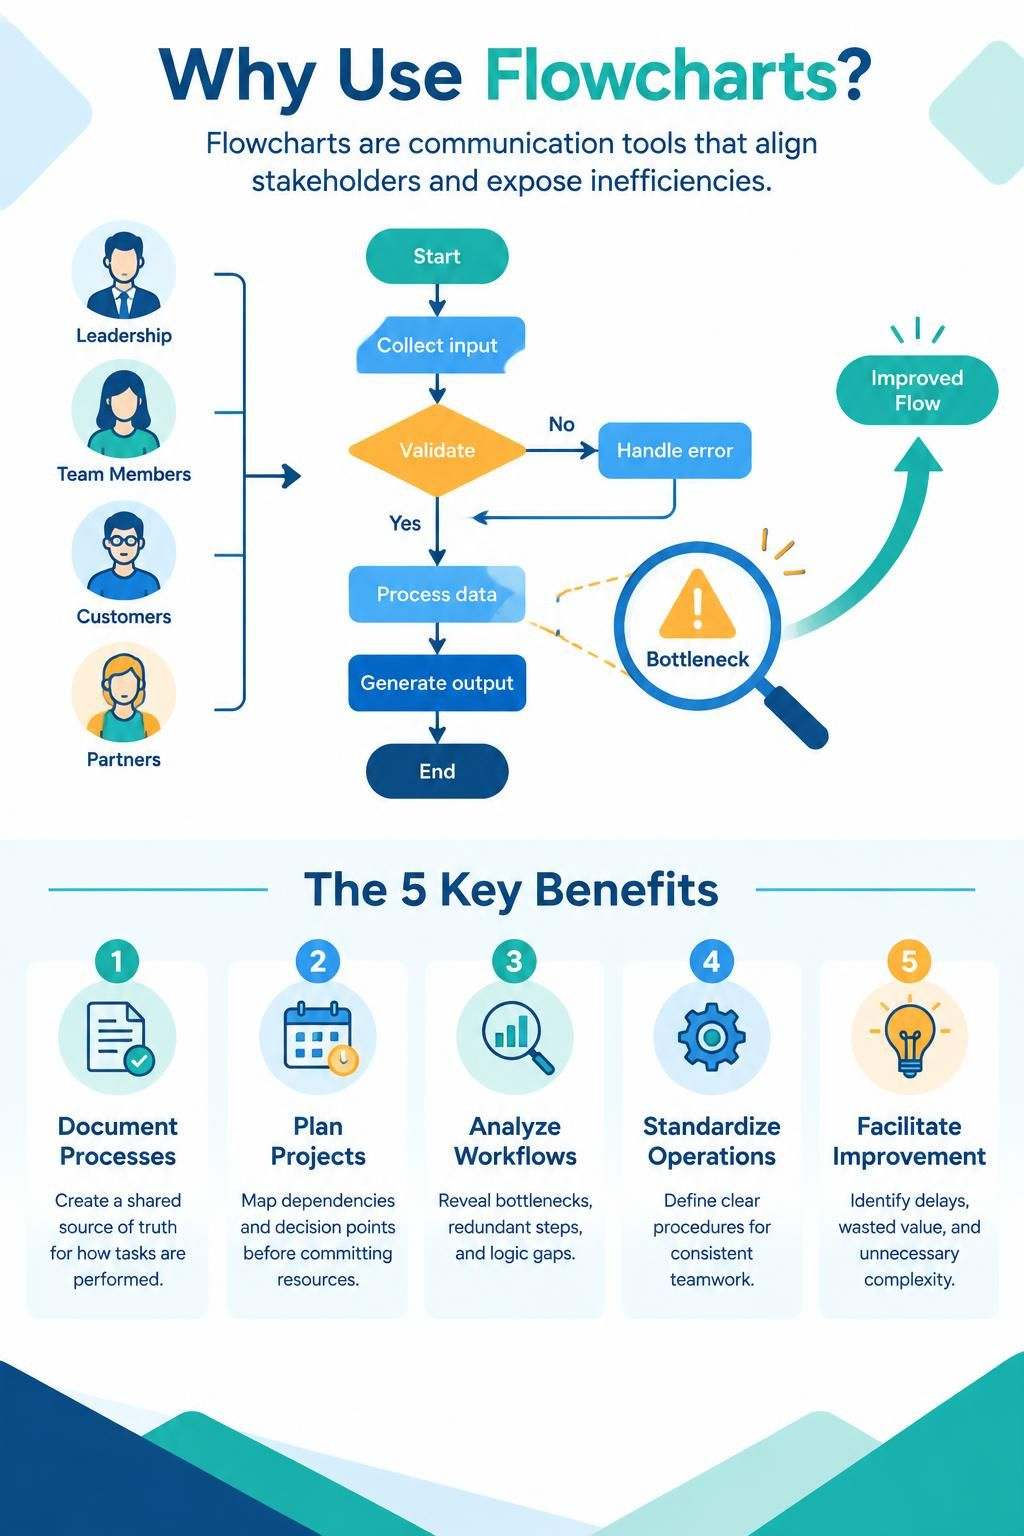
Flowcharts are more than just diagrams; they are communication tools that align stakeholders and reveal hidden inefficiencies. Humans are primarily visual learners, processing images 60,000 times faster than text. Flowcharts leverage this capability to:
-
Document Processes: Create a single source of truth for how tasks are performed.
-
Plan Projects: Map out dependencies and decision points before resources are committed.
-
Analyze Existing Workflows: Identify bottlenecks, redundant steps, or gaps in logic.
-
Standardize Operations: Ensure consistency across teams by defining clear procedures.
-
Facilitate Improvement: Pinpoint areas where value is lost due to delays or unnecessary complexity.
Types of Flowcharts
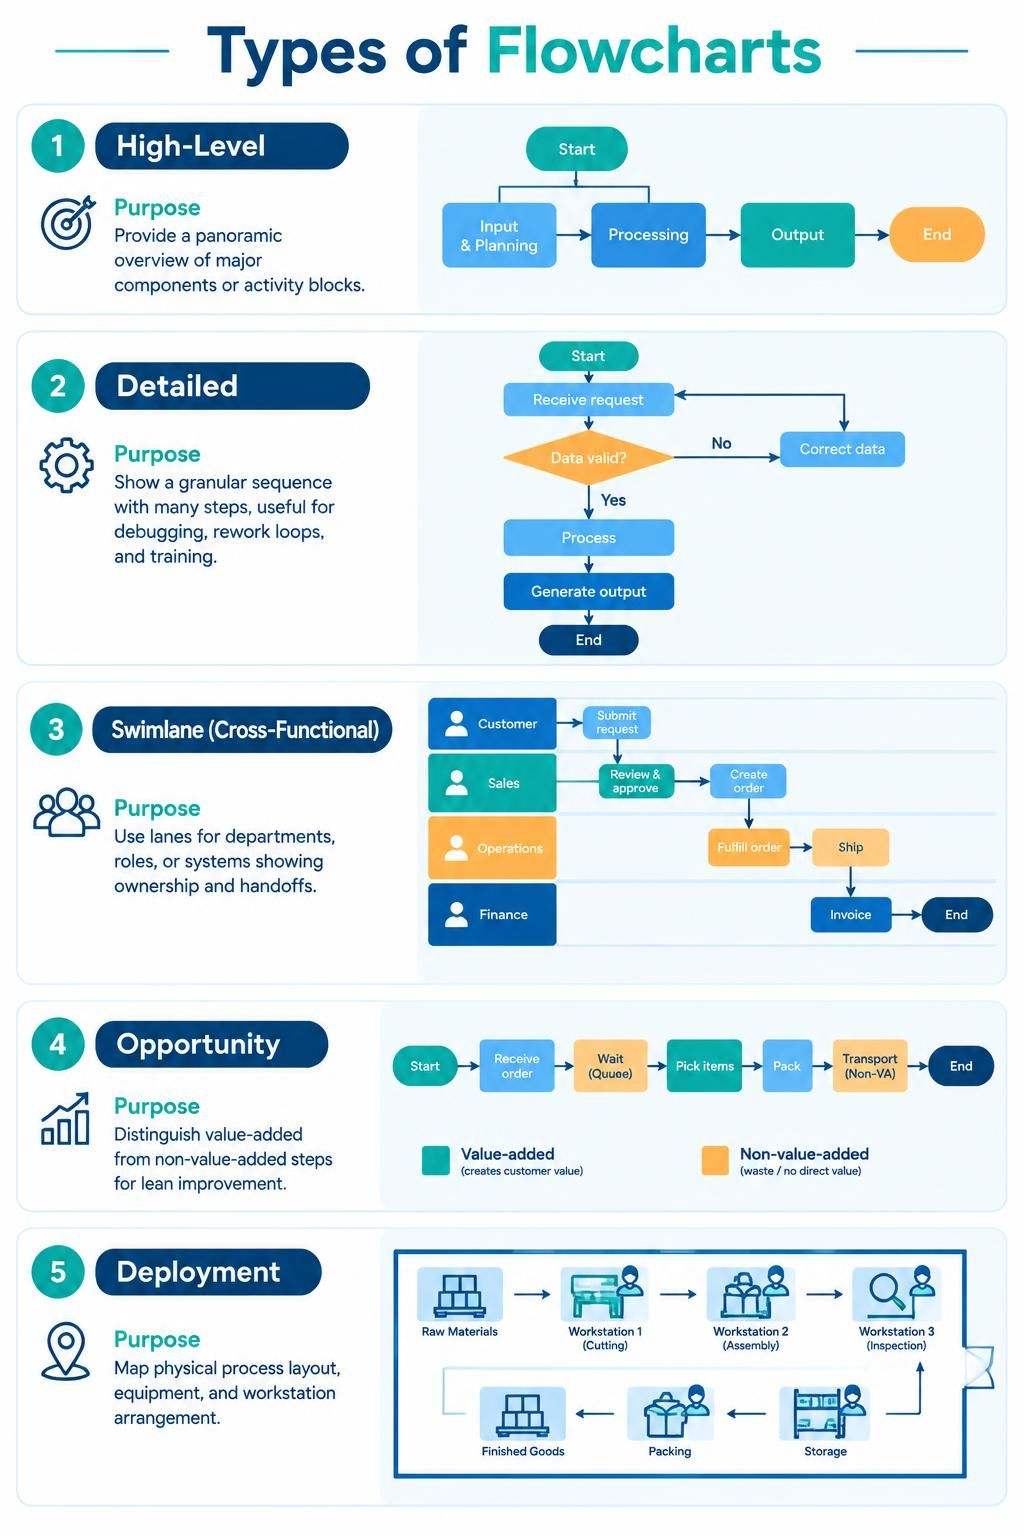
Different scenarios require different levels of abstraction. Choosing the right type ensures your message is received clearly.
-
High-Level Flowcharts: Provide a panoramic view, showing major system components or activity blocks. Ideal for executive summaries or early project phases.
-
Detailed Flowcharts: Offer a granular view with dozens of steps. Useful for debugging, identifying rework loops, or training new employees.
-
Swimlane Flowcharts (Cross-Functional): Divide the process into “lanes” representing different departments, roles, or systems. This clarifies accountability and handoffs.
-
Opportunity Flowcharts: Specifically designed to highlight value-added vs. non-value-added steps, focusing on lean improvement.
-
Deployment Flowcharts: Map the physical layout of a process, optimizing equipment placement and workstation arrangement.
Key Concepts: The Building Blocks
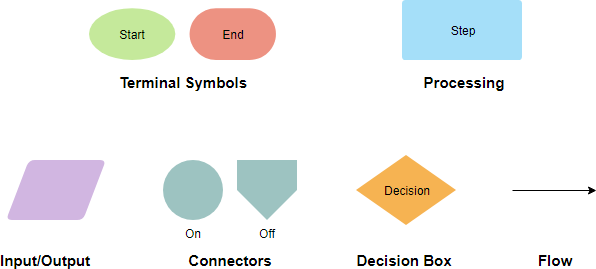
Flowcharts rely on standardized symbols to ensure universal understanding. Misusing symbols can lead to confusion, so adhering to standards is crucial.
Flowchart symbols
-
Terminal Symbols (Ovals): Mark the start and end points of a process.
-
Input/Output Symbols (Parallelograms): Represent data entering or leaving the system.
-
Process Symbols (Rectangles): Denote actions, calculations, or data movements.
-
Decision Symbols (Diamonds): Indicate branching points where a yes/no or true/false question determines the next path.
-
Flow Lines (Arrows): Show the direction and sequence of the workflow.
-
Connectors (Circles): Used to continue flow across page breaks or complex sections, maintaining readability.
The Power of Stepwise Refinement
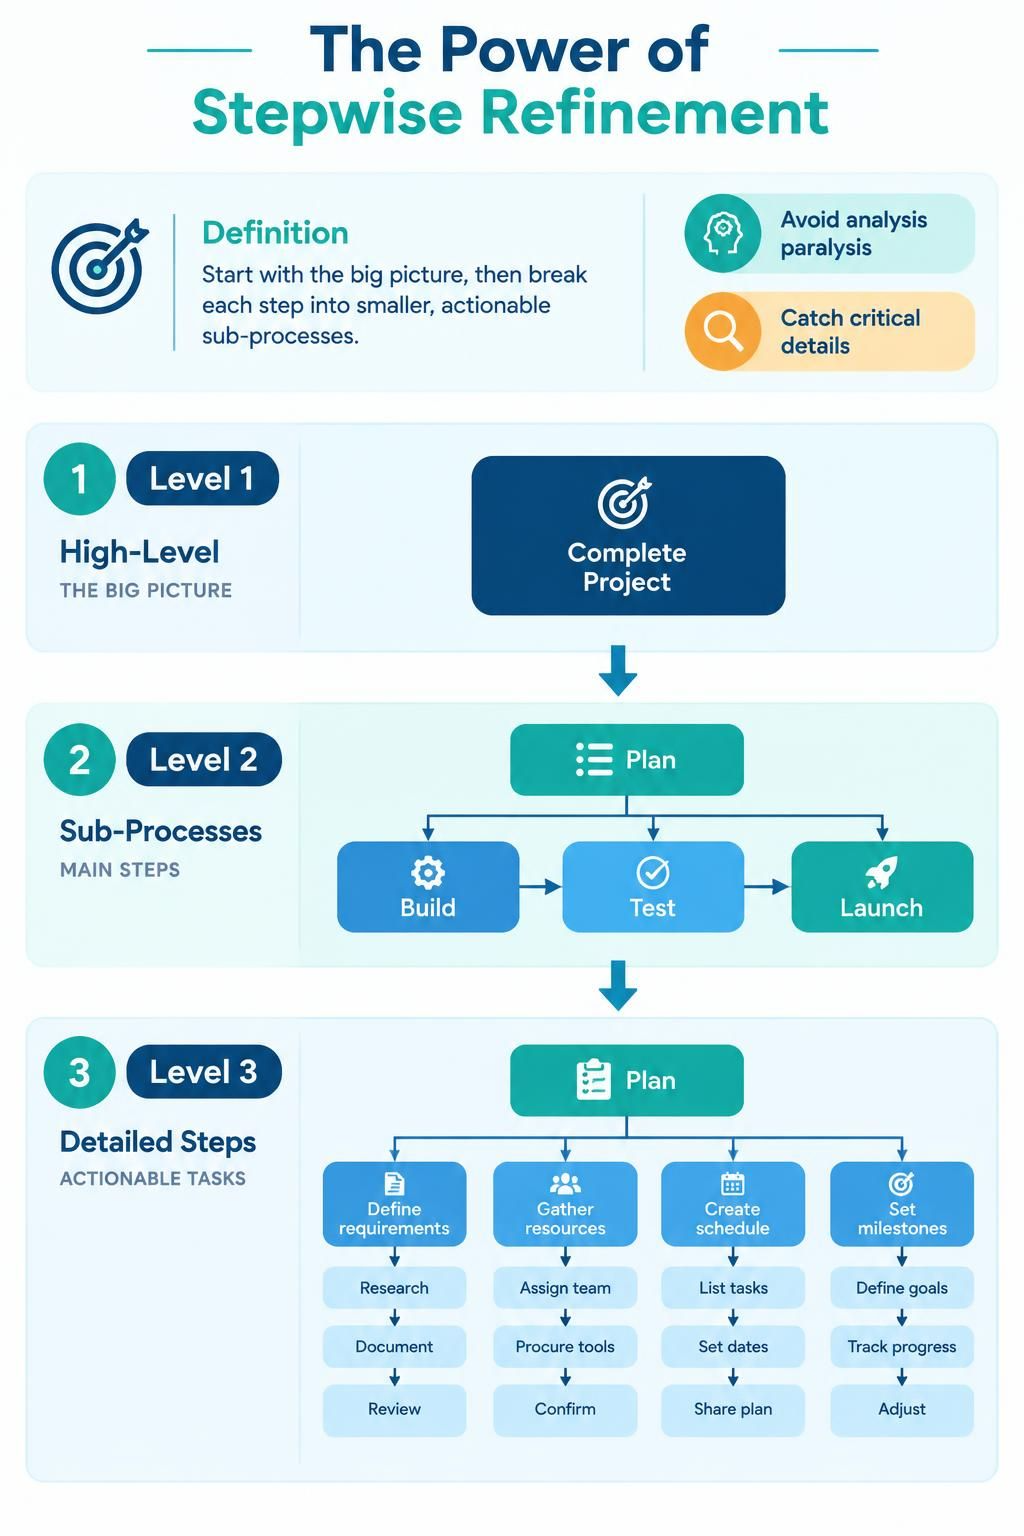
One of the most effective techniques for managing complexity is Stepwise Refinement. This method involves starting with a high-level overview and progressively breaking down each step into more detailed sub-processes. This approach prevents “analysis paralysis” and ensures that no critical detail is overlooked.
Understanding Stepwise Refinement through Example
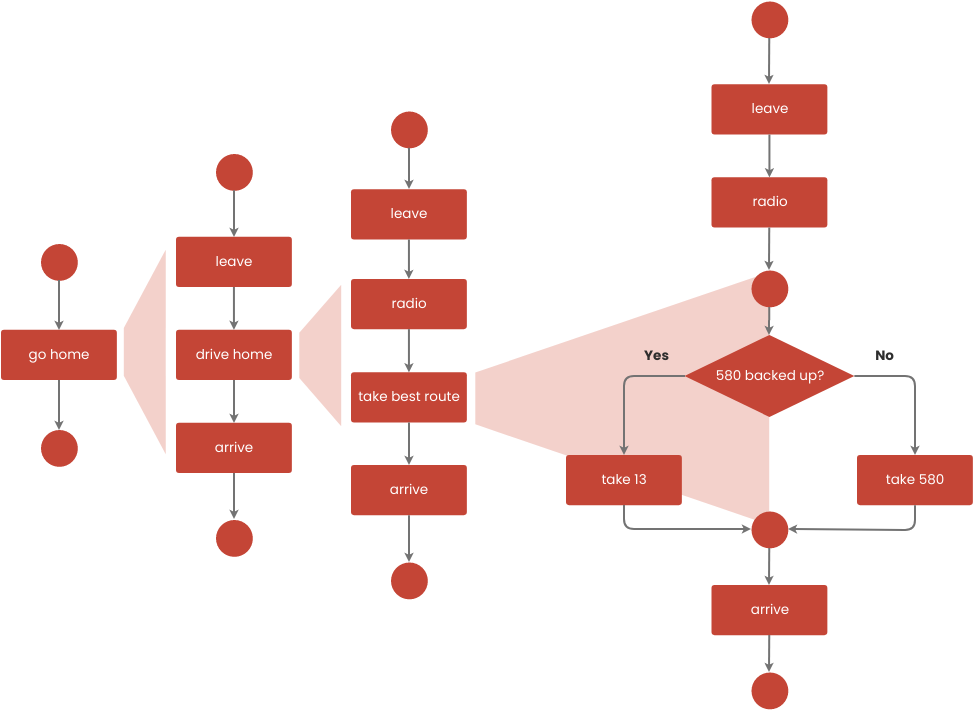
The following figure illustrates how a simple process can be refined from a broad overview to a detailed decision tree.
Example – Go Home
Level 1: High-Level Overview
At the highest level, we see the macro steps:
-
Go Home: The initiation of the journey.
-
Leave: Departing from the current location.
-
Drive Home: The transit phase.
-
Arrive: The completion of the process.
This view is useful for quick status updates but lacks actionable detail.
Level 2: First Level of Refinement
We break down the “Drive Home” and “Leave” actions:
-
Leave: Now includes turning on the radio.
-
Take Best Route: Replaces the generic “Drive Home,” implying a choice needs to be made.
-
Arrive: Remains the endpoint.
This level adds context but still leaves the “Best Route” ambiguous.
Level 3: Second Level of Refinement
Here, we introduce logic and decision-making:
-
Decision Point: “Is 580 Backed Up?”
-
Yes: Take I3.
-
No: Take 580.
-
-
Arrive: The final step.
By refining the process step-by-step, we transform a vague instruction into a precise, executable plan that accounts for real-world variables like traffic conditions.
Benefits of Stepwise Refinement
-
Clarity: Complex problems become manageable chunks.
-
Accuracy: Ensures all logical paths (including edge cases) are considered.
-
Flexibility: Allows you to present different levels of detail to different audiences (e.g., executives vs. developers).
-
Iterative Design: Makes it easier to update specific parts of a process without redrawing the entire chart.
Leveraging Visual Paradigm and AI for Flowcharting
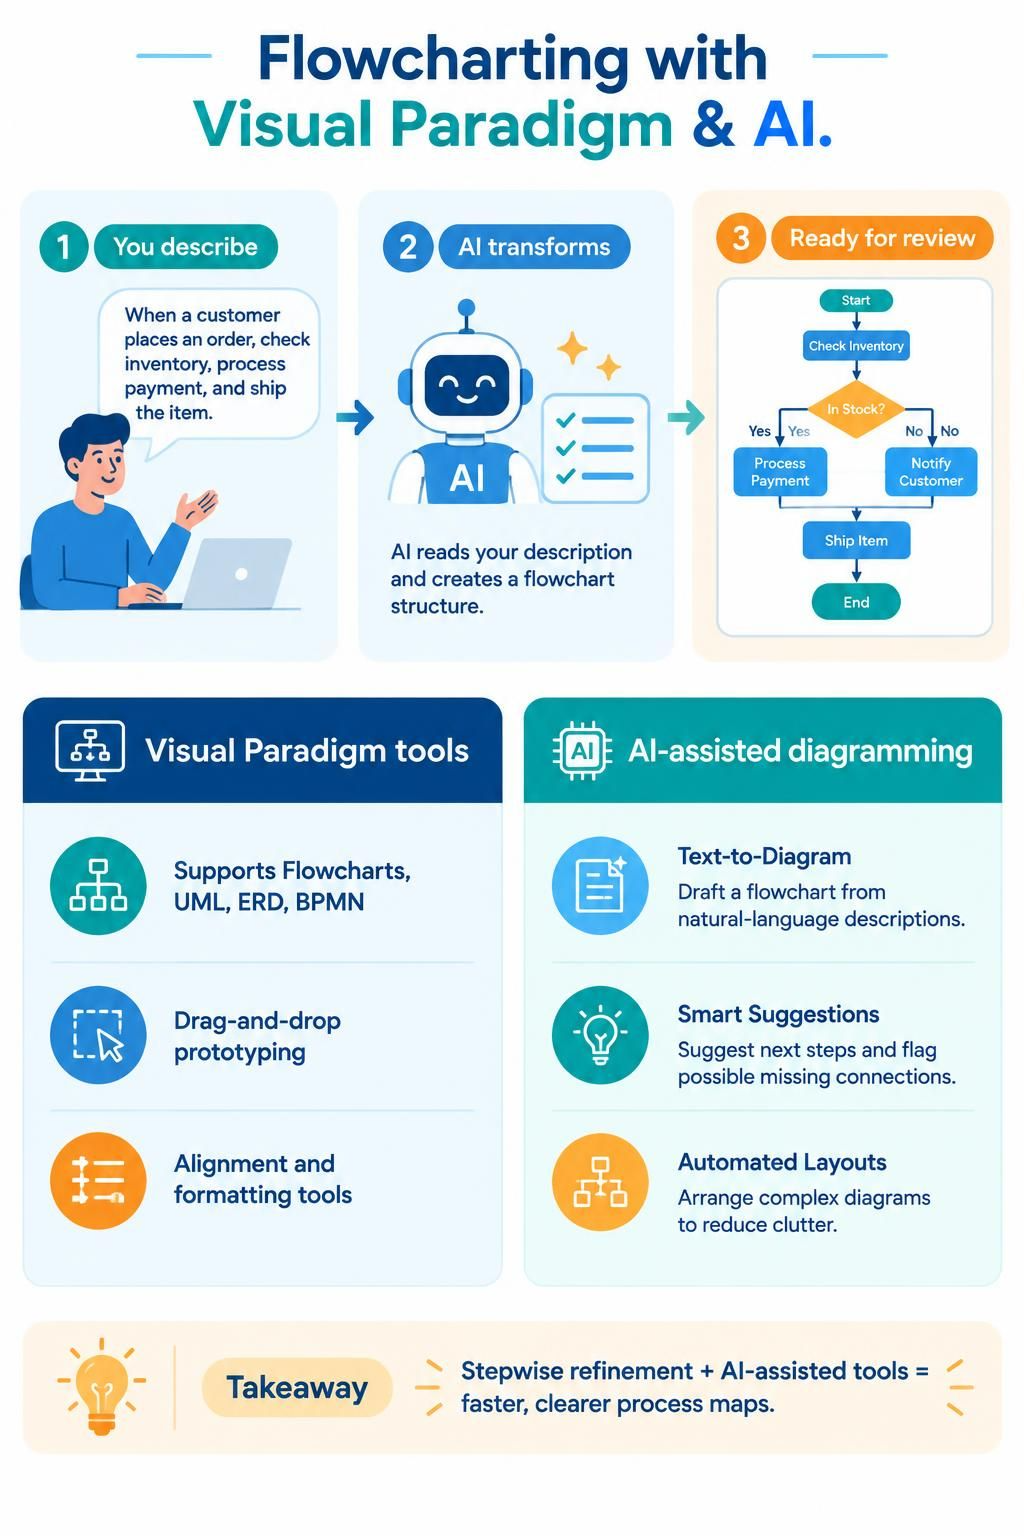
Creating detailed flowcharts manually can be time-consuming. Modern tools like Visual Paradigm streamline this process with intuitive interfaces and AI assistance.
Visual Paradigm UML and Flowchart Tools
Visual Paradigm offers a robust suite for diagramming, supporting not just flowcharts but also UML, ERD, and BPMN. Its drag-and-drop interface allows for rapid prototyping, while its alignment and formatting tools ensure professional-looking outputs.
AI-Assisted Diagramming
The integration of AI into Visual Paradigm enhances productivity by:
-
Text-to-Diagram: Generating initial flowchart structures from natural language descriptions.
-
Smart Suggestions: Recommending next steps or identifying missing connections based on common patterns.
-
Automated Layouts: Organizing complex diagrams automatically to reduce clutter and improve readability.
By combining the structured approach of stepwise refinement with the speed of AI-assisted tools, you can create comprehensive process maps in a fraction of the traditional time.
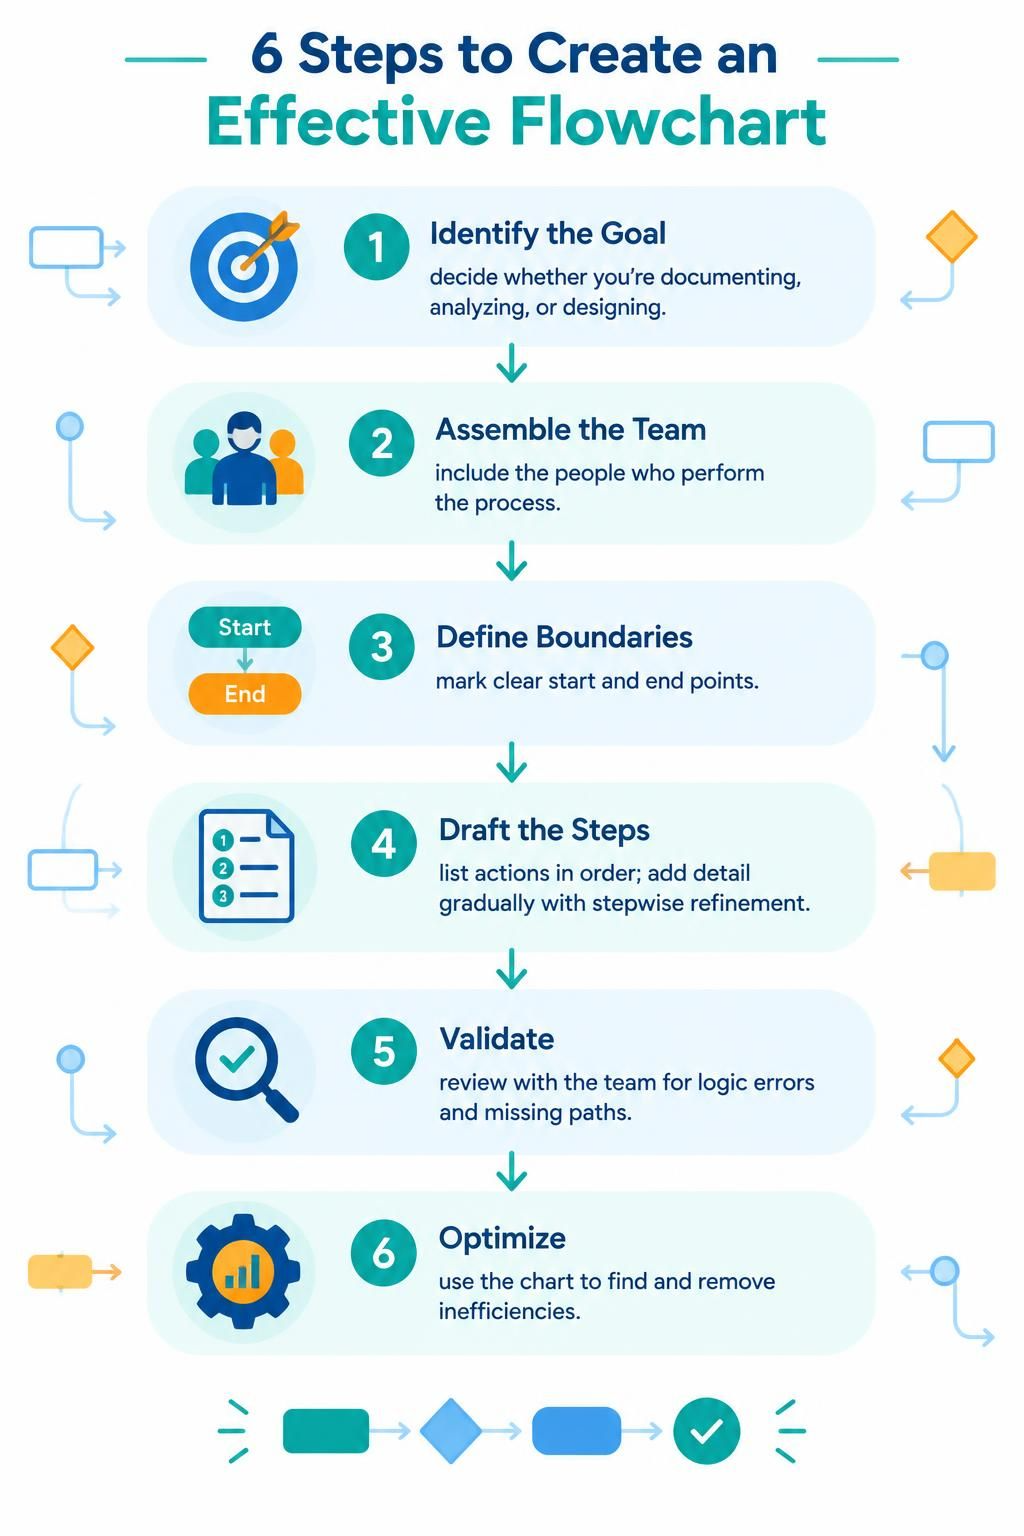
Six Steps for Creating a Effective Flowchart
-
Identify the Goal: Define the purpose. Are you documenting, analyzing, or designing?
-
Assemble the Team: Include stakeholders who perform the process to ensure accuracy.
-
Define Boundaries: Clearly mark the start and end points.
-
Draft the Steps: List actions in sequence. Use stepwise refinement to add detail gradually.
-
Validate: Walk through the chart with the team to check for logic errors or missing paths.
-
Optimize: Use the flowchart to identify and eliminate inefficiencies.
Conclusion
Flowcharts are indispensable tools for anyone looking to bring order to chaos. By visualizing processes, you unlock the ability to communicate clearly, identify improvements, and execute with precision. The technique of stepwise refinement ensures that you can manage complexity without losing sight of the big picture.
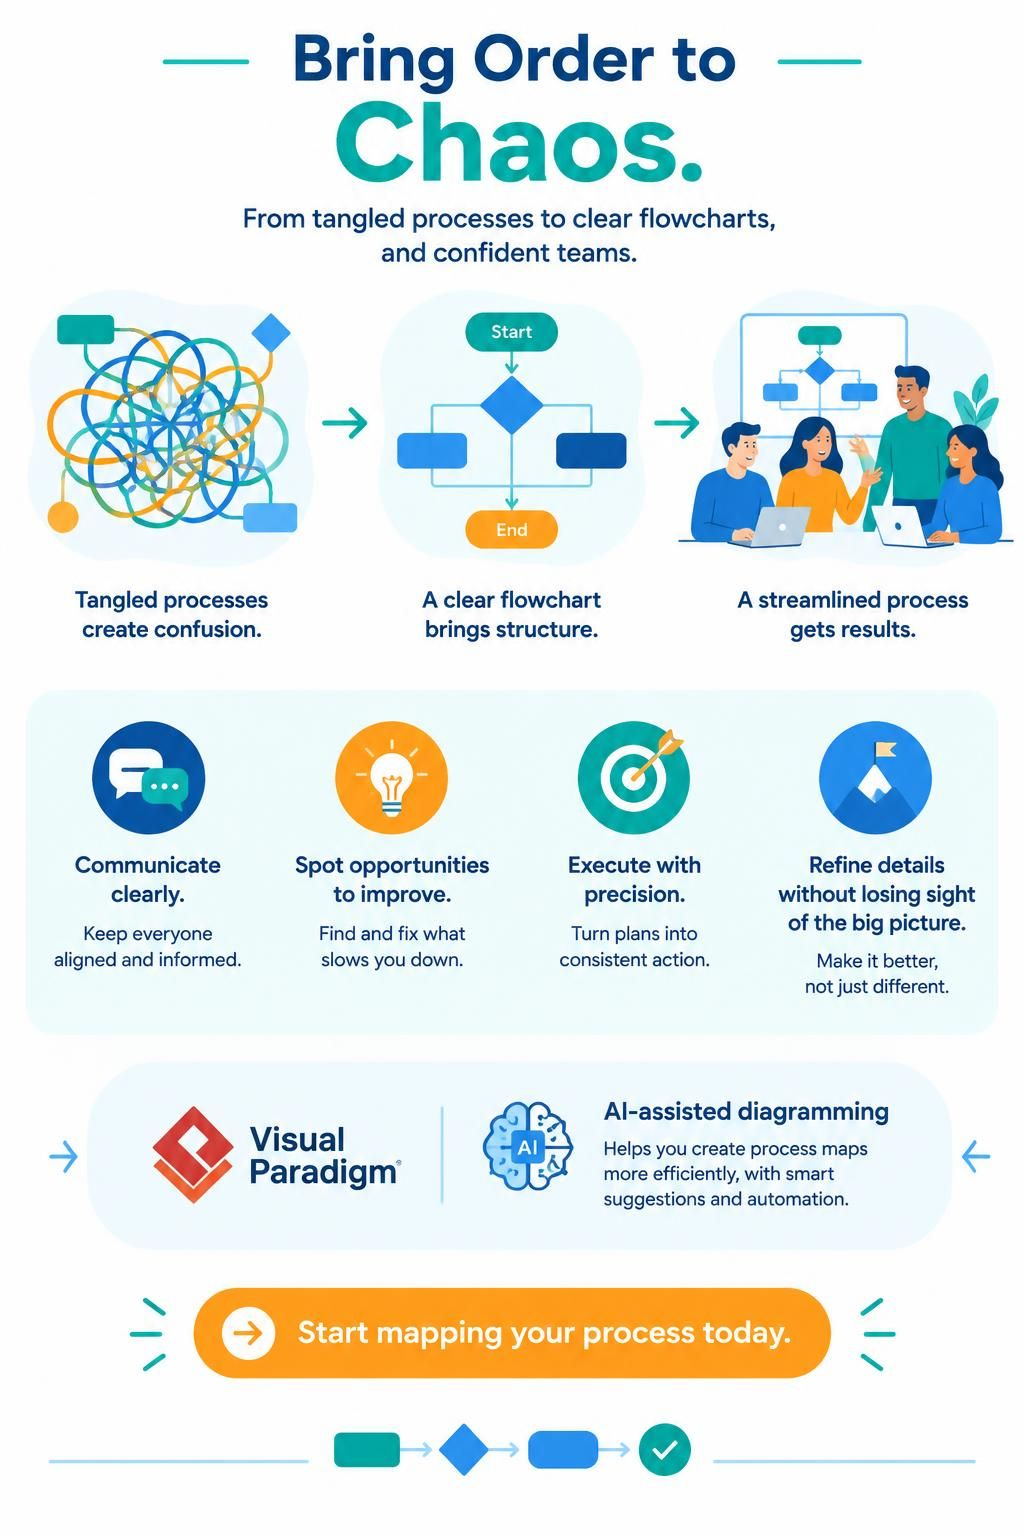
With advanced tools like Visual Paradigm and its AI capabilities, creating these vital diagrams has never been easier or more efficient. Start mapping your processes today to drive better outcomes tomorrow.
Recommended Resources on Visual Paradigm
- Online Flowchart Tool: Visual Paradigm’s online flowchart tool is described as the easiest and most powerful in the world, allowing users to create diagrams quickly and collaboratively. It supports creating flowcharts from scratch or using templates.
- Flowchart Tutorial (with Symbols, Guide and Examples): This tutorial provides a step-by-step guide on how to draw flowcharts using Visual Paradigm. It covers the basics of flowcharts, their symbols, and examples to help users understand and create flowcharts effectively.
- Free Online Flowchart Maker: Visual Paradigm Online offers a free flowchart maker with an intuitive drag-and-drop editor. It includes extensive built-in templates and allows users to create professional flowcharts quickly and easily.
- Flowchart Templates: This resource provides a variety of free online flowchart templates and examples. Users can sign up to create a free online workspace and start designing professional flowcharts using Visual Paradigm’s online flowchart maker.
- Flowchart Tutorial: This tutorial covers what a flowchart is, how to create one, and when to use it. It includes flowchart examples and tips, helping users learn about flowcharts and how to draw them step-by-step using Visual Paradigm.
- Easy-to-Use Flowchart Maker: Visual Paradigm is highlighted as an intuitive and powerful flowchart software, ideal for users who need a reliable and easy-to-use tool for creating visually appealing flowcharts quickly.
- Free Online Flowchart Editor: Visual Paradigm Online features a state-of-the-art online flowchart editor that allows users to create flowcharts flexibly and simply. It supports various diagram types, including mind maps, org charts, UML, ERD, and floor plans.
- Web-Based Free Flowchart Maker: This web-based flowchart maker by Visual Paradigm Online supports creating professional and beautiful flowcharts online. It offers drag-and-drop functionality, alignment tools, grouping, and formatting tools for easy diagramming.
- Free Flowchart Tool: Visual Paradigm Online offers a free flowchart tool that allows users to create exceptional flowcharts online. It supports inserting text, external graphics, and links, making flowcharts rich in content and visually tidy.

 English
 Arabic
 Chinese (Simplified)
 Dutch
 French
 German
 Italian
 Japanese
 Korean
 Portuguese
 Russian
 Spanish