


Introduction
Sequence diagrams are powerful tools in software development for visualizing the interactions between objects or components in a system over time. They help you understand how various parts of your system communicate and collaborate, making complex workflows easier to comprehend, document, and debug.
In this beginner’s guide, we’ll introduce you to sequence diagrams and show you how to create them using Visual Paradigm Online, a user-friendly online diagramming tool with a collection of templates that make learning easy through practical examples. Whether you’re a developer, business analyst, or student, this guide will equip you with the foundational knowledge to start modeling system interactions effectively.
What is a Sequence Diagram?
A sequence diagram is a type of UML (Unified Modeling Language) diagram that represents the interactions between objects or components in a system in chronological order. It showcases how messages are passed between these entities over time, making it a valuable tool for:
-
Understanding system behavior and workflow logic
-
Documenting API interactions and microservices communication
-
Planning and reviewing software architecture
-
Communicating technical processes to non-technical stakeholders
-
Identifying bottlenecks or redundant steps in a process
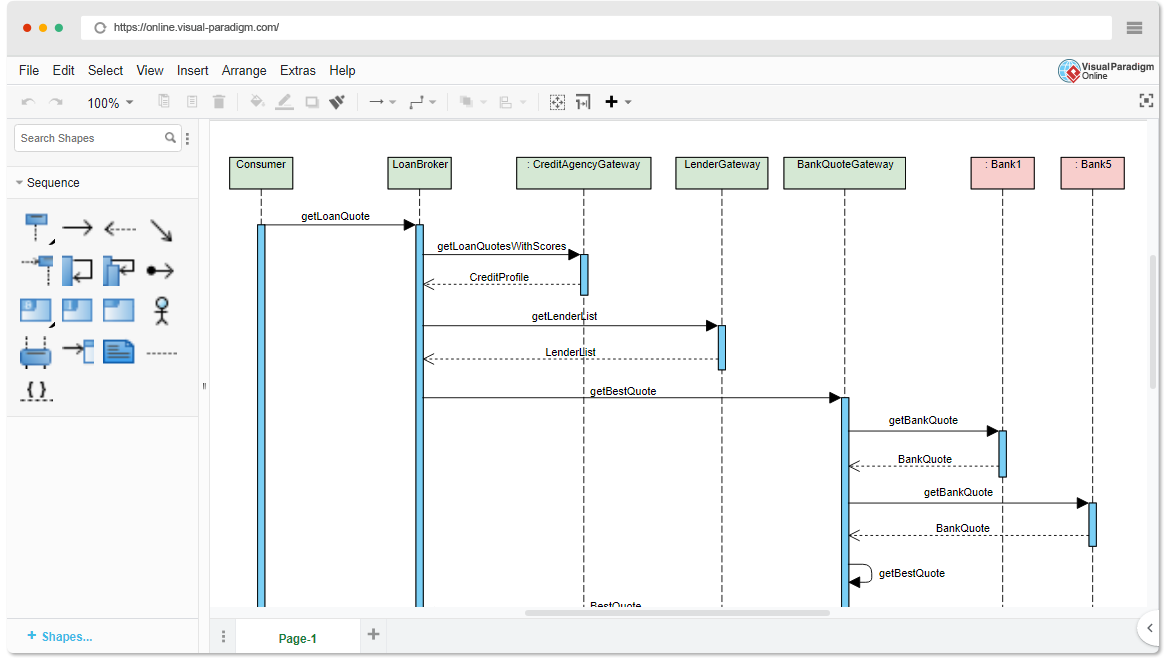
Figure 1: Example of a sequence diagram showing object interactions over time
Sequence diagrams follow a top-to-bottom timeline, where:
-
Horizontal axis: Represents different participants (objects, actors, systems)
-
Vertical axis: Represents time progression (earlier events at the top, later events at the bottom)
-
Arrows between lifelines: Represent messages or method calls exchanged between participants
Getting Started with Visual Paradigm Online
Visual Paradigm Online is a web-based diagramming tool that makes it easy to create professional sequence diagrams without installing software. To get started, follow these steps:
Step 1: Sign Up or Log In
-
Visit the Visual Paradigm Online website
-
Sign up for a free account or log in if you already have one
-
The free tier offers sufficient features for learning and small projects
Step 2: Create a New Sequence Diagram
-
Once logged in, click the “New Diagram” button on your dashboard
-
Select “Sequence Diagram” from the template gallery
-
Choose a blank canvas or start from a pre-built template
Step 3: Familiarize Yourself with the Interface
-
Toolbar: Contains shapes, connectors, and formatting tools
-
Canvas: Your working area for building diagrams
-
Properties Panel: Adjust styles, labels, and behaviors of selected elements
-
Export Options: Save your diagram as PNG, PDF, or share via link
💡 Pro Tip: Use keyboard shortcuts (like
Ctrl+Zfor undo) to speed up your workflow. Visual Paradigm Online supports many standard shortcuts for efficiency.
Key Components of a Sequence Diagram
Before diving into creation, let’s understand the essential building blocks of a sequence diagram:
1. Objects or Lifelines
-
Represent the entities (objects, actors, components, or systems) participating in the interaction
-
Displayed as vertical dashed lines with a labeled box at the top
-
Example:
User,Authentication Service,Database
2. Messages
-
Indicate communication between objects, represented by arrows pointing from sender to receiver
-
Types of messages:
-
Synchronous (solid arrowhead): Sender waits for a response
-
Asynchronous (open arrowhead): Sender continues without waiting
-
Return (dashed line): Response or return value
-
-
Labels describe the action:
loginRequest(),validateCredentials(),return token
3. Activation Bars (Execution Specifications)
-
Vertical rectangles overlaid on lifelines
-
Represent the period during which an object is actively processing a message
-
Help visualize processing time and concurrency
4. Optional Elements
-
Notes: Add explanatory text or context without affecting diagram logic
-
Constraints/Conditions: Use
[condition]syntax to show conditional flows (e.g.,[valid credentials]) -
Combined Fragments: Group messages using
alt,opt,loop, orbreakframes for complex logic -
Self-Messages: Arrows that loop back to the same lifeline to represent internal processing
Creating a Simple Sequence Diagram
Let’s walk through creating a basic sequence diagram to illustrate a user logging into a system:
Step 1: Add Lifelines
-
Drag and drop “Lifeline” shapes from the toolbox onto the canvas
-
Label them as:
-
User(actor) -
Login UI(interface) -
Authentication Service(backend) -
Database(data layer)
-
Step 2: Add Messages
Create message arrows in chronological order:
-
User→Login UI:enterCredentials(username, password) -
Login UI→Authentication Service:validateCredentials(username, password) -
Authentication Service→Database:queryUser(username) -
Database→Authentication Service:return userData -
Authentication Service→Login UI:return authToken(if valid) -
Login UI→User:displayDashboard()
Step 3: Add Activation Bars
-
Extend activation bars on each lifeline to show when each component is actively processing
-
This clarifies which system is “busy” at each step
Step 4: Add Optional Elements
-
Add a note: “Password is hashed before transmission”
-
Add a condition:
[credentials valid]on the success path -
Add an
altfragment to show the error path:[invalid credentials] → showError()
Step 5: Format and Export
-
Use consistent colors for related components
-
Align elements for readability
-
Export as PNG for documentation or PDF for sharing with stakeholders
Learning with Templates and Examples
Visual Paradigm Online offers a rich collection of templates and examples designed to accelerate your learning curve.
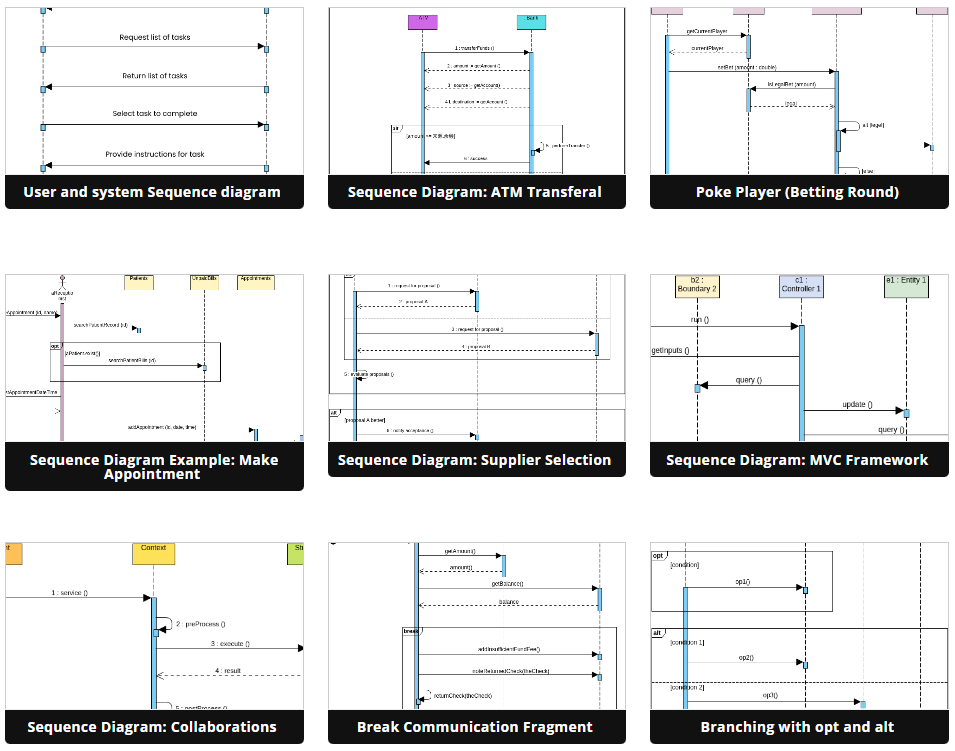
Figure 2: Visual Paradigm Online’s template gallery for sequence diagrams
How to Leverage Templates Effectively:
1. Explore Templates
-
Browse the template library for scenarios matching your use case:
-
User authentication flows
-
API request/response cycles
-
Microservices communication
-
E-commerce checkout processes
-
-
Templates include pre-defined lifelines, messages, and annotations to jumpstart your work
2. Customize Templates
-
Modify lifeline names to match your system architecture
-
Adjust message labels to reflect your actual method names or API endpoints
-
Add or remove steps to align with your business logic
3. Analyze Examples
-
Study provided examples to understand:
-
How complex interactions are broken down
-
Best practices for labeling and organization
-
Usage of advanced UML elements like
looporaltfragments
-
4. Practice Iteratively
-
Start by recreating simple examples from scratch
-
Gradually increase complexity: add conditions, parallel flows, or error handling
-
Share diagrams with teammates for feedback and collaboration
🎯 Learning Path Suggestion:
Recreate the login example above
Model a password reset flow
Diagram an API integration with third-party services
Document a complete user journey (signup → purchase → confirmation)
Best Practices for Effective Sequence Diagrams
To ensure your sequence diagrams are clear, useful, and maintainable:
✅ Keep it focused: Model one scenario or use case per diagram
✅ Use meaningful names: Label lifelines and messages with clear, descriptive terms
✅ Limit participants: Avoid overcrowding; split complex interactions into multiple diagrams
✅ Maintain chronological order: Messages should flow top-to-bottom in time sequence
✅ Document assumptions: Use notes to clarify preconditions, postconditions, or business rules
✅ Version control: Save iterations and document changes for team collaboration
✅ Validate with stakeholders: Review diagrams with developers, testers, and product owners
❌ Avoid:
-
Overusing technical jargon without explanation
-
Mixing abstraction levels (e.g., UI clicks alongside database queries in the same detailed view)
-
Creating diagrams that are too large to read on a standard screen
Troubleshooting Common Issues
| Issue | Solution |
|---|---|
| Diagram looks cluttered | Group related messages using combined fragments; split into sub-diagrams |
| Messages cross unnecessarily | Reorder lifelines horizontally to minimize crossing arrows |
| Unclear message flow | Add sequence numbers or use color coding for different message types |
| Hard to maintain | Use consistent naming conventions; document diagram purpose in a header note |
| Export quality is poor | Use vector formats (SVG/PDF) for scalability; check resolution settings for PNG |
Conclusion
Sequence diagrams are invaluable tools for visualizing, documenting, and communicating how components interact within software systems. By mastering sequence diagrams, you gain the ability to:
-
Clarify complex workflows for development teams
-
Identify design flaws or inefficiencies early in the planning phase
-
Create living documentation that evolves with your product
-
Bridge communication gaps between technical and non-technical stakeholders
Visual Paradigm Online simplifies the entire process with its intuitive drag-and-drop interface, extensive template library, and collaboration features. Start by exploring pre-built templates, customize them to your project’s needs, and progressively build your skills by creating diagrams from scratch.
🚀 Your Next Steps:
-
Sign up for Visual Paradigm Online (free tier available)
-
Recreate the login sequence diagram from this guide
-
Explore the Sequence Diagram Software features page for advanced capabilities
-
Share your first diagram with a colleague for feedback
With practice, you’ll soon be creating professional, insightful sequence diagrams that enhance your software development workflow.
References
-
Beginner’s Guide to Sequence Diagrams with Visual Paradigm Online: A comprehensive introductory article covering sequence diagram fundamentals, Visual Paradigm Online setup, key components, step-by-step creation guide, and learning resources with templates.
-
Visual Paradigm Online – Sequence Diagram Software: Official feature page detailing Visual Paradigm Online’s sequence diagram capabilities, including template library, collaboration tools, export options, and UML compliance.
-
Visual Paradigm Online Platform: Web-based diagramming platform offering UML, BPMN, flowcharts, and more; includes free tier, real-time collaboration, and cloud storage for creating professional diagrams without installation.
-
Diagram Category – Visual Paradigm Blog: Collection of tutorials, tips, and guides focused on online diagramming techniques, tool comparisons, and best practices for visual modeling across multiple diagram types.
