UML (Unified Modeling Language) activity diagrams are behavioral models that provide a powerful visual representation of workflows, business processes, and decision logic in software systems. They are widely used in software engineering, systems analysis, and business process modeling to capture dynamic behavior, control flow, concurrency, and data movement.
This comprehensive guide explores the core concepts of UML activity diagrams, demonstrates how Visual Paradigm enhances their creation through AI-driven tools, and provides practical insights into using these diagrams effectively in real-world development and design scenarios.
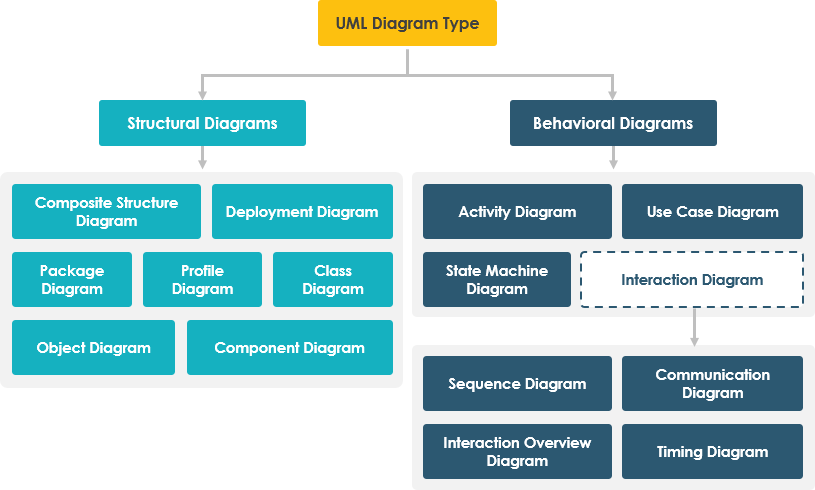
1. What Are UML Activity Diagrams?
UML activity diagrams are a type of behavioral diagram in the UML specification, designed to model the flow of control and execution of actions within a system. They are particularly useful for:
-
Visualizing complex workflows and business processes.
-
Representing decision points and parallel activities.
-
Documenting system behavior from user interaction to final output.
-
Supporting requirements analysis, process optimization, and software design.
They extend the concept of flowcharts by introducing advanced constructs such as forks, joins, swimlanes, and object flows, making them ideal for modeling both sequential and concurrent operations.
Key Purpose: To model the dynamic behavior of a system through a structured, visual workflow.
[3],[6],[8]
2. Key Concepts of UML Activity Diagrams
Understanding the fundamental building blocks is essential for creating accurate and meaningful activity diagrams.
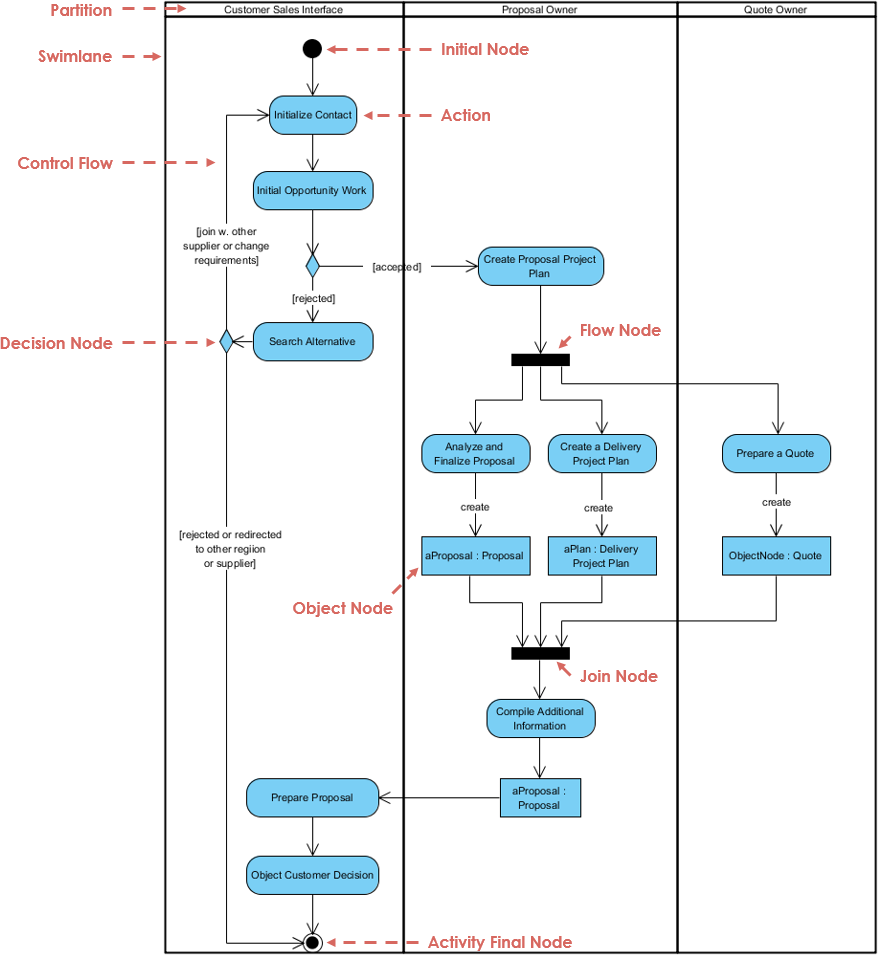
2.1 Actions / Activities
-
Represented as rounded rectangles.
-
Denote a single step or operation in the workflow.
-
Examples: “Authenticate User,” “Process Payment,” “Generate Report.”
Each action is a unit of work that may involve computation, data manipulation, or interaction with external systems.
[2],[3],[7]
2.2 Control Flow (Edges)
-
Shown as arrows connecting actions.
-
Indicates the sequence of execution from one action to another.
-
Flow follows the direction of the arrow unless otherwise constrained.
Control flow is the backbone of the diagram, showing the logical progression of steps.
[2],[3],[8]
2.3 Start and End Nodes
-
Start Node: A solid circle (●) indicating the beginning of the process.
-
Final Node (End): A bullseye (○●) representing the termination of the workflow.
These nodes define the entry and exit points of the activity diagram. Only one start node is allowed per diagram, but multiple final nodes can exist if different paths terminate the process.
[2],[3],[8]
2.4 Decision Nodes (Branching)
-
Represented as a diamond.
-
Used to branch the control flow based on a condition.
-
Typically has one incoming edge and two or more outgoing edges labeled with conditions (e.g., “Yes”, “No”).
Example: “Is the payment successful?” → Yes → “Confirm Order”, No → “Retry Payment”
[2],[3],[7]
2.5 Fork and Join Nodes (Concurrency)
-
Fork (Parallel Split): A horizontal bar that splits a single control flow into multiple concurrent flows.
-
Join (Parallel Join): A horizontal bar that synchronizes multiple concurrent flows back into one.
These are critical for modeling parallelism—such as when multiple tasks run simultaneously (e.g., sending email and updating database).
Example: After “Start,” a fork splits into “Send Email” and “Update Database,” which later join before “End.”
[2],[3],[8]
2.6 Swimlanes (Partitions)
-
Vertical or horizontal columns that group actions by responsible parties (e.g., roles, departments, or components).
-
Each swimlane represents a participant in the process (e.g., “Customer,” “System,” “Admin”).
Swimlanes help clarify responsibility assignment, making it easier to identify bottlenecks, handoffs, and ownership.
Example: In a payment processing system, one swimlane might be “User,” another “Payment Gateway,” and a third “Database.”
[2],[3],[7]
2.7 Object Flows
-
Represented as dashed arrows with open arrowheads.
-
Show how data or objects move between activities.
-
Often labeled with object names or types (e.g., “Order Object,” “User Token”).
Useful for capturing data dependencies and input/output between actions.
Example: “Create Order” → (object flow) → “Send Order to Warehouse”
[2],[3],[7]
3. Why Use UML Activity Diagrams?
| Use Case | Benefit |
|---|---|
| Requirements Analysis | Clarifies user stories and business rules. |
| Process Optimization | Highlights inefficiencies, loops, or redundant steps. |
| System Design | Maps out execution paths before coding. |
| Documentation | Provides clear, visual reference for developers and stakeholders. |
| Team Collaboration | Aligns cross-functional teams around shared process understanding. |
Activity diagrams serve as a bridge between business requirements and technical implementation.
[3],[6],[11]
4. Visual Paradigm: A Modern Platform for UML Modeling
Visual Paradigm is a leading UML modeling and software design tool that supports all 14 UML diagram types, including activity diagrams. It offers a comprehensive ecosystem for creating, managing, and integrating UML models across the software development lifecycle.
4.1 AI-Powered Activity Diagram Generation
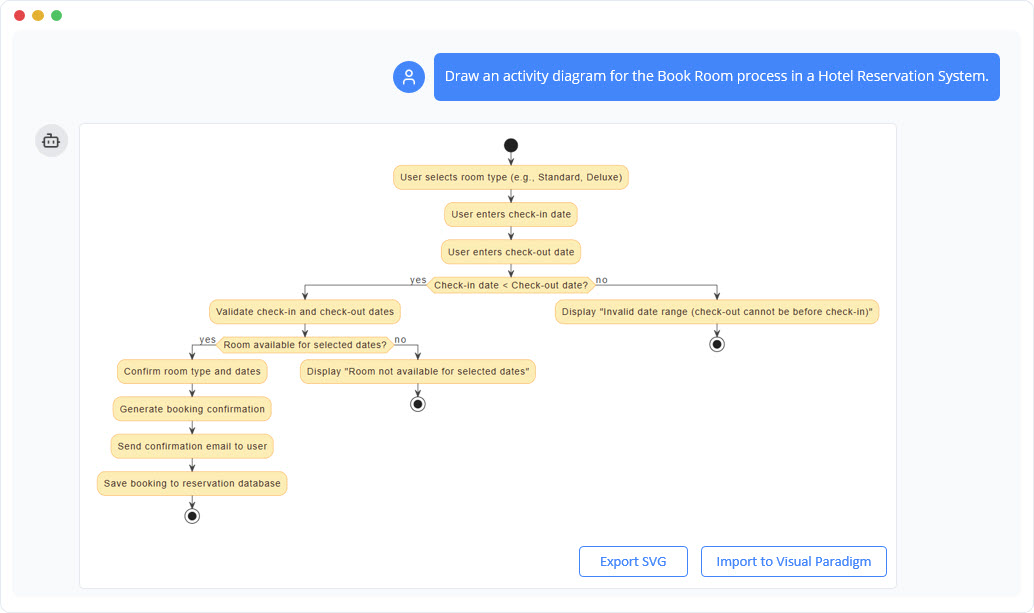
One of the most transformative features of Visual Paradigm is its AI-powered activity diagram generator.
-
Text-to-Diagram Conversion: Converts narrative-based user stories or requirements into structured activity diagrams instantly.
-
Natural Language Input: Users can input plain English descriptions like:
“When a user logs in, check if they are verified. If yes, redirect to dashboard. If no, send verification email and wait for confirmation.”
→ Visual Paradigm generates a complete activity diagram with correct nodes, flows, and decisions.
This accelerates modeling, especially for beginners or teams under tight deadlines.
[4],[5],[10]
4.2 AI Chatbot for Interactive Diagramming
The AI chatbot feature enables conversational modeling, allowing users to:
-
Generate diagrams via text prompts.
-
Edit or refine diagrams using natural language (e.g., “Add a decision node after login,” “Split the flow into parallel tasks”).
-
Get instant feedback and suggestions for improving clarity and correctness.
This turns learning and modeling into an interactive experience.
[1],[5],[10]
How AI Chatbot Can Help You Learn UML Faster [1]
4.3 Automatic Layout & Refinement
-
AI automatically rearranges nodes, connects edges, and resolves overlapping elements.
-
Ensures clean, professional-looking diagrams without manual formatting.
-
Reduces time spent on visual cleanup by up to 80%.
Ideal for large, complex workflows where manual alignment becomes impractical.
[4],[5],[10]
4.4 Traceability & Integration
Visual Paradigm enables full lifecycle traceability:
-
Link activity diagrams directly to:
-
User stories
-
Requirements documents
-
Code (via code generation or reverse engineering)
-
-
Changes in the diagram are reflected in the model and documentation.
-
Supports model-driven development (MDD).
Ensures consistency across requirements, design, and implementation.
[4],[5],[10]
4.5 Model-Based Design & Real-Time Updates
-
The diagram is not just a visual aid—it’s part of a living model.
-
When you modify the diagram, the underlying model updates automatically.
-
Changes propagate to other diagrams (e.g., use case, sequence, state diagrams), ensuring alignment.
This promotes model integrity and reduces errors caused by outdated documentation.
[4],[5],[6]
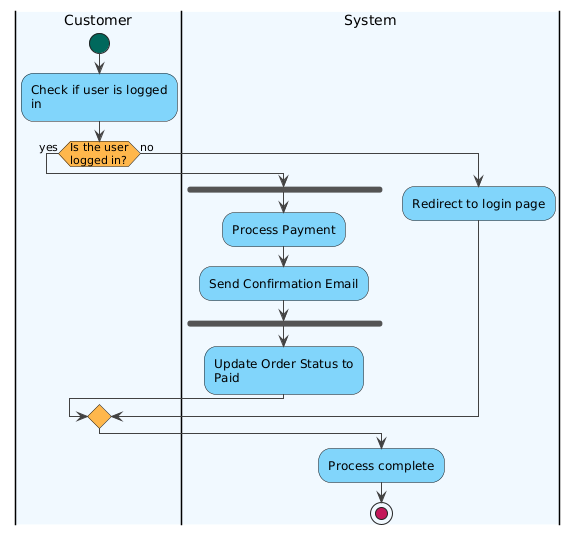
5. Practical Example: Creating a Payment Processing Activity Diagram Using Visual Paradigm AI
Let’s walk through a practical example of how Visual Paradigm’s AI features streamline the creation of a real-world activity diagram.
Scenario: Online Payment Workflow
Narrative Requirement (Input to AI):
“A user initiates a payment. First, the system checks if the user is logged in. If not, redirect to login. If logged in, verify the payment details. If valid, process the payment via the gateway. While processing, send a confirmation email in parallel. After both are complete, update the order status to ‘Paid’ and display success. If the payment fails, show an error message.”
Step-by-Step AI-Driven Process (via Visual Paradigm)
-
Input Text: Paste the above narrative into the AI chatbot interface.
-
AI Response: Instantly generates a fully structured activity diagram with:
-
Start node
-
Decision: “Is user logged in?”
-
Fork: Split into “Process Payment” and “Send Confirmation Email” (parallel)
-
Join: Synchronize both flows
-
Action: “Update Order Status to Paid”
-
End node
-
Object flows: “Payment Details,” “Email Confirmation”
-
Swimlanes: “User,” “System,” “Payment Gateway,” “Email Service”
-
@startuml
<style>
element {MaximumWidth 150}
start {
Backgroundcolor #00695C
}
stop {
Backgroundcolor #C2185B
}
activity {
Backgroundcolor #81D4FA
MaximumWidth 150
}
diamond {
Backgroundcolor #FFB74D
MaximumWidth 80
}
arrow {
LineColor #424242
Fontcolor #000000
}
swimlane {
Fontcolor #000000
FontSize 14
}
</style>
|#F0F8FF|Customer|
start
:Check if user is logged in;
if (Is the user logged in?) then (yes)
|#F0F8FF|System|
fork
:Process Payment;
:Send Confirmation Email;
end fork
‘ note right of :Payment Details → Process Payment
‘ note left of :Send Confirmation Email → Email Confirmation
|#F0F8FF|System|
:Update Order Status to Paid;
else (no)
:Redirect to login page;
endif
:Process complete;
stop
@enduml
-
Refinement via Chat:
User types:“Add a red decision node for ‘Is payment successful?’ after processing.”
→ AI adds a diamond decision node with two outgoing edges:-
“Yes” → “Update Order Status”
-
“No” → “Show Error Message”
-
-
Automatic Layout:
AI reorganizes the diagram for clarity, avoiding overlaps and optimizing flow direction. -
Traceability Link:
The generated diagram is linked to the original user story and can be exported to documentation or code.
Result
✅ A complete, professional-grade activity diagram
✅ Fully compliant with OMG UML standards [3]
✅ Ready for use in design documentation, sprint planning, or stakeholder presentations
✅ Fully editable and extensible
This process, which would traditionally take 20–30 minutes manually, is now completed in under 2 minutes with AI assistance.
[4],[5],[10]
6. Best Practices for Effective UML Activity Diagrams
To ensure clarity, maintainability, and usability:
| Best Practice | Why It Matters |
|---|---|
| Keep actions specific and atomic | Avoid vague labels like “Do something.” Use verbs: “Validate Input,” “Calculate Total.” |
| Use swimlanes to assign responsibility | Clarifies ownership and avoids ambiguity. |
| Limit decision complexity | Avoid more than 3–4 branches per decision. Break complex logic into sub-diagrams. |
| Use consistent naming conventions | e.g., “Check X,” “Process Y,” “Send Z.” |
| Avoid crossing control flows | Use automatic layout tools (like Visual Paradigm’s AI) to minimize clutter. |
| Document assumptions and conditions | Add notes or use labeled conditions on edges (e.g., “Amount > $100”). |
Following these practices ensures that diagrams are understandable to both technical and non-technical stakeholders.
[2],[3],[7]
7. Integrating with the Software Development Lifecycle
Visual Paradigm’s ecosystem ensures that activity diagrams are not isolated artifacts but integrated components of the full development lifecycle:
-
Requirements Phase: Convert user stories into activity diagrams for validation.
-
Design Phase: Use diagrams to guide implementation and identify concurrency or bottlenecks.
-
Implementation Phase: Generate code skeletons or documentation from the model.
-
Testing & Maintenance: Use the diagram as a reference for test cases and future enhancements.
This model-driven approach reduces rework, improves quality, and accelerates delivery.
[4],[5],[10]
8. Visual Paradigm Community Edition: Free Access to Powerful Tools
Visual Paradigm offers a free Community Edition, which includes:
-
Full support for UML activity diagrams
-
AI-powered diagram generation (limited)
-
Automatic layout
-
Export to PNG, PDF, and SVG
-
Integration with Git and documentation tools
Ideal for students, educators, and small teams exploring UML modeling.
[3],[11]
9. Limitations and Caution: AI is Not Perfect
While AI significantly accelerates modeling, it is not infallible:
-
May misinterpret ambiguous language.
-
Could generate incorrect or redundant flows.
-
May overlook edge cases or business rules.
✅ Always verify AI-generated diagrams against requirements and logic.
⚠️ AI can make mistakes, so double-check responses. [1]
10. Conclusion: The Future of UML Modeling is AI-Augmented
UML activity diagrams remain a vital tool for visualizing complex workflows and system behavior. With Visual Paradigm’s AI-powered ecosystem, the process of creating, refining, and maintaining these diagrams has become faster, smarter, and more collaborative.
Whether you’re a student learning UML, a developer designing a system, or a business analyst documenting processes, AI-driven modeling tools like those in Visual Paradigm empower you to:
-
Learn faster through interactive feedback [1]
-
Generate diagrams instantly from text
-
Maintain traceability and model consistency
-
Focus on design, not formatting
References
[1] How AI Chatbot Can Help You Learn UML Faster
[2] Mastering UML Activity Diagrams: A Comprehensive Guide to Workflow Modeling
[3] What is an Activity Diagram?
[4] Use Case to Activity Diagram: AI-Powered Conversion
[5] AI-Powered Diagram Generation in Visual Paradigm
[6] What is UML?
[7] Understanding Activity Diagrams in UML
[8] Visual Paradigm Activity Diagram Gallery
[9] UML Activity Diagrams in Practice (PDF)
[10] Harnessing Visual Paradigm’s AI for Diagram Generation
[11] Overview of the 14 UML Diagram Types
