


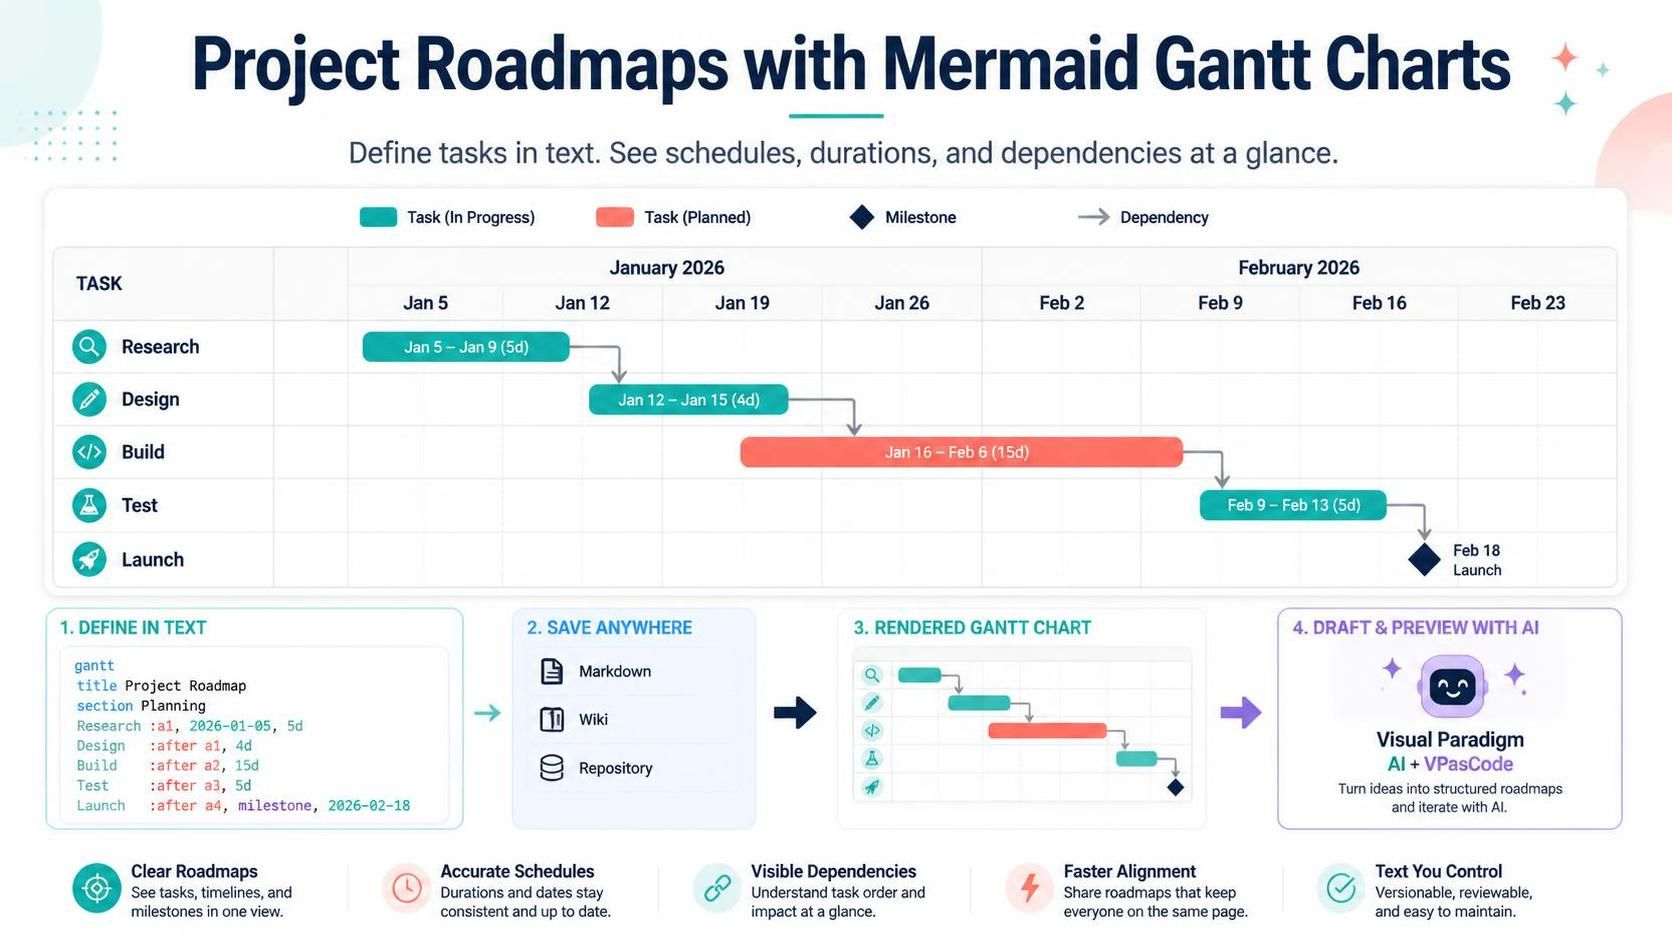
In the dynamic landscape of project management, the ability to visualize schedules, task durations, and dependencies is paramount. Traditional Gantt charts have long been the industry standard for this, yet they often require complex, proprietary software. This tutorial explores a modern, developer-centric approach: using Mermaid.js to render professional Gantt charts directly within Markdown files, wikis, and code repositories. By combining declarative text syntax with tools like Visual Paradigm AI and the VPasCode Tool, you can create maintainable, version-controlled project roadmaps with ease.
Understanding the Mermaid Gantt Architecture
At its core, a Mermaid Gantt chart is a declarative diagram. Unlike drag-and-drop tools where you manually position bars on a canvas, Mermaid uses a text-based syntax to define the logical structure of the project. The system then calculates the layout, rendering bars, timelines, and dependencies automatically.
The Four Pillars of Gantt Syntax
When defining a project roadmap in Mermaid, you are essentially defining four key components:
- Task Definitions: The specific activities that need to be completed (e.g., Research, Design, Build).
- Time Durations: The duration of each task (e.g., “5d” for 5 days) or specific start/end dates.
- Dependencies: The logical sequence. A task cannot start until a preceding task is finished (e.g., “after a1”).
- Sections: Logical groupings of tasks to keep the roadmap organized.
This approach aligns perfectly with the “Text You Control” philosophy found in modern documentation workflows, ensuring your roadmap is as versionable and reviewable as your code.
Step-by-Step: Writing Your First Roadmap
Let’s walk through the syntax required to build the roadmap shown in the reference material. We will use the standard Gantt directive, define a title, create a section, and map out the task flow.
1. Defining the Chart Structure
Every Gantt chart begins with the gantt keyword. Following this, we define the chart title and the section where our tasks reside. This helps categorize the work logically.
gantt
    title Project Roadmap
    section Planning
2. Mapping Tasks and Durations
Tasks are defined with a unique ID (e.g., a1), a name, and a date specification. In the example below, we define a “Research” task that runs for 5 days starting on January 5th, 2026. The color is automatically assigned by the renderer, or you can specify custom styles.
Research :a1, 2026-01-05, 5d3. Establishing Dependencies
The power of the Gantt chart lies in its dependencies. Instead of manually drawing arrows, we use the :after keyword. This tells the system that Task a2 cannot start until Task a1 is complete. This logic automatically adjusts the timeline if dates change.
Design :after a1, 4d
Build :after a2, 15d
4. Handling Milestones
Milestones represent significant events or checkpoints in the project, such as a product launch. In Mermaid, you define a milestone by setting the duration to milestone and specifying the exact date.
Launch :after a4, milestone, 2026-02-18Complete Code Example
By combining these elements, we generate the complete roadmap. You can copy this code block directly into a Markdown file supported by Mermaid (like GitHub READMEs, GitLab, or Visual Paradigm Markdown editors) to render the chart.
gantt
    title Project Roadmap
    section Planning
    Research :a1, 2026-01-05, 5d
    Design :after a1, 4d
    Build :after a2, 15d
    Test :after a3, 5d
    Launch :after a4, milestone, 2026-02-18
Enhancing with Visual Paradigm AI
While the text syntax is powerful, defining complex schedules manually can be tedious. This is where the integration with Visual Paradigm AI and the VPasCode Tool transforms the workflow.
- AI-Assisted Drafting: Instead of manually typing dates and dependencies, you can use an AI chatbot to describe your project in plain English. The AI then generates the Mermaid code for you.
- Instant Iteration: If a stakeholder asks, “What if we delay the Build phase by 3 days?”, you can simply ask the AI to update the code, and it will recalculate the dependencies and timeline instantly.
- Visual Paradigm Integration: The VPasCode tool bridges the gap between code and visual modeling, allowing you to export these text definitions into full-fledged project management diagrams within the Visual Paradigm suite.
Conclusion
By mastering the declarative syntax of Mermaid Gantt charts and leveraging the power of Visual Paradigm AI, you gain a flexible, maintainable, and collaborative tool for project planning. Whether you are coordinating a cloud migration or launching a new product feature, this text-based approach ensures your roadmap remains clear, accurate, and up to date.

 English
 Arabic
 Chinese (Simplified)
 Dutch
 French
 German
 Italian
 Japanese
 Korean
 Portuguese
 Russian
 Spanish