


Introduction
In today’s rapidly evolving digital landscape, software systems have grown exponentially in complexity. Modern applications are no longer monolithic entities but intricate ecosystems composed of multiple interacting components, parallel processes, conditional decision points, and asynchronous message exchanges. While this architectural sophistication enables powerful functionality, it creates a significant communication challenge: how do we convey these complex interactions to diverse stakeholders—business analysts, developers, testers, project managers, and clients—without overwhelming them with technical minutiae?
Traditional documentation methods, such as lengthy textual specifications or overly detailed sequence diagrams, often fail to provide the holistic perspective needed for effective decision-making. Stakeholders get lost in the details, missing the bigger picture of how various interactions coordinate to achieve business objectives. This is where UML Interaction Overview Diagrams (IODs) emerge as a transformative solution.
An Interaction Overview Diagram serves as a strategic navigation tool, offering a high-level, bird’s-eye view of control flow across multiple interactions within a system. Unlike sequence diagrams that meticulously detail every message exchange, IODs emphasize the orchestration of control between interactions, employing fragments, decision nodes, forks, joins, and interaction references. This abstraction layer makes IODs exceptionally powerful for simplifying complex processes, documenting system behavior at an appropriate level of detail, and creating shared understanding among both technical and non-technical stakeholders.
This case study demonstrates the practical application of IOD principles through a realistic scenario: the redesign of SkyFast Airways’ Online Ticket Booking System. By walking through the complete creation of an Interaction Overview Diagram—from initial problem identification to final validation—we illustrate how to transform a confusing 50-page text document into a clear, actionable visual model that aligns teams, accelerates development, and prevents costly misunderstandings.
Case Study: Airline Ticket Booking System
Background & Challenge
SkyFast Airways, a growing regional airline, faced a critical challenge with their online booking system. The entire booking workflow was documented in a cumbersome 50-page text specification that had become the source of constant friction between business analysts, developers, and quality assurance teams. Misinterpretations were frequent, requirements were misunderstood, and the development process was plagued by rework and delays.
The project leadership recognized that a fundamental shift in documentation approach was needed. They decided to adopt UML Interaction Overview Diagrams to create a single, authoritative visual representation of the entire booking process. This high-level map would serve as the foundation before diving into detailed sequence diagrams for individual interactions.
Step 1 – Identify Core Interactions
The cross-functional team collaborated to decompose the booking process into its fundamental interaction units:
-
Search Flights – Customer enters departure/arrival locations, travel dates, and passenger count
-
Select Flight – Customer reviews available options and chooses preferred flight
-
Add Extras – Customer optionally selects additional services (baggage, seat selection, meals)
-
Login or Continue as Guest – System authenticates user or allows guest checkout
-
Enter Passenger Details – Customer provides traveler information and contact details
-
Make Payment – Customer completes transaction via credit card or digital wallet
-
Booking Confirmation – System generates PNR (Passenger Name Record) and sends confirmation email
Step 2 – Identify Control Flow Patterns & Fragments
Through careful analysis, the team identified critical control flow patterns that would shape the diagram structure:
-
Decision Nodes:
-
After login check: authenticated user vs guest checkout
-
Flight availability validation
-
-
Parallel Processing (Fork/Join):
-
Post-payment: simultaneous invoice generation and seat reservation
-
-
Loop Fragment:
-
Payment retry mechanism (maximum 3 attempts)
-
-
Interaction References:
-
Complex sub-processes like “Login” and “Payment Processing” would be detailed in separate sequence diagrams
-
Step 3 – Define System Lifelines
The team identified the primary participants in the booking ecosystem:
-
Customer(Actor) – The end-user initiating the booking -
BookingSystem– Core application orchestrating the process -
PaymentGateway– External payment processing service -
FlightDatabase– Repository of flight availability and pricing
In IODs, lifelines often appear within specific interaction fragments rather than spanning the entire diagram, maintaining clarity and focus.
Step 4 – Construct the Interaction Overview Diagram
Following UML notation standards, the team created the comprehensive IOD:
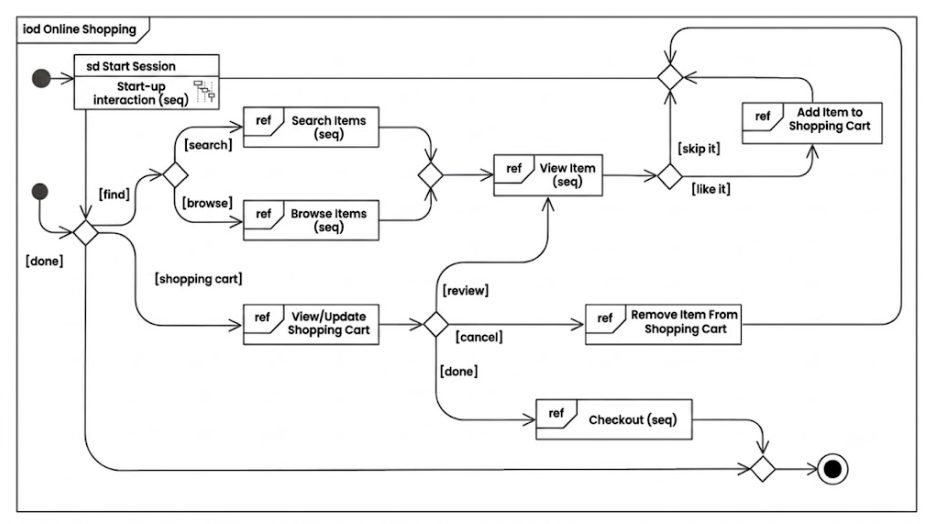
Diagram Flow Explanation:
-
Initial Node (solid black circle) → Booking session begins
-
Interaction Use →
Search Flights(references detailed sequence diagram) -
Decision Node → “Flight available?”
-
No → Return to search
-
Yes → Proceed to next step
-
-
Interaction Use →
Add Extras(optional services) -
Decision Node → “User authenticated?”
-
No → Invoke
Logininteraction use -
Yes → Skip authentication
-
-
Interaction Use →
Enter Passenger Details -
Interaction Use →
Make Payment(includes loop fragment for retry logic) -
Fork Node → After successful payment, parallel execution begins:
-
Left branch:
Generate Invoice -
Right branch:
Reserve Seat
-
-
Join Node → Synchronize parallel branches
-
Final Node →
Send Confirmationand terminate process
Step 5 – Apply UML Notations Systematically
The following table demonstrates how each UML notation element was applied in the airline booking IOD:
| Notation Element | Application in Airline Booking IOD |
|---|---|
| Initial Node | Marks the start of the booking session |
| Interaction Use | Search Flights, Login, Make Payment, Add Extras |
| Interaction Fragment | Loop for payment retry attempts; parallel fork/join blocks |
| Object Lifeline | Customer, BookingSystem, PaymentGateway, FlightDatabase |
| Message | “Submit payment request” arrow from BookingSystem to PaymentGateway |
| Control Flow | Solid arrows connecting all nodes and interactions |
| Fork/Join Node | Post-payment parallel processing for invoice and seat reservation |
| Decision Node | “User logged in?” and “Flight available?” conditional branches |
| Final Node | Booking confirmed and email notification sent |
| Note/Constraint | “Maximum 3 payment attempts” annotation attached to loop fragment |
Step 6 – Stakeholder Review & Validation
The completed IOD underwent rigorous review with all project stakeholders:
Business Stakeholders confirmed that the visual flow accurately represented the intended customer journey and business rules.
Development Team noted that Login and Make Payment interactions would be elaborated in subsequent detailed sequence diagrams, allowing parallel development work.
Quality Assurance Team immediately identified critical test scenarios:
-
Payment failure and retry logic
-
Guest checkout versus authenticated user paths
-
Parallel processing failure handling
-
Edge cases at decision nodes
Reference Examples & Pattern Recognition
The structure of this airline booking IOD shares fundamental patterns with other well-documented systems:
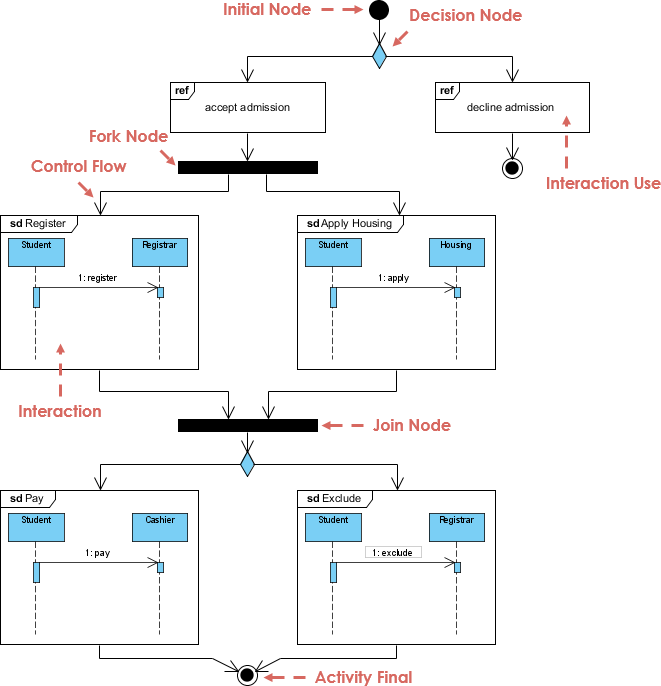
Student Admission System Example:
Similar to the airline booking flow, the student admission process features an initial decision node (accept/decline application) followed by parallel tasks (course registration, housing application) and concludes with payment verification.

Online Shopping System:
The e-commerce domain demonstrates identical patterns with decision nodes for payment method selection and parallel fragments for inventory updates and invoice generation—mirroring the airline system’s approach to flight extras, payment retries, and parallel invoice plus seat reservation.
These recurring patterns across domains demonstrate the versatility and reusability of IOD structures.
Benefits Realized: Transformation at SkyFast Airways
The adoption of Interaction Overview Diagrams delivered measurable improvements across multiple dimensions:
| Benefit | Impact at SkyFast Airways |
|---|---|
| Clarity & Comprehension | Replaced 50 pages of ambiguous text with a single-page visual diagram universally understood by all stakeholders |
| Simplification of Complexity | Parallel processes (seat reservation + invoice generation) were clearly represented without overwhelming detail |
| Enhanced Communication | Achieved stakeholder alignment in a single 1-hour workshop versus weeks of fragmented meetings |
| Improved Analysis & Optimization | QA team immediately identified missing “maximum retry” logic and incorporated it into the loop fragment |
| Informed Design Decisions | Architecture team decided to implement Login as a reusable interaction component across multiple system flows |
| Agile Change Management | When a new “post-payment seat upgrade” feature was requested, the team easily identified the insertion point before the join node |
Methodology: How to Create an Interaction Overview Diagram
Based on the SkyFast Airways experience, here is a proven step-by-step methodology:
1. Identify Core Interactions
-
Decompose the business process into discrete interaction units
-
Example: Search → Select → Add Extras → Authenticate → Enter Details → Payment → Confirmation
2. Identify Control Flow Fragments
-
Map decision points (diamonds)
-
Identify parallel processing opportunities (fork/join)
-
Detect loops and iterations
-
Note exception handling paths
3. Define Participant Lifelines
-
Identify all actors and system components
-
Determine which lifelines are relevant at each interaction stage
4. Specify Messages & Data Flow
-
Document key messages between interactions
-
Example: “Search request”, “Payment authorization”, “Confirmation receipt”
5. Apply Interaction Fragments
-
Enclose loops in rectangular frames labeled “loop”
-
Mark parallel regions with “par” fragments
-
Add guards/conditions to decision branches
6. Connect Fragments with Control Flow
-
Use solid arrows for standard flow
-
Use dashed arrows for exceptions or alternative paths
-
Ensure all paths lead to appropriate termination
7. Add Control Nodes
-
Initial Node: Solid black circle (start)
-
Decision Node: Diamond shape (conditional branching)
-
Fork/Join Nodes: Solid horizontal/vertical bars (parallel processing)
-
Final Node: Solid black circle with border (termination)
8. Review & Validate with Stakeholders
-
Conduct walkthrough sessions with business, development, and QA teams
-
Verify completeness and accuracy
-
Identify missing scenarios or edge cases
9. Refine & Iterate
-
Add clarifying notes and constraints
-
Optimize layout for readability
-
Update based on feedback and evolving requirements
Practical Applications: Where IODs Deliver Value
The Interaction Overview Diagram created for SkyFast Airways serves multiple critical purposes throughout the software development lifecycle:
| Use Case | Application in Airline Booking Context |
|---|---|
| System Architecture Design | Architects used the IOD to define microservice boundaries (Payment Service, Booking Service, Seat Management Service) |
| Requirements Analysis | Product Owner validated that guest checkout flow and payment retry logic were correctly captured |
| Technical Documentation | The IOD became the opening page of the functional specification document, providing immediate context |
| Test Case Design | QA team derived 12+ test scenarios covering payment retry paths, parallel execution failures, and all decision node branches |
| Onboarding & Training | New team members rapidly understood system behavior without reading extensive documentation |
| Impact Analysis | When requirements changed, the team quickly assessed which interactions were affected |
Advanced Considerations & Best Practices
When to Use Interaction Overview Diagrams
IODs are particularly valuable when:
-
Multiple interactions must be coordinated to achieve a business goal
-
Parallel processing is involved
-
Complex decision logic exists with multiple branching paths
-
Stakeholder alignment is needed across technical and non-technical audiences
-
System boundaries need clarification before detailed design
Common Pitfalls to Avoid
-
Over-detailing: IODs should remain high-level; save message sequences for sequence diagrams
-
Ignoring Exception Paths: Always model error handling and alternative flows
-
Unclear Fragment Boundaries: Clearly label loop conditions and parallel region guards
-
Missing Synchronization: Ensure fork/join pairs are properly matched
-
Neglecting Validation: Always review with diverse stakeholders
Integration with Other UML Diagrams
IODs work synergistically with:
-
Sequence Diagrams: IODs reference detailed sequence diagrams via interaction uses
-
Activity Diagrams: Share similar control flow notation (decisions, forks, joins)
-
Component Diagrams: IOD lifelines often map to components
-
Use Case Diagrams: IODs can elaborate the flow of complex use cases
Conclusion
The SkyFast Airways case study powerfully demonstrates that UML Interaction Overview Diagrams are far more than academic modeling exercises—they are practical, stakeholder-friendly instruments for taming complexity. By transforming a confusing 50-page textual specification into an intuitive, one-page visual flow, the airline achieved what many organizations struggle with: genuine shared understanding across diverse teams.
The true strength of Interaction Overview Diagrams lies in their hybrid nature. They bridge the conceptual gap between high-level business process modeling (activity diagrams) and detailed technical interaction design (sequence diagrams). By combining familiar control flow elements—decision nodes, forks, joins, initial and final states—with interaction-specific constructs like lifelines, messages, and interaction references, IODs create a unique vantage point that serves multiple audiences simultaneously.
Key Takeaways for Practitioners
1. Start with the Big Picture
Before diving into detailed sequence diagrams, always map the overall control flow. This prevents tunnel vision and ensures all interactions are properly orchestrated.
2. Embrace Abstraction
Resist the temptation to show every message. IODs should answer “what happens next?” not “how exactly does this message work?”
3. Leverage Reusability
Interaction uses allow you to reference detailed diagrams, promoting modularity and reducing duplication across your documentation.
4. Validate Early and Often
The visual nature of IODs makes them perfect for stakeholder reviews. Catch misunderstandings before code is written, not after.
5. Think in Patterns
As demonstrated by the similarities between airline booking, student admission, and online shopping systems, many business processes share common structural patterns. Recognize and reuse these patterns.
The Broader Impact
For any system where control flow spans multiple interactions—whether you’re designing a healthcare patient management system, a financial trading platform, an e-learning portal, or indeed an airline reservation engine—starting with an Interaction Overview Diagram is not just beneficial; it’s essential.
The investment of time in creating an IOD pays exponential dividends:
-
Hours of explanation are saved in stakeholder meetings
-
Misinterpretations are prevented before they become costly bugs
-
Parallel development becomes feasible with clear interface definitions
-
Change impact analysis becomes straightforward with visible dependencies
-
Knowledge transfer accelerates with intuitive visual documentation
Final Thought
In an era where software complexity continues to escalate, the ability to distill intricate interactions into clear, actionable visualizations is not merely a nice-to-have skill—it’s a critical competency for successful system design. UML Interaction Overview Diagrams provide that competency. They transform chaos into clarity, ambiguity into alignment, and complexity into comprehensibility.
As the SkyFast Airways transformation proves, when you invest in creating a well-crafted Interaction Overview Diagram, you’re not just drawing boxes and arrows—you’re building a shared language that empowers your entire organization to move forward with confidence, clarity, and coordinated purpose.
Start with the overview. Master the flow. Then detail the interactions. That is the path to building systems that work—not just in code, but in the real world where people, processes, and technology must align seamlessly.
References
- What is Interaction Overview Diagram? – Visual Paradigm: This article explains the Interaction Overview Diagram (IOD) as a new diagram type in UML 2.0 that combines the flexibility of Activity Diagrams with the sequential logic of Sequence Diagrams. It describes how IOD helps in modeling complex behavioral scenarios by showing the control flow between different Interaction Diagrams.
- What is Interaction Overview Diagram? (Traditional Chinese) – Visual Paradigm: The traditional Chinese version of the guide, providing a detailed explanation of the Interaction Overview Diagram’s purpose, syntax, and usage in UML modeling for software engineering.
- Interaction Overview Diagram – Visual Paradigm User Guide: A technical user guide section from Visual Paradigm detailing how to create and edit Interaction Overview Diagrams within the Visual Paradigm software environment, including toolbar functions and property settings.
- Interaction Overview Diagram Examples – Visual Paradigm Gallery: A gallery page showcasing various examples of Interaction Overview Diagrams created by users, providing visual references for best practices in combining activity nodes with sequence diagram fragments.
- UML Interaction Overview Diagram – YouTube Tutorial: A video tutorial demonstrating how to draw and understand Interaction Overview Diagrams in UML, highlighting the integration of sequence diagrams within an activity flow.
- What is Interaction Overview Diagram? – Visual Paradigm (Duplicate Link): Same as reference [1].
- How to Draw an Interaction Overview Diagram in UML – Visual Paradigm Circle: A step-by-step tutorial on drawing IODs, focusing on the practical application of connecting activity nodes to interaction specifications to model complex behavioral patterns.
- Comprehensive Guide for Visual Paradigm: Unleashing the Power of ArchiMate – archimate.visual-paradigm.com: Note: This reference is about ArchiMate Enterprise Architecture, not UML Interaction Overview Diagrams. It is likely unrelated to the core topic.
- What is Interaction Overview Diagram? – Visual Paradigm (Duplicate Link): Same as reference [1].
- Unified Modeling Language (UML) – The Knowledge Academy: A general blog post about UML that may briefly mention IODs among other diagram types, providing an overview of UML’s role in system design.
- Free Component Diagram Editor – Online Visual Paradigm: Note: This link refers to Component Diagrams, not Interaction Overview Diagrams.
- Drawing Interaction Overview Diagram – Visual Paradigm User Guide: A specific technical guide on the steps to draw IODs in Visual Paradigm, including how to add and configure Interaction Specification nodes.
