


Introduction
In the world of software engineering, understanding how objects talk to each other is just as important as knowing what those objects are. While UML sequence diagrams are widely used to trace interactions over time, communication diagrams offer a complementary perspective—prioritizing the structural relationships between objects. This case study explores the purpose, notation, and practical application of communication diagrams through a real-world hotel reservation scenario. By the end, you will see how these diagrams help model message passing, identify classes and operations, and validate architectural designs.
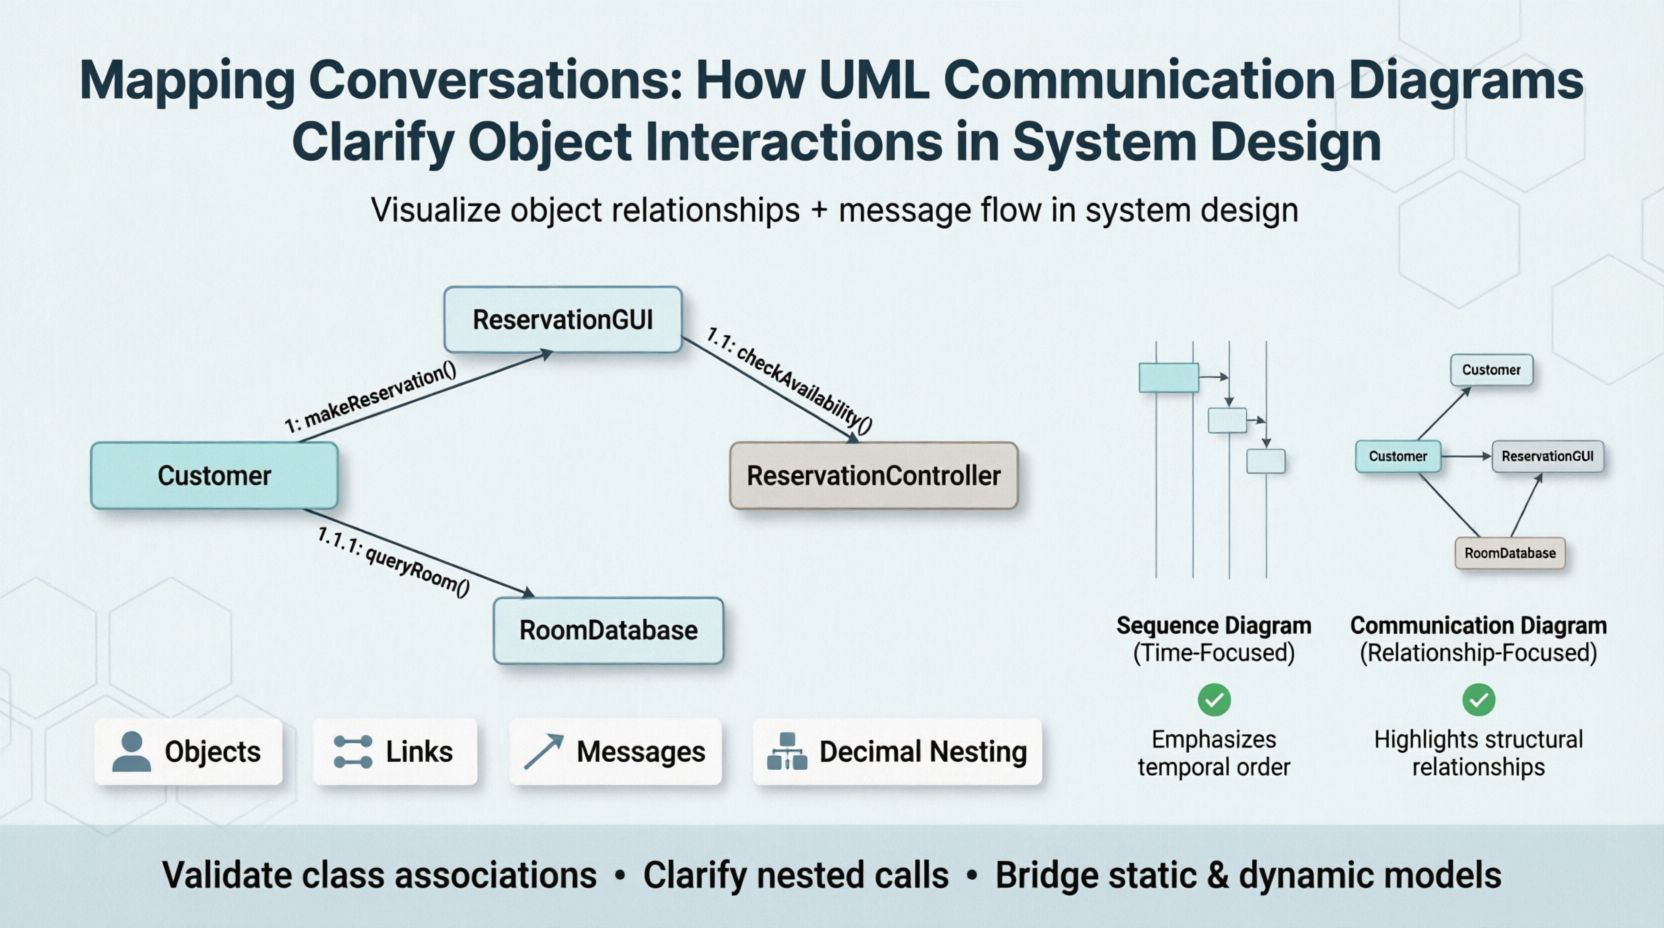
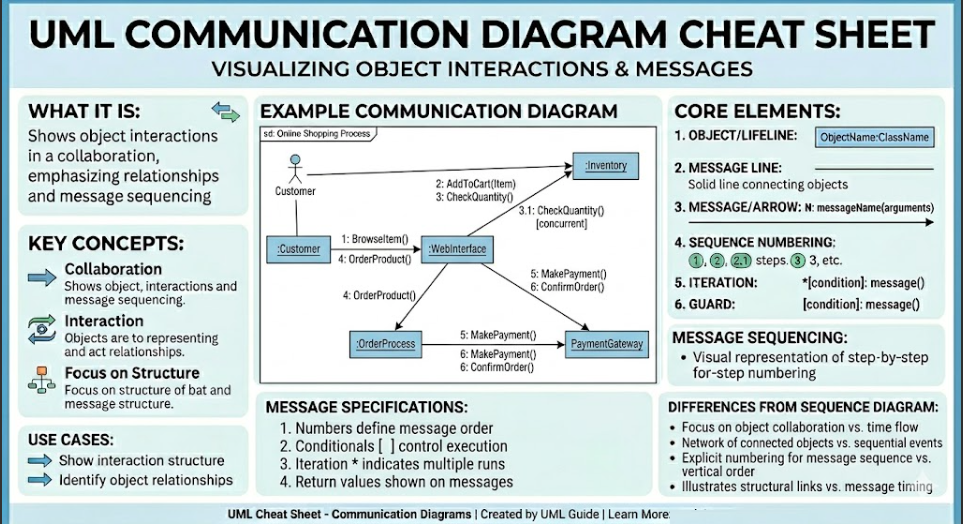
UML communication diagrams show how objects interact, extending object diagrams by adding messages and sequence numbers.
Case Study: Hotel Reservation System
Background
A hotel chain wants to design an online reservation system. The requirements include checking room availability, making a reservation, and sending a confirmation. The development team needs to model the interaction between software objects (e.g., ReservationGUI, ReservationController, RoomDatabase) without losing sight of how they are linked in the static class diagram.
Applying Communication Diagrams
The team chooses a communication diagram for two reasons:
-
To visualize relationships between objects (e.g., which object knows which).
-
To capture the sequence of messages using decimal numbering.
Step 1 – Identify objects and links
-
Objects:
Customer,ReservationGUI,ReservationController,RoomDatabase -
Links (lines between objects) represent existing associations from the class diagram.
Step 2 – Add messages with sequence numbers
-
Message
1: makeReservation()goes fromCustomer→ReservationGUI -
Message
1.1: checkAvailability()goes fromReservationGUI→ReservationController -
Message
1.1.1: queryRoom()goes fromReservationController→RoomDatabase -
Message
1.2: confirmReservation()returns fromReservationController→ReservationGUI -
Message
1.3: displayConfirmation()goes fromReservationGUI→Customer
The decimal numbering shows nesting: the message 1.1 happens within the handling of message 1, and 1.1.1 is part of 1.1. This replaces the “focus of control” rectangles found in sequence diagrams.
Resulting Communication Diagram
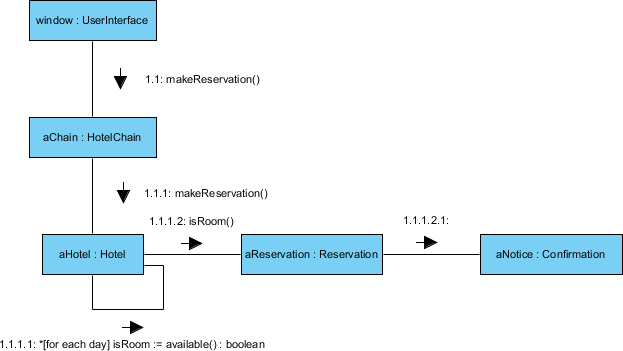
Each arrow is labeled with a sequence number. The top-level message is 1. Nested messages use decimals, clearly showing the call hierarchy.
Communication Diagram vs. Sequence Diagram – A Library Overdue Example
To further illustrate the difference, consider a library system where a Librarian checks overdue items for a Borrower.
Sequence Diagram (Time-focused)
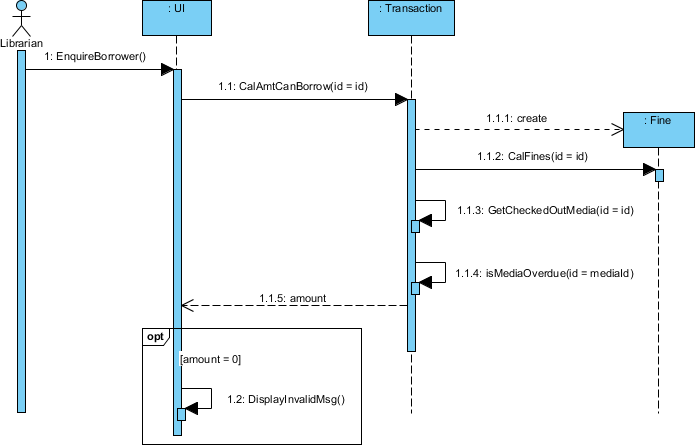
The vertical dimension shows time order clearly. Focus of control rectangles indicate when each object is active.
Automatically Generated Communication Diagram (Relationship-focused)
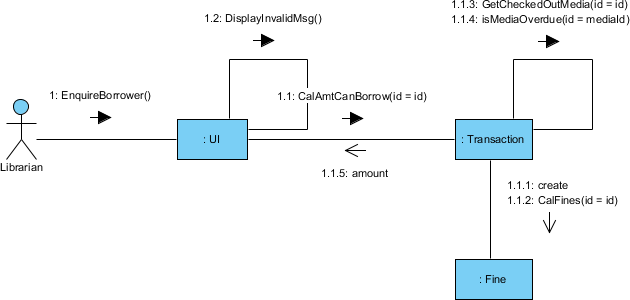
The same interactions are shown, but now the links between objects (e.g., Borrower connected to Loan connected to Book) become visible. This makes it easier to check if the class diagram supports all needed collaborations.
Key takeaway:
-
Sequence diagram → better for detailed timing and ordering.
-
Communication diagram → better for understanding object relationships and verifying static models.
Summary Tables: Sequence Diagram vs. Communication Diagram
Here is a comprehensive Sequence Diagram vs. Communication Diagram comparison table based on the article content and UML best practices.
| Feature | Sequence Diagram | Communication Diagram |
|---|---|---|
| Primary Dimension | Time (vertical axis) | Space (object layout) |
| Object Arrangement | Top to bottom along lifelines | Freely positioned anywhere on diagram |
| Message Ordering | Read top to bottom (chronological) | Sequence numbers (e.g., 1, 1.1, 2) |
| Focus of Control | Explicit – tall thin rectangles (activations) | Implicit – represented by message nesting decimals |
| Object Relationships (Links) | Not visible (lifelines only) | Explicitly shown as connecting lines between objects |
| Ease of Reading Time Order | Excellent – immediate visual timeline | Requires following sequence numbers |
| Ease of Seeing Object Links | Poor – relationships must be inferred | Excellent – links are directly visible |
| Verification of Class Diagram | Difficult – cannot validate associations | Easy – each link must match a class diagram association |
| Self-Messages | Loop on lifeline with activation | Loop icon on self-link |
| Conditional Messages | alt and opt fragments with guards |
Numbering with conditions (e.g., 1.1 [condition] message()) |
| Parallel Messages | par fragment with parallel boxes |
Same decimal prefix with different suffixes (e.g., 1.1a, 1.1b) |
| Space Efficiency | Low – long vertical diagrams | High – compact, space-optimized |
| Complexity Handling | Better for complex branching and loops | Can become messy with deep nesting |
| Popularity / Usage | Very high (80%+ of interaction diagrams) | Low to moderate (20% or less) |
| Best Use Case | Documenting time-critical processes, real-time systems, detailed logic flows | Validating static model, showing object relationships, architectural reviews |
| Generated From Each Other | Yes – can generate communication diagram from sequence diagram | Yes – can generate sequence diagram from communication diagram |
| Semantic Equivalence | Same information – interchangeable | Same information – interchangeable |
Quick Visual Comparison
| Aspect | Sequence Diagram | Communication Diagram |
|---|---|---|
| Diagram Shape | Tall and narrow | Square / compact |
| Key Element | Lifeline + activation bar | Object + link |
| Message Label | message() alone (time order implicit) |
1: message() (number required) |
| Nested Message | Activation bar inside another activation | Decimal number 1.1 |
| Object Relationship | Not drawn | Solid line (link) |
When to Use Which (Decision Guide)
| Scenario | Recommended Diagram | Why |
|---|---|---|
| You need to present to non-technical stakeholders | Sequence | Easier to read top-to-bottom |
| You want to verify that your class diagram supports all interactions | Communication | Links expose missing associations |
| You have limited space (e.g., slide or document) | Communication | More compact |
You have complex branching (if/else, loops) |
Sequence | Fragments and frames handle complexity better |
| You need to identify which classes need new operations | Both | Messages become method names in both |
| You are modeling real-time constraints | Sequence | Time dimension is explicit |
Example: Same Interaction Shown in Both
Library Overdue Check (from article):
| Sequence Diagram | Communication Diagram |
|---|---|
Shows lifelines: Librarian → Borrower → Loan → Book |
Shows objects connected by links |
| Activation bars show when each object is busy | No activation bars – nesting numbers show busy periods |
| Easy to see: “first this happens, then that” | Easy to see: “Borrower is connected to Loan, which is connected to Book” |
Note from article: “If you compare the two diagrams, you’ll see they both contain objects and messages. It’s much easier to determine the time ordering of messages by looking at the sequence diagram and easier to see the relationships between objects by looking at the communication diagram.”
Summary Table – Key Takeaway
| Sequence Diagram | Communication Diagram | |
|---|---|---|
| Focus | ⏱️ When messages occur | 🔗 Who knows whom |
| Strength | Chronological clarity | Structural validation |
| Weakness | Hides object relationships | Hides time ordering (requires decoding numbers) |
| Best For | Detailed logic, real-time, branching | Architecture review, model verification, space-limited docs |
Communication Diagram Elements in Detail
1. Objects
-
Client – sends the message (e.g.,
ReservationGUI) -
Supplier – receives and processes the message (e.g.,
ReservationController)
2. Links
-
Drawn as lines between objects.
-
Each link must exist as an association in the class diagram. If a link is missing, the communication diagram reveals a flaw in the static model.
3. Messages
-
Arrows from client to supplier.
-
Label format:
sequenceNumber: messageName(parameters) -
Self-messages are shown as loops.
4. Message Numbering Rules
| Rule | Example |
|---|---|
First message is 1 |
1: login() |
Second top-level message is 2 |
2: logout() |
Nested under 1 → 1.1 |
1.1: validateUser() |
Further nested → 1.1.1 |
1.1.1: checkPassword() |
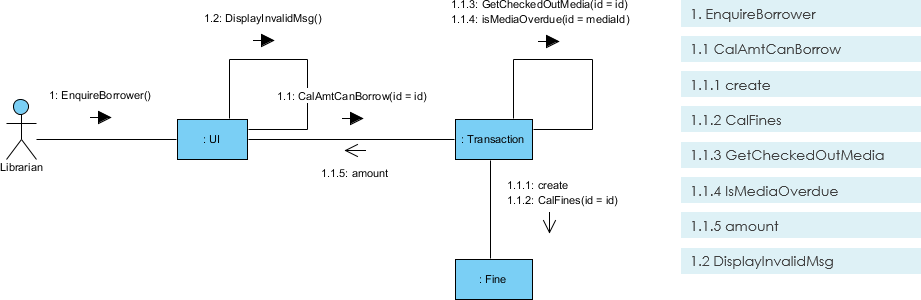
In this diagram, 1: EnquireBorrower is followed by nested messages 1.1 and 1.2. The loop on the left object represents a self-message.
From Sequence Diagram to Communication Diagram – Focus of Control Mapping
Sequence diagrams use tall thin rectangles (activation bars) to show when an object is performing an operation. Communication diagrams have no such rectangles—instead, message nesting conveys the same information.
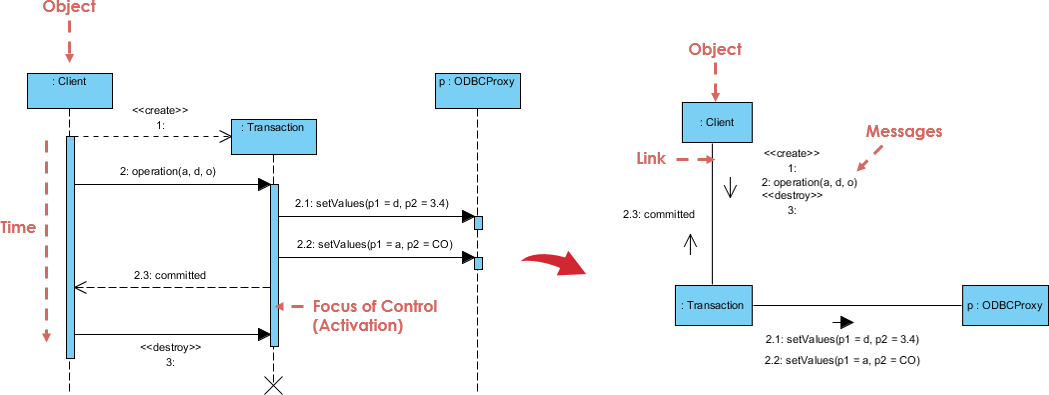
Mapping rule:
-
Every activation bar in the sequence diagram becomes a level of decimal nesting in the communication diagram.
-
If a lifeline has two nested activations, you will see sequence numbers like
1,1.1,1.1.1.
Conclusion
UML communication diagrams are not merely an alternative to sequence diagrams—they are a powerful tool for validating system architecture. By emphasizing links between objects, they force the designer to ensure that every message sent corresponds to an actual association in the class diagram. The decimal numbering system elegantly replaces focus-of-control rectangles, making nested calls explicit.
In practice, use sequence diagrams when you need to present a clear timeline of events to stakeholders. Use communication diagrams when you want to check the accuracy of your static model or when the spatial layout of objects matters more than the exact moment of each message. For the hotel reservation and library overdue examples above, the communication diagrams uncovered exactly which classes must supply which operations—turning interaction design into actionable class design.
Related Links
- What is Unified Modeling Language?
- Professional UML tool
- What is a Communication Diagram? – Visual Paradigm: An introduction to Communication Diagrams in UML, explaining their purpose in modeling interactions between objects as messages are passed. It covers the basic elements such as actors, objects, links, and message sequences.
- Collaboration Diagram (Communication Diagram) – Visual Paradigm Gallery: A visual gallery entry showcasing examples of Collaboration (Communication) Diagrams, illustrating how different scenarios of object interactions are modeled in software design.
- Communication Diagram – Visual Paradigm Circle Documentation: Official documentation detailing the definition and usage of Communication Diagrams within the Visual Paradigm environment, including its relationship to System Modeling Language (SysML).
- AI Generates UML Communication Diagrams – Visual Paradigm Explore: An article discussing how artificial intelligence can be used to automatically generate UML Communication Diagrams, streamlining the diagramming process for developers.
- Limitations of Communication Diagrams – Visual Paradigm Forums: A community discussion on the forums addressing the limitations and challenges of using Communication Diagrams compared to other UML interaction diagrams like Sequence Diagrams.
- Communication Diagram – Visual Paradigm User Guide: A detailed section from the Visual Paradigm user manual explaining the structure and components of a Communication Diagram within the tool’s interface.
- How to Draw Communication Diagram – Visual Paradigm Tutorials: A step-by-step tutorial guide on how to create a Communication Diagram in Visual Paradigm, including instructions on adding actors, objects, links, and messages.
- Drawing Communication Diagrams – Visual Paradigm User Guide: Another reference from the user guide focusing specifically on the technical aspects of drawing Communication Diagrams, including editing tools and formatting options
