


Introduction
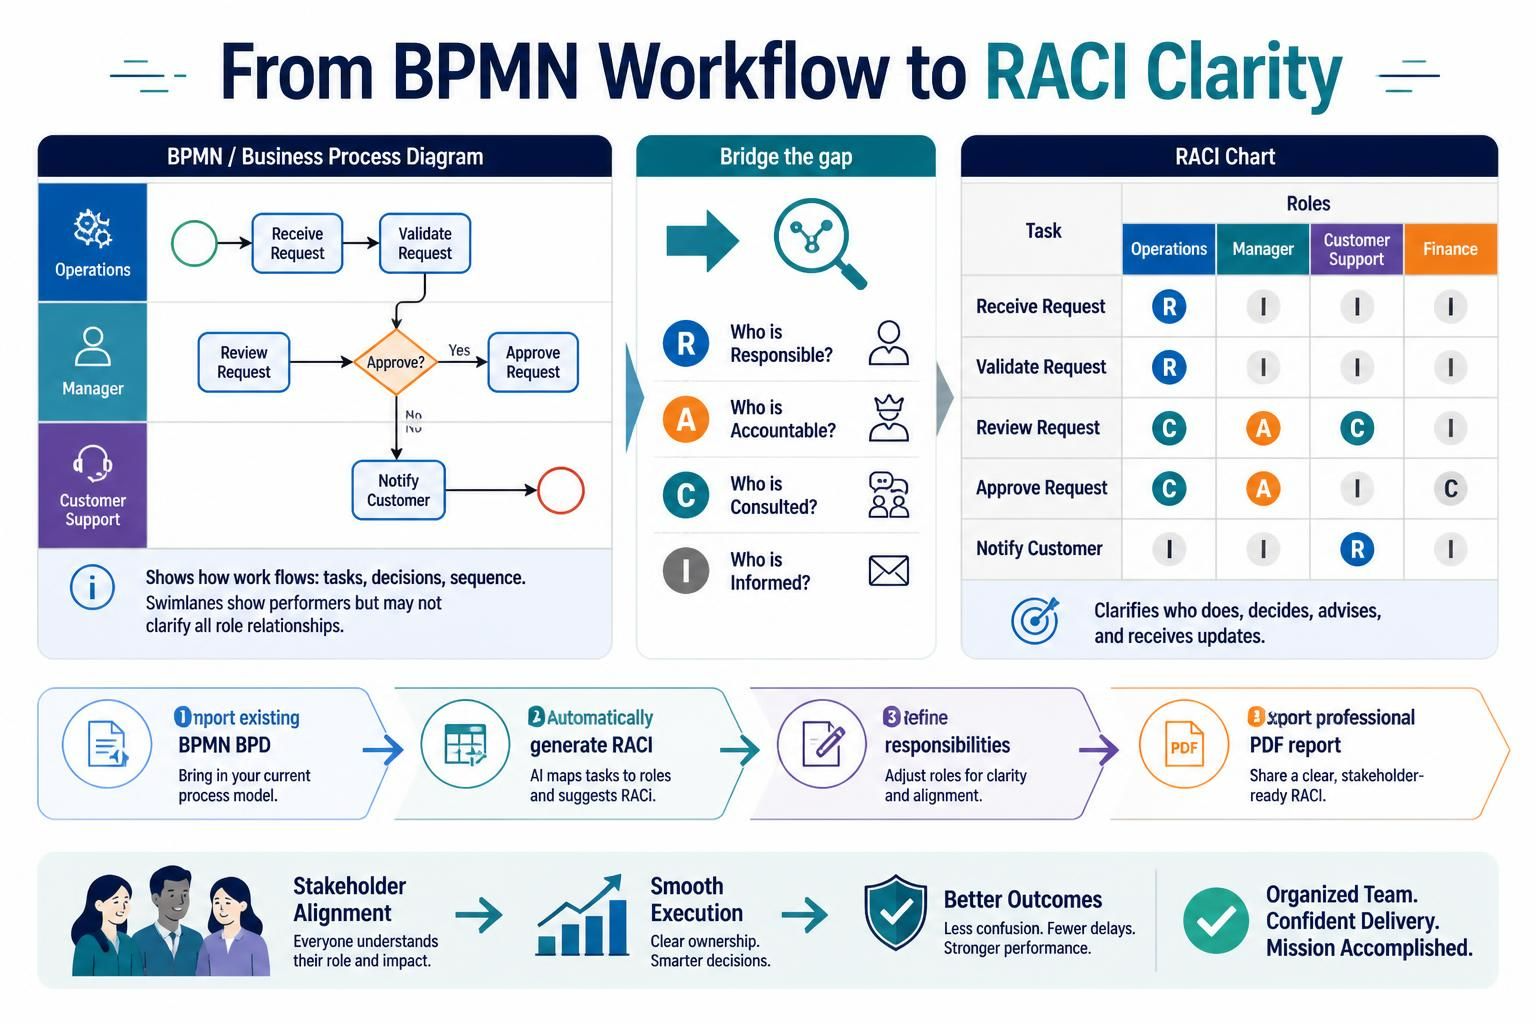
Business Process Model and Notation (BPMN) diagrams are excellent for visualizing the “how” of a workflow—showing the sequence of tasks, decisions, and flows. However, they often fall short in clarifying the nuanced “who.” While a swimlane indicates who performs a task, it doesn’t explicitly show who needs to be consulted for advice, who holds final accountability, or who simply needs to be kept in the loop.
This is where the RACI chart becomes essential. By bridging the gap between process visualization and role-based accountability, teams can eliminate ambiguity and ensure smooth project execution. In this guide, we will explore how to use Visual Paradigm to automatically generate a RACI chart directly from your existing BPMN Business Process Diagrams (BPD), refine the responsibilities, and export the results into a professional PDF report for stakeholder alignment.
Key Concepts: Understanding RACI
Before diving into the tooling, it is crucial to understand the four pillars of the RACI matrix. This framework ensures that every task in your business process has clear ownership and communication lines.
| Letter | Role | Definition |
|---|---|---|
| R | Responsible | The participant who actually executes the task or activity. They do the work. |
| A | Accountable | The ultimate approving authority. This person verifies the completeness and correctness of the activity. There should generally be only one “A” per task. |
| C | Consulted | Subject matter experts or stakeholders who provide advisory input, feedback, or two-way communication before the task is completed. |
| I | Informed | Participants who need to be kept updated on progress or outcomes but do not actively contribute to the execution. This is typically one-way communication. |
Step-by-Step Guide: Generating RACI from BPMN
Visual Paradigm offers a seamless way to convert your visual workflow models into actionable responsibility matrices. Below is the comprehensive workflow for generating, customizing, and sharing these charts.
Phase 1: Preparation
To follow this guide, ensure you have Visual Paradigm installed. You can use the Enterprise, Professional, or Standard editions. For this demonstration, we will use a sample project containing an “Online Shop” business process diagram involving three key participants: Sales Officer, Manager, and Delivery Staff.
Phase 2: Automatic Generation
The power of Visual Paradigm lies in its ability to read the structural elements of your BPMN diagram—specifically the pools and lanes—to infer initial responsibilities.
-
Open your project file (e.g.,
online_shop.vpp). Locate your Business Process Diagram.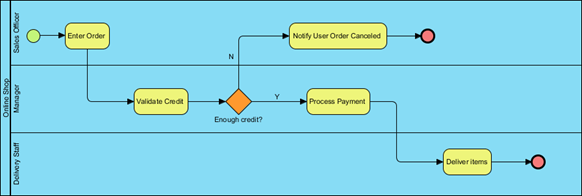
-
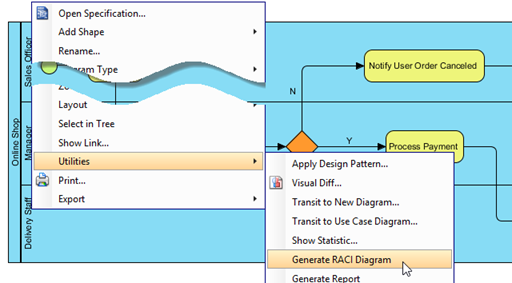
To initiate the generation, right-click on the blank background of the business process diagram. From the popup menu, navigate to Utilities > Generate RACI Diagram.
-
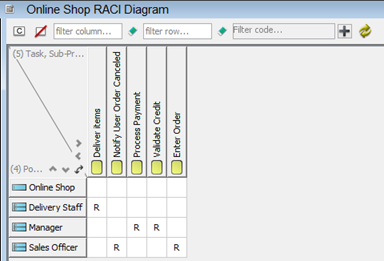
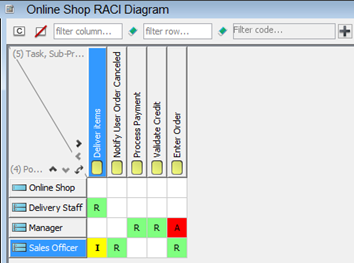
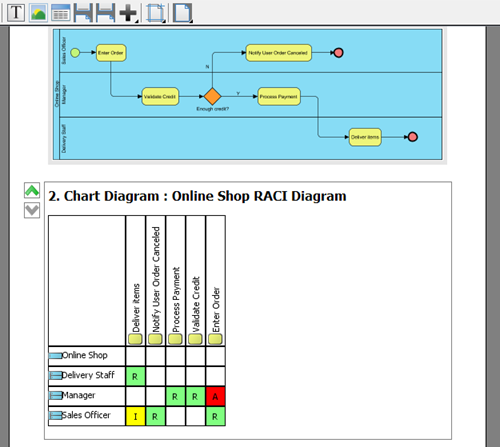
Visual Paradigm will instantly create a RACI chart. It evaluates the workflow and marks a participant as Responsible (R) if their corresponding pool or lane contains the task. This provides a solid baseline for your matrix.
Phase 3: Refining Responsibilities
While the “Responsible” role is mapped automatically based on swimlanes, the other roles (Accountable, Consulted, Informed) require manual input to reflect real-world collaboration dynamics.
-
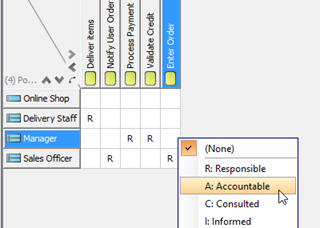
Adding Accountability: Suppose the Enter Order task requires final approval from the Manager. Right-click the specific cell where the Manager row intersects with the Enter Order column, and select Accountable from the popup menu. This marks the cell with an ‘A’.
-
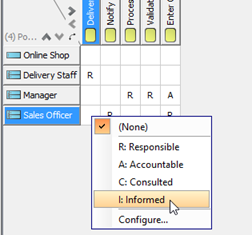
Adding Communication Lines: If the Delivery Staff needs to notify the Sales Officer once orders are shipped, this is an “Informed” relationship. Right-click the relevant cell and select Informed. This marks the cell with an ‘I’.
-
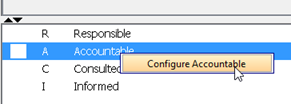
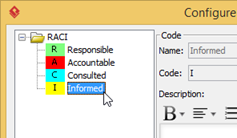
Enhancing Readability with Color: To make the chart easier to scan during meetings, you can assign specific colors to each responsibility code. Right-click on the code legend at the bottom of the chart (e.g., the ‘R’ symbol) and select Configure %code%.
-
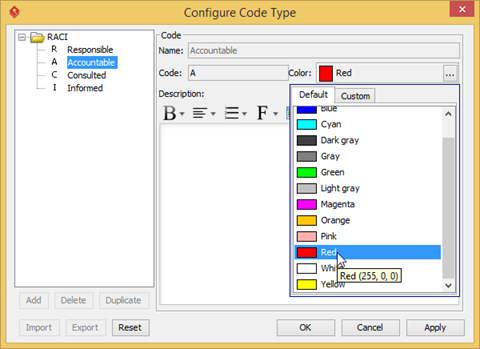
In the Configure Code Type dialog, click the … button next to the Color field to choose a distinct color for that responsibility type.
-
Repeat this process for Accountable, Consulted, and Informed codes to create a visually distinct legend.
-
Click OK to finalize your configuration. Your RACI chart now clearly displays both the workflow responsibilities and the communication hierarchy using color-coded indicators.
Phase 4: Exporting and Sharing via PDF Report
A RACI chart is most effective when shared with the entire team. Visual Paradigm’s Doc. Composer allows you to bundle your BPMN diagram and the new RACI chart into a single, professional PDF document.
-
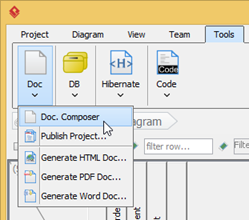
Navigate to Tools > Doc > Doc. Composer to open the reporting interface.
-
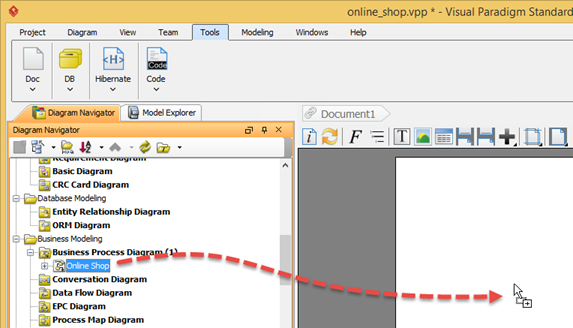
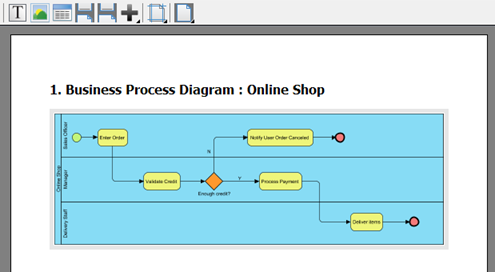
In the Diagram Navigator panel, locate your original process map under Business Modeling > Business Process Diagram. Drag the Online Shop diagram and drop it into the Report Composer canvas.
-
The visual representation of your business process will now appear in the document draft.
-
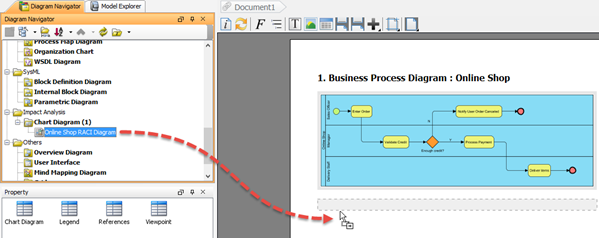
Next, find your newly created RACI chart under Impact Analysis > Chart Diagram in the Navigator. Drag the Online Shop RACI Diagram and drop it below the process map in the Composer.
-
Your report now contains both the workflow context and the responsibility matrix, providing a complete picture of the process.
-
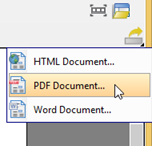
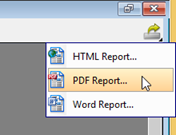
To finalize the document, click Export > PDF Report… located at the top right corner of the Report Composer window.
-
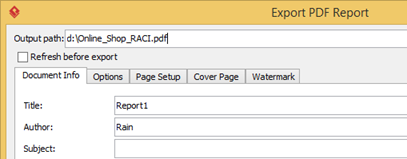
In the export dialog, specify the destination folder in the Output path field.
-
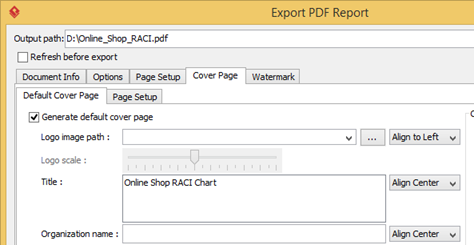
Switch to the Cover Page tab to customize the document metadata. Change the Title to something descriptive, such as Online Shop RACI Chart.
-
Press the Export button. Visual Paradigm will generate the PDF, which you can now email to stakeholders or upload to your project repository.
Alternative Methods for RACI Creation
While generating from BPMN is efficient for existing workflows, Visual Paradigm offers other ways to create RACI matrices depending on your needs:
-
Custom Chart Diagrams: If you are not using BPMN, you can build a matrix from scratch by selecting Modeling > Impact Analysis > Chart. This allows you to define custom rows (e.g., Team Members) and columns (e.g., Project Requirements) and manually assign RACI codes.
-
RACI Matrix App: For quick, standalone matrices without complex modeling, you can use the built-in app via Tools > Apps > RACI Matrix. This web-style interface allows for rapid data entry and exports to JSON or HTML.
Conclusion
Integrating RACI charts with BPMN diagrams transforms static process maps into dynamic tools for organizational clarity. By using Visual Paradigm to automate the initial mapping of “Responsible” parties and then manually refining the “Accountable,” “Consulted,” and “Informed” roles, you ensure that every stakeholder understands their part in the workflow. Exporting these insights into a shared PDF report further cements this understanding, reducing bottlenecks and improving cross-functional collaboration. Whether you are managing a simple online shop process or a complex enterprise workflow, this approach ensures that responsibility is never left to assumption.
Recommended Resources
Here are some relevant articles and guides for further exploring Visual Paradigm’s capabilities:
- How to Create an RACI Chart: A concise guide on building custom RACI matrices from scratch using the Chart Diagram feature.
- RACI Matrix Tool Overview: An overview of the standalone RACI Matrix app, detailing its features for quick team alignment and data export.
- BPMN Diagram and Tools: A comprehensive look at Visual Paradigm’s BPMN capabilities, including swimlanes, pools, and integration with other modeling tools.
- Ad-hoc Report Development with Report Composer: Learn more about customizing PDF reports, adding cover pages, and arranging multiple diagrams for professional documentation.
Related posts:
 Mastering Repetition in BPMN: A Practical Guide to Loops and Multi-Instance Activities
 Step-by-Step Guide: Mapping Employee Onboarding Workflows with AI
 The Ultimate Guide to AI-Powered BPMN 2.0 Diagramming with Visual Paradigm
 Bridging the Gap: A Comprehensive Guide to As-Is and To-Be Process Modeling with Visual Paradigm

 English
 Arabic
 Chinese (Simplified)
 Dutch
Dutch French
 German
 Italian
 Japanese
 Korean
 Portuguese
 Russian
 Spanish