


Introduction
Software architecture, workflows, data structures, and technical processes are easier to understand when they are represented visually. However, creating and maintaining diagrams manually can become slow, repetitive, and difficult to version.
Diagram-as-code offers a more efficient approach. Instead of positioning shapes by hand, you describe a diagram using structured text. A compatible rendering engine then converts that text into a visual model. This approach makes diagrams easier to update, store in source control, review, and reuse.
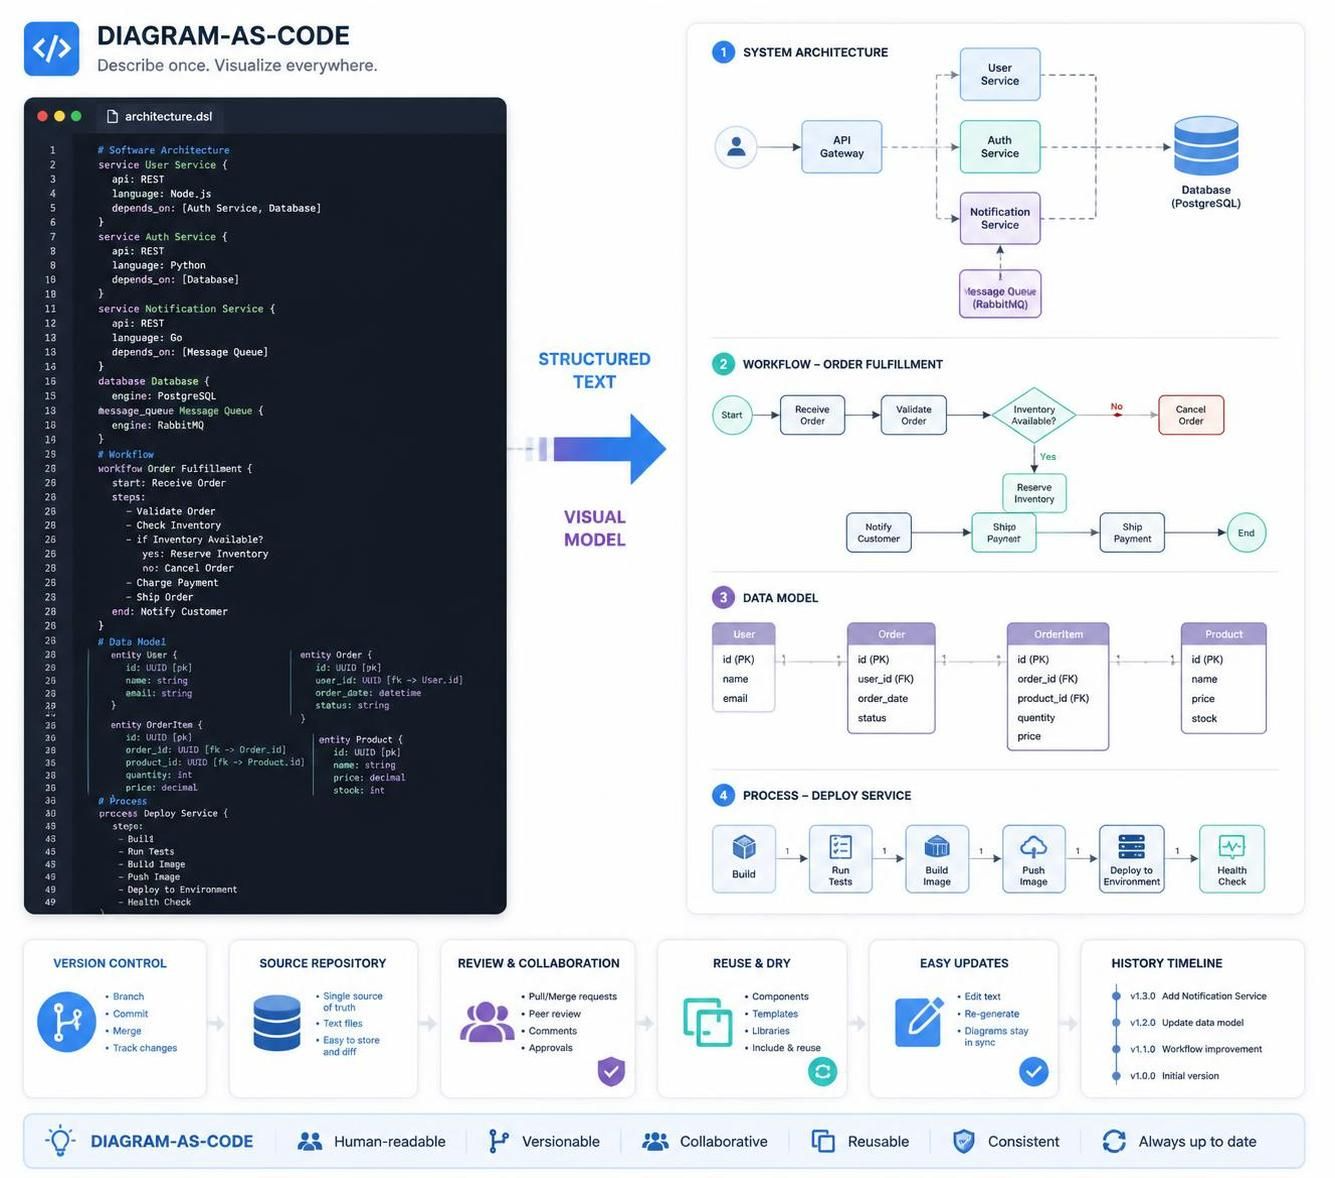
Visual Paradigm VPasCode brings this workflow into a browser-based workspace. It combines text-based diagramming, real-time previews, AI assistance, multiple diagram engines, image-to-code conversion, and integration with other Visual Paradigm tools.
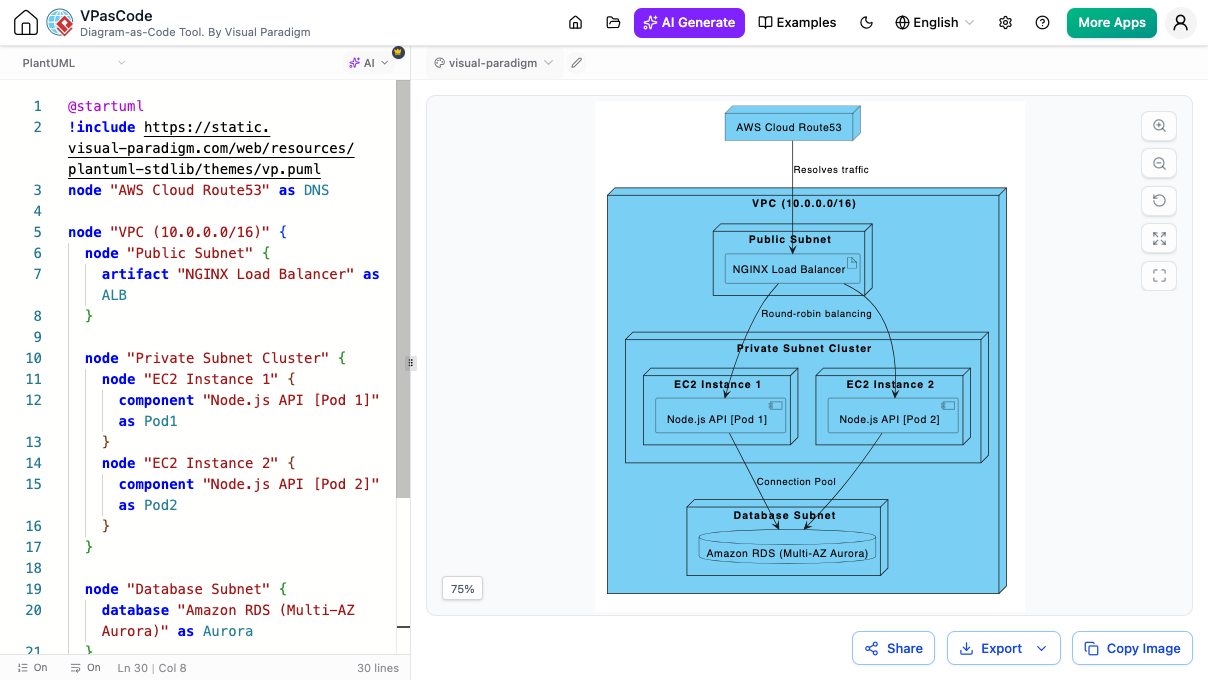
What Is Diagram-as-Code?
Diagram-as-code is the practice of creating visual models from text-based definitions rather than manually drawing every object on a canvas.
For example, a simple Mermaid flowchart can be written as:
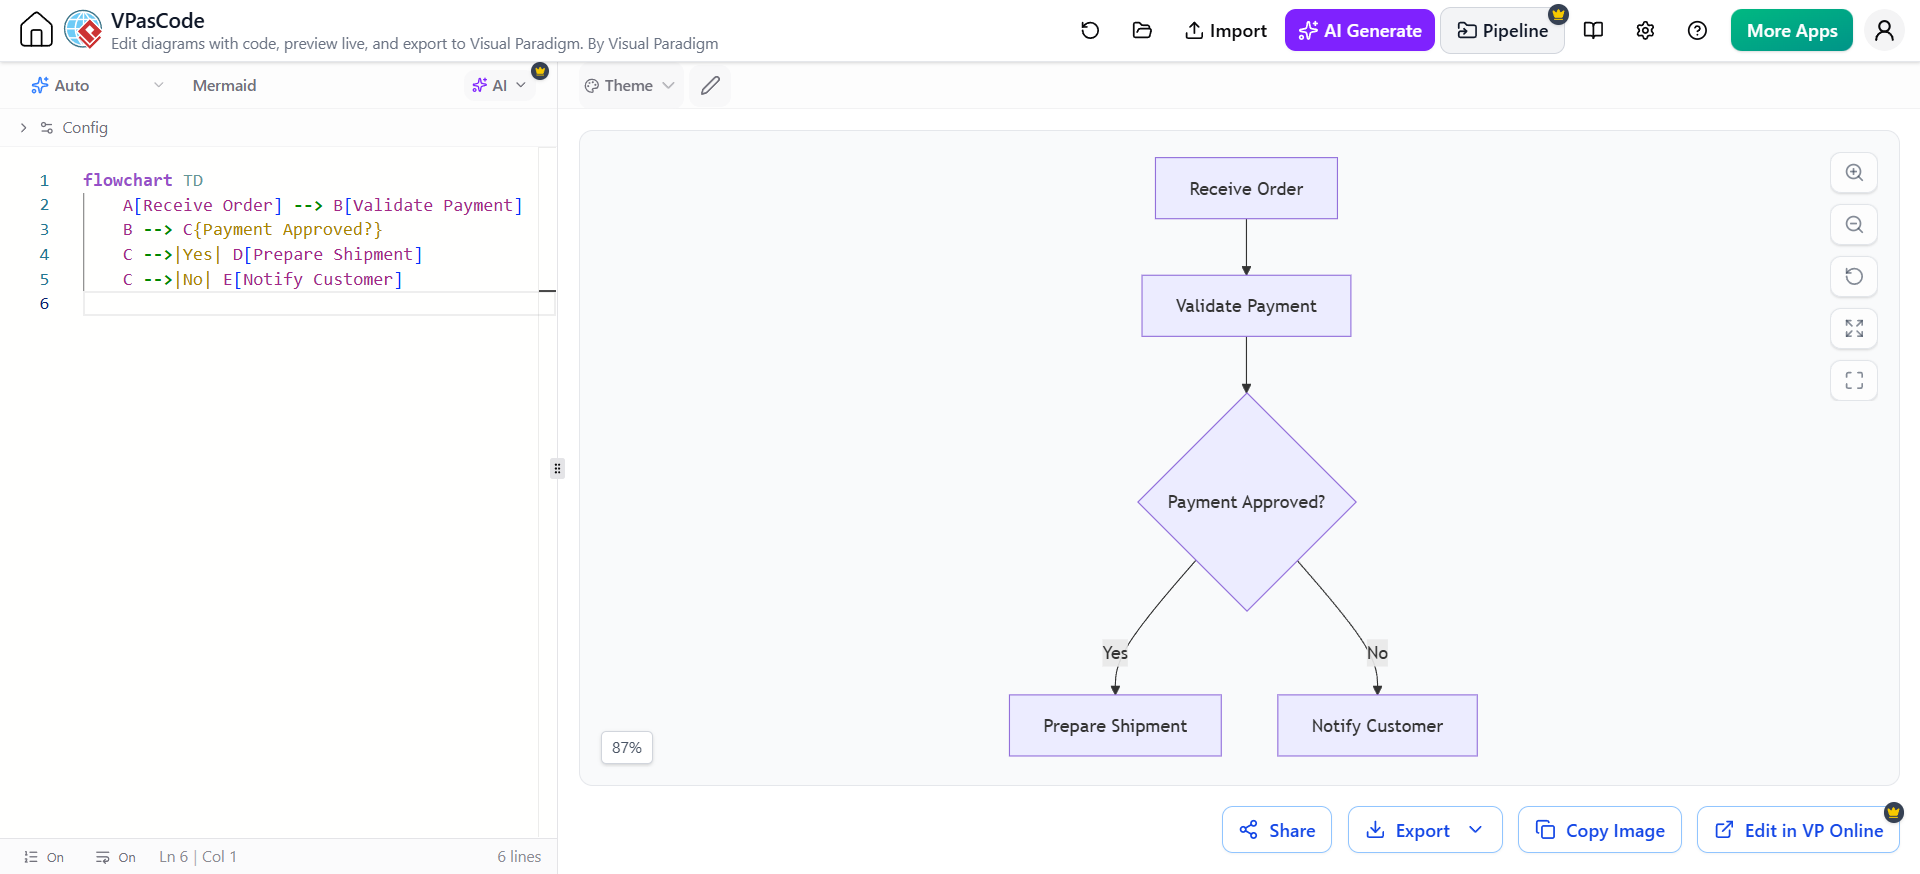
flowchart TD
    A[Receive Order] --> B[Validate Payment]
    B --> C{Payment Approved?}
    C -->|Yes| D[Prepare Shipment]
    C -->|No| E[Notify Customer]
The source code describes the logic, relationships, and labels. The diagramming engine determines how those elements are rendered.
This approach provides several practical advantages:
-
Version control: Diagram source files can be committed alongside application code.
-
Repeatability: Teams can recreate the same diagram consistently.
-
Maintainability: Changes are made by editing text instead of rearranging shapes.
-
Collaboration: Developers, architects, and technical writers can review diagram code.
-
Automation: Diagrams can become part of documentation and development workflows.
-
Scalability: Large diagrams can be updated through structured definitions.
Diagram-as-code is especially useful for system architecture, UML, database schemas, process flows, dependency maps, infrastructure layouts, and project plans.
The VPasCode Workspace
VPasCode is designed as a unified environment for writing, previewing, refining, sharing, and exporting diagrams.
The editor can automatically detect the diagram syntax being used and display a live visual preview as the source changes.
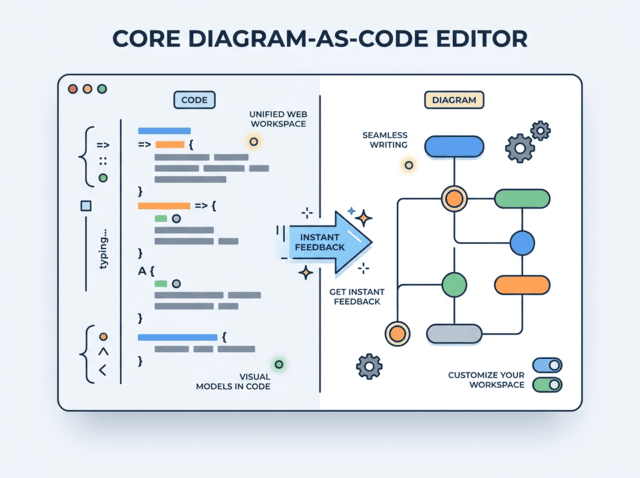
Core editor capabilities
The VPasCode editor supports:
-
Automatic format detection
-
Real-time diagram rendering
-
Light and dark workspace themes
-
Diagram styling and formatting
-
Code formatting and cleanup
-
Word wrapping
-
Shareable web links
-
Embed codes
-
PNG export
-
SVG export
-
Image copying for presentations and documents
The live preview is valuable because it allows authors to identify layout problems, missing relationships, syntax errors, and unclear labels while they are writing.
A practical editing workflow
A typical workflow looks like this:
-
Open the VPasCode editor.
-
Select or enter a supported diagram syntax.
-
Write or paste the diagram source.
-
Review the live preview.
-
Correct syntax and improve labels.
-
Apply a theme or styling options.
-
Share the diagram or export it as PNG or SVG.
-
Store the source with the relevant project documentation.
This workflow is faster than repeatedly moving shapes on a canvas, especially when the diagram is likely to change.
Key Concepts for Effective Diagramming
1. Source of truth
The diagram code should be treated as the primary version of the model. Exported images are useful for presentations and documents, but the source code should remain available for future updates.
For example, a system architecture repository might contain:
architecture/
├── context.puml
├── containers.puml
├── deployment.puml
└── README.md
The diagram files can be reviewed, modified, and tracked like other project assets.
2. Abstraction levels
Good architecture documentation usually presents information at multiple levels of detail.
The C4 Model provides a useful structure:
-
Context: Shows the system, users, and external systems.
-
Container: Shows major applications, services, databases, and stores.
-
Component: Shows the internal responsibilities of a container.
-
Code: Shows implementation-level structures such as classes or modules.
Start with the highest useful level of abstraction. Add detail only when it helps the audience make a decision or understand a dependency.
3. Diagram intent
Every diagram should answer a specific question.
Examples include:
-
How does a customer interact with the platform?
-
Which services process an order?
-
How does an API request move through the system?
-
Which tables store customer information?
-
What happens when payment fails?
-
Which team owns each component?
A diagram without a clear purpose often becomes overcrowded and difficult to maintain.
4. Consistent naming
Use names that match the terminology in the codebase, requirements, and technical documentation.
For example, if the application contains a service called OrderService, avoid naming the same component “Order Processing Module” in one diagram and “Purchase Handler” in another unless those terms represent different concepts.
5. Focused diagrams
A single diagram should not attempt to explain the entire organization, application, infrastructure, and database at once.
Prefer several focused diagrams:
-
System context
-
Service architecture
-
Authentication flow
-
Order-processing sequence
-
Database entity relationships
-
Deployment topology
Focused diagrams are easier to review and more useful to different audiences.
AI-Powered Diagram Creation
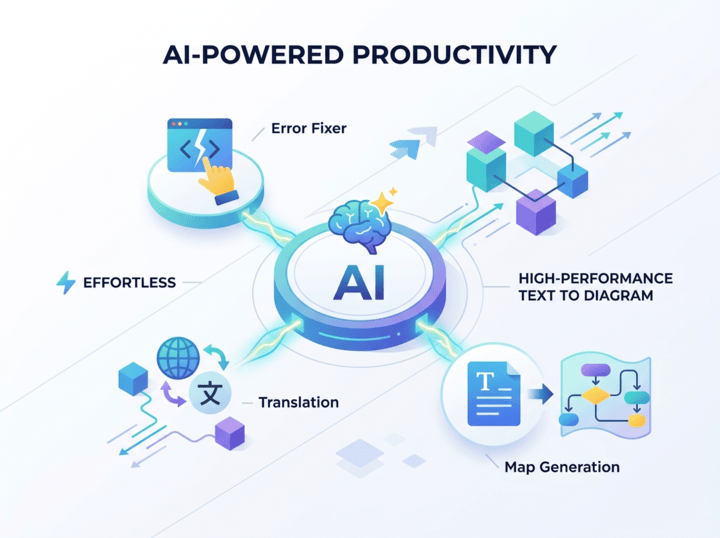
VPasCode includes AI-assisted features that reduce the amount of diagram syntax users need to write manually.
Generate diagrams from natural language
Users can describe a system, process, or workflow in plain language and use AI to generate an initial diagram script.
For example:
Create a deployment diagram for a web application with a browser client, a load balancer, two application servers, a PostgreSQL database, and a Redis cache.
The generated result should be treated as a starting point. Review the names, relationships, boundaries, and assumptions before using it as official documentation.
Modify existing diagrams
AI can also help update an existing diagram. Example instructions include:
-
Add a message queue between the order service and notification service.
-
Remove the legacy payment provider.
-
Group all data stores in a separate boundary.
-
Rename “Customer API” to “Account API.”
-
Add a failure path for unavailable inventory.
-
Translate all labels into Spanish.
This makes iterative diagram editing more accessible to users who are familiar with the system but less comfortable with diagram syntax.
Correct diagram code
Syntax problems can prevent a diagram from rendering. Common causes include:
-
Missing punctuation
-
Incorrect keywords
-
Invalid nesting
-
Unclosed blocks
-
Unsupported relationships
-
Incorrect identifier names
-
Incompatible syntax between diagram engines
An AI error-resolution feature can help identify the problem, explain the correction, and provide a revised version through a side-by-side code comparison.
Translate labels and comments
Technical teams working across regions can translate diagram labels, titles, and comments while preserving the diagram structure.
This is useful for:
-
Multilingual technical documentation
-
International project teams
-
Customer-facing architecture presentations
-
Training materials
-
Regional deployment documentation
Review translated terminology carefully, especially for domain-specific terms, product names, and legal or operational language.
Supported Diagram Engines and Formats
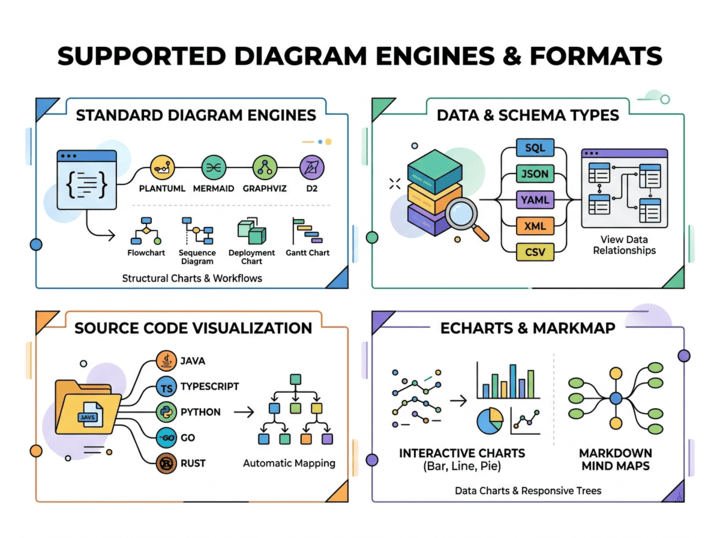
VPasCode brings multiple diagramming syntaxes and data formats into one workspace.
PlantUML
PlantUML is well suited to formal software modeling and UML documentation.
Common uses include:
-
Use case diagrams
-
Class diagrams
-
Sequence diagrams
-
Activity diagrams
-
State diagrams
-
Component diagrams
-
Deployment diagrams
-
C4 architecture diagrams
-
ArchiMate diagrams
Example:
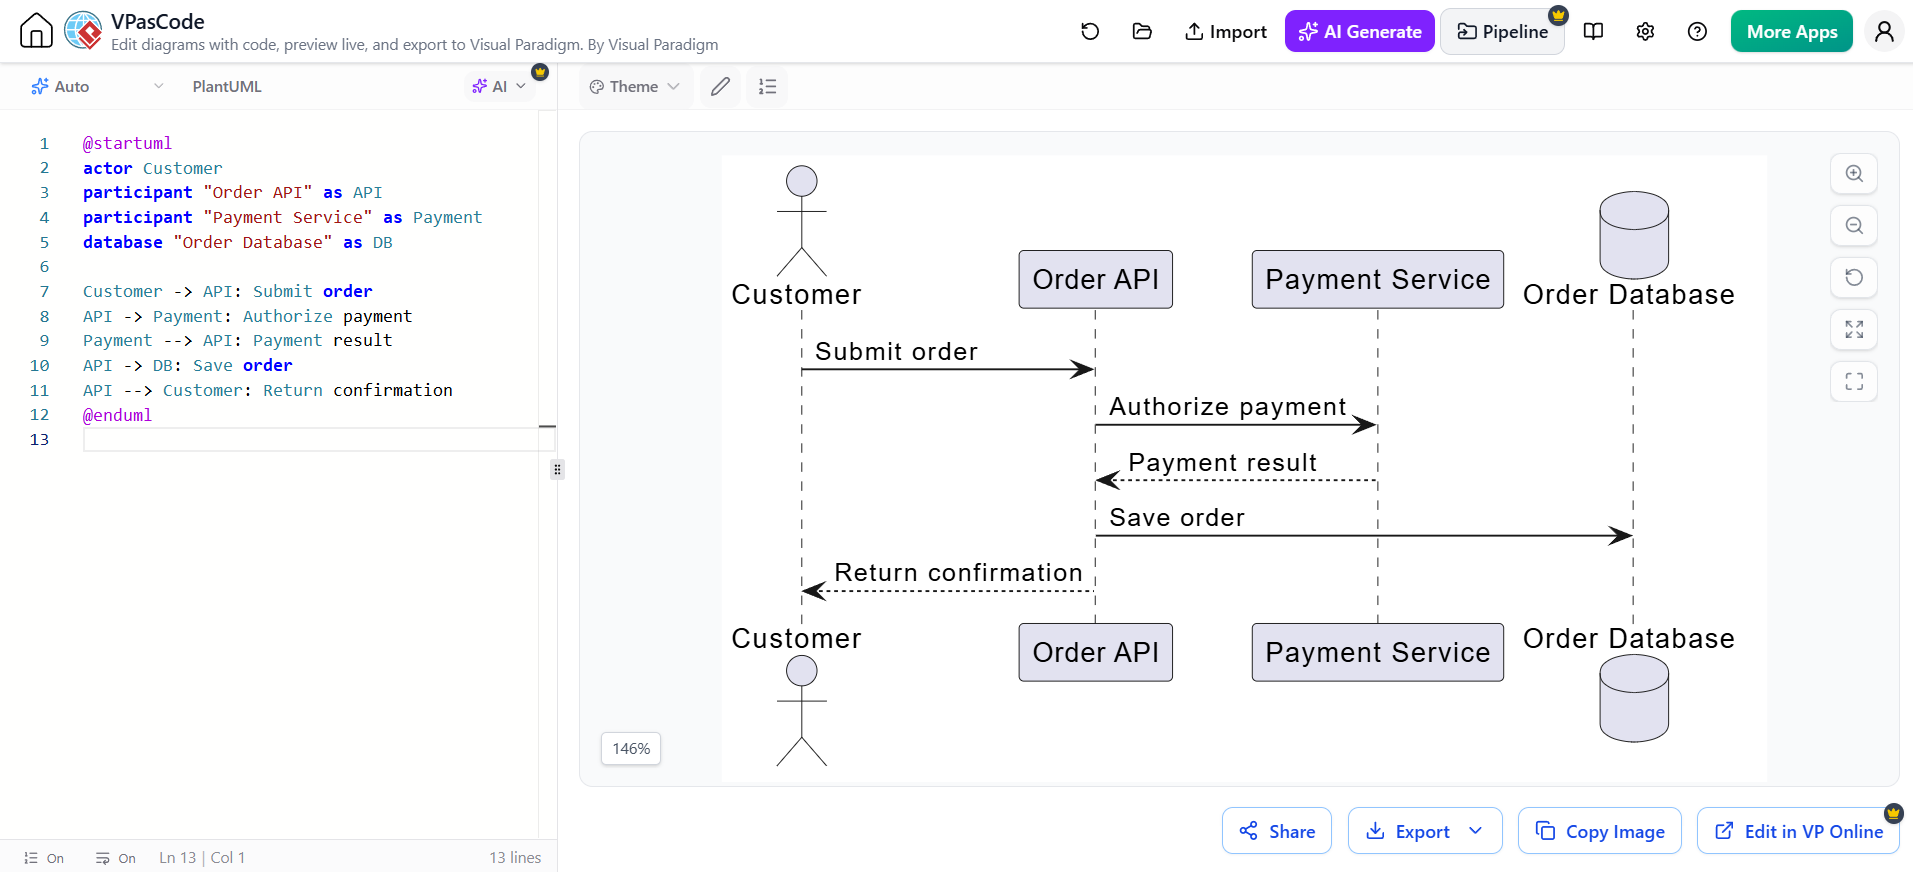
@startuml
actor Customer
participant "Order API" as API
participant "Payment Service" as Payment
database "Order Database" as DB

Customer -> API: Submit order
API -> Payment: Authorize payment
Payment --> API: Payment result
API -> DB: Save order
API --> Customer: Return confirmation
@enduml
PlantUML is a strong choice when diagrams need detailed relationships, formal notation, and long-term technical maintenance.
Mermaid
Mermaid is useful for lightweight diagrams embedded in Markdown documentation, repositories, wikis, and project notes.
It supports common diagram types such as:
-
Flowcharts
-
Sequence diagrams
-
State diagrams
-
Gantt charts
-
Class diagrams
-
Entity relationship diagrams
-
User journeys
Example:
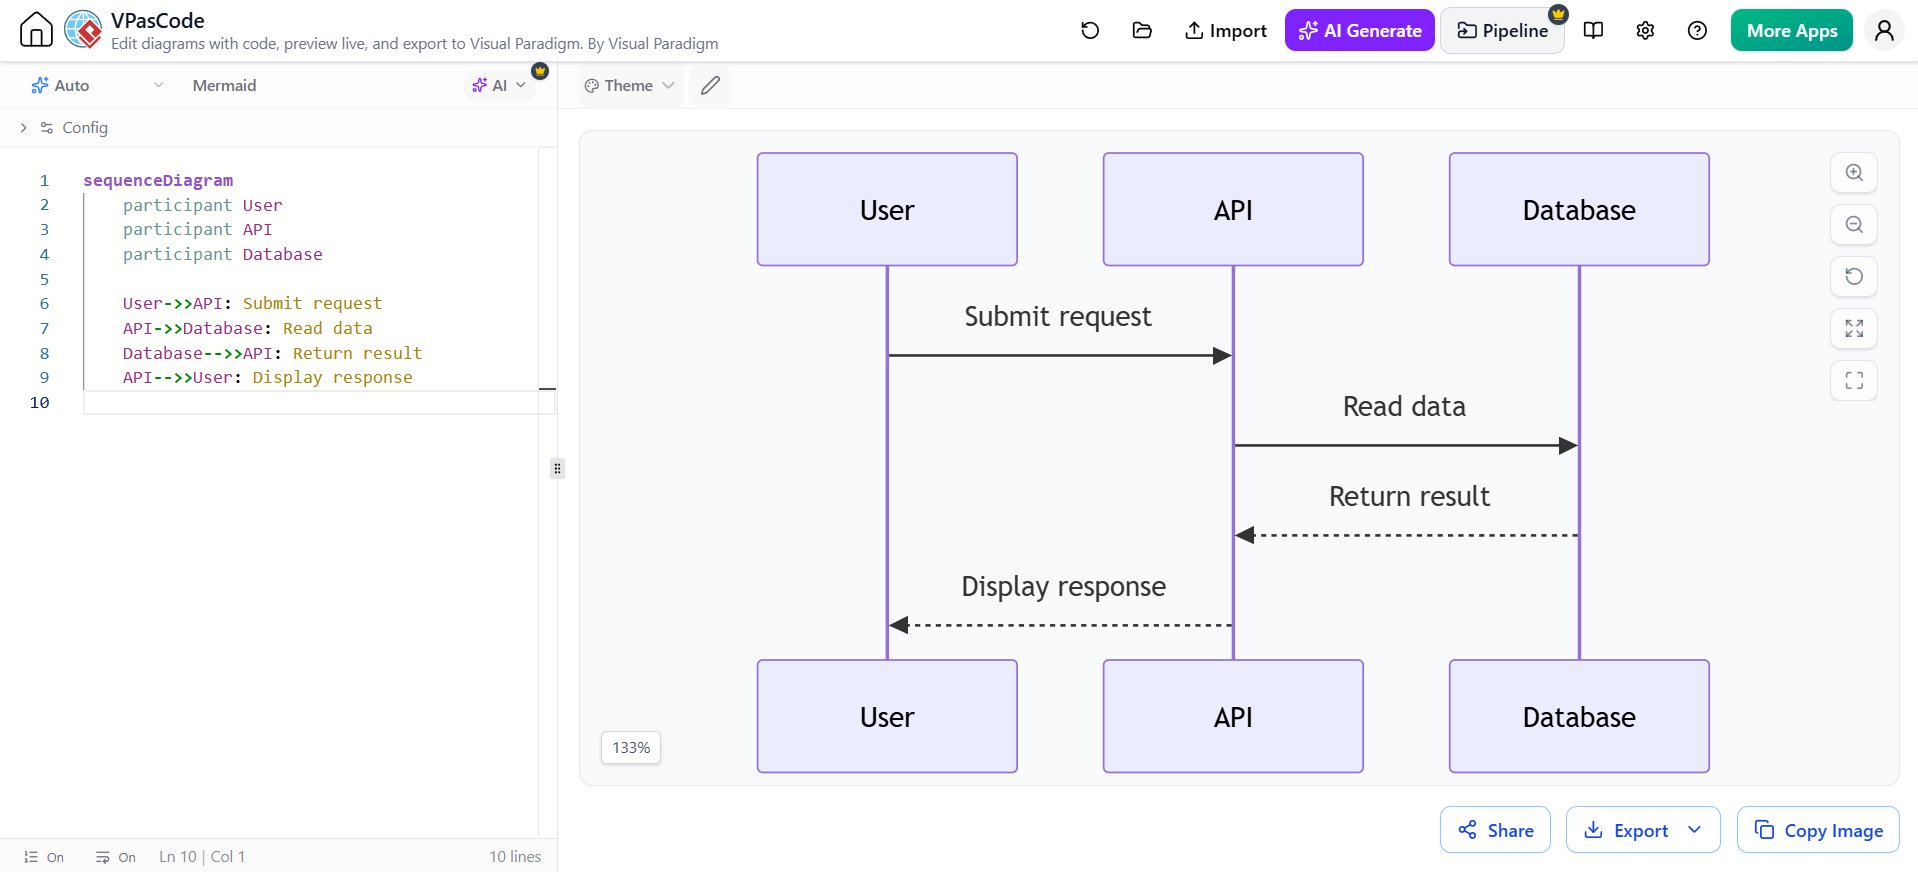
sequenceDiagram
    participant User
    participant API
    participant Database

    User->>API: Submit request
    API->>Database: Read data
    Database-->>API: Return result
    API-->>User: Display response
Mermaid is often a practical choice when simplicity and documentation portability are more important than highly detailed modeling.
Graphviz
Graphviz uses the DOT language and is particularly useful for relationship-heavy diagrams.
Typical applications include:
-
Dependency graphs
-
Network diagrams
-
Organizational structures
-
Call graphs
-
Data relationships
-
Process networks
Example:
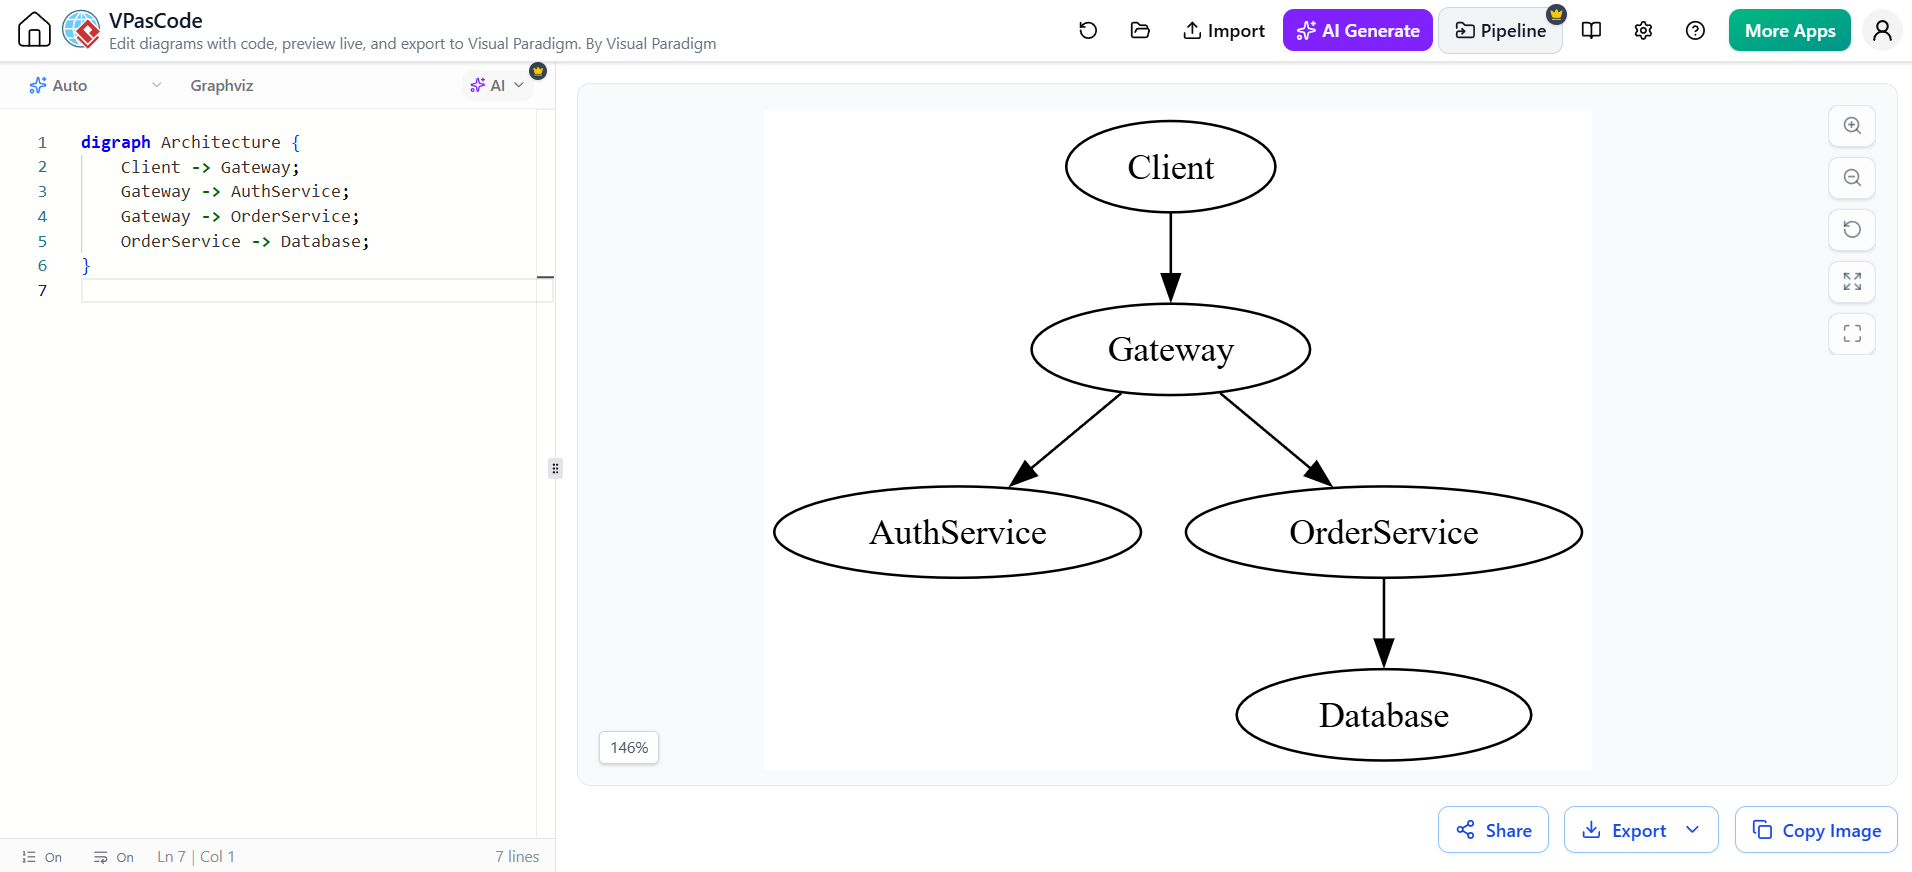
digraph Architecture {
    Client -> Gateway;
    Gateway -> AuthService;
    Gateway -> OrderService;
    OrderService -> Database;
}
D2
D2 is a modern diagramming language designed for readable, developer-friendly diagram definitions. It can be used for system structures, workflows, relationships, and architecture sketches.
Markmap
Markmap converts Markdown-style lists into interactive mind maps.
Example:
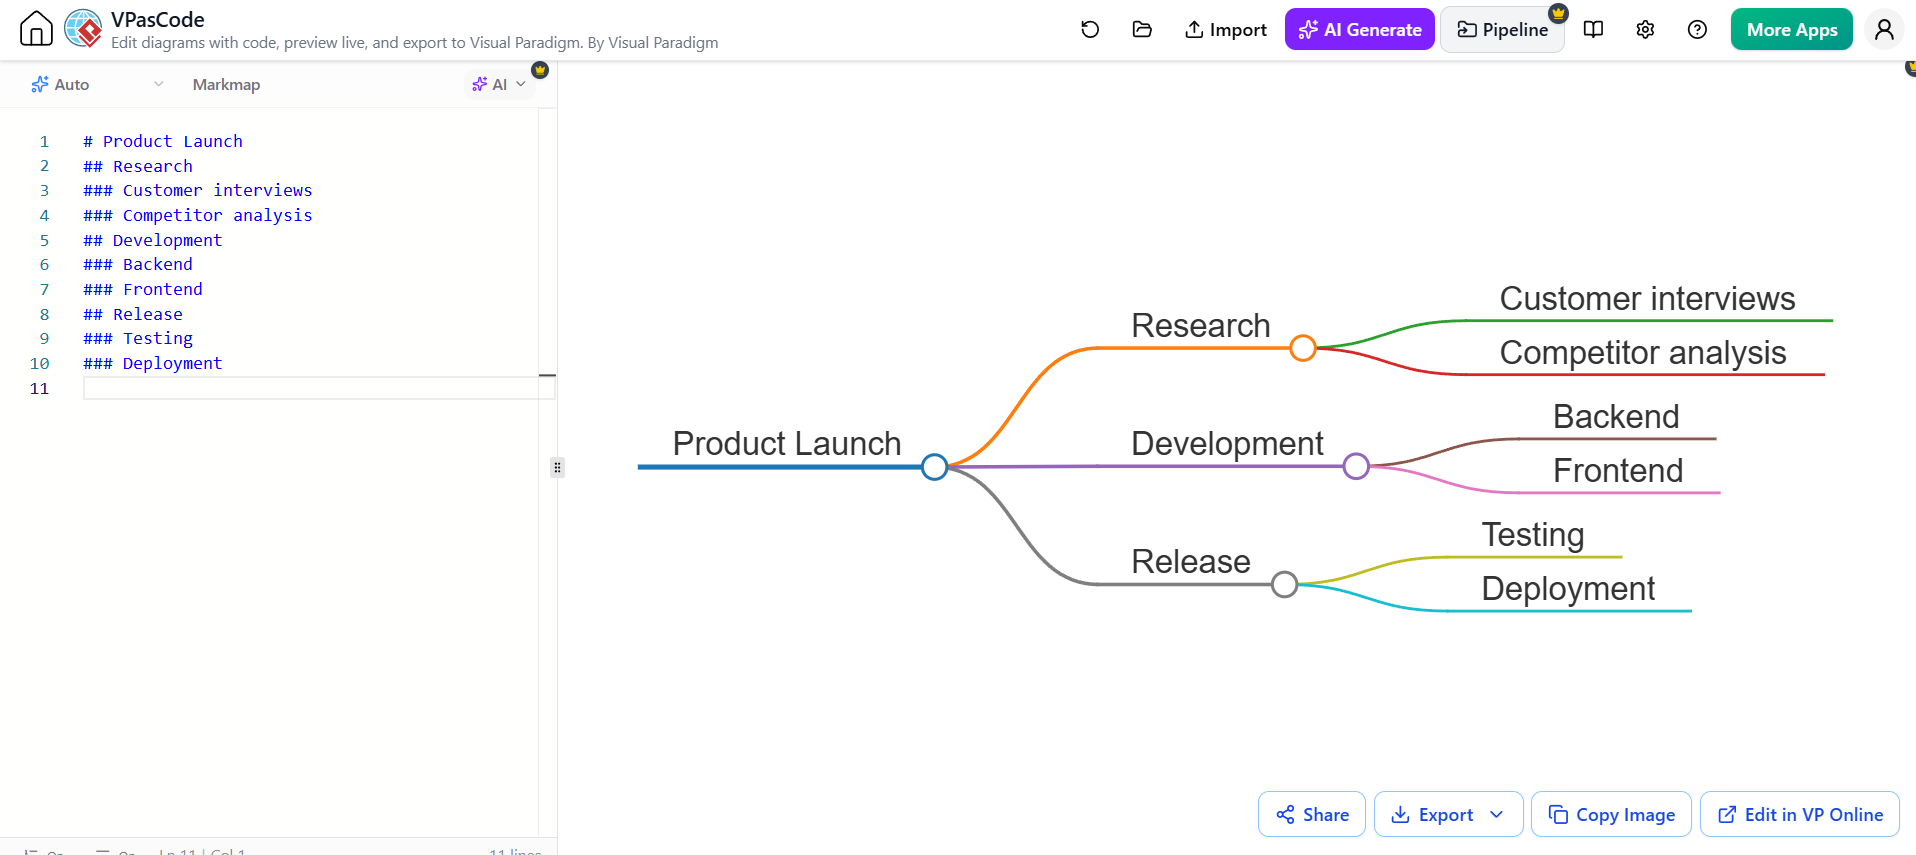
# Product Launch
## Research
### Customer interviews
### Competitor analysis
## Development
### Backend
### Frontend
## Release
### Testing
### Deployment
This is useful for brainstorming, planning, documentation outlines, and knowledge structures.
ECharts
ECharts supports data visualization such as:
-
Bar charts
-
Line charts
-
Pie charts
-
Scatter plots
-
Area charts
-
Multi-series visualizations
It can help teams move from structured data or configuration to visual reporting assets.
Data and schema formats
VPasCode can also work with structured data and source content, including:
-
SQL
-
JSON
-
YAML
-
XML
-
CSV
-
Java
-
TypeScript
-
Python
-
Go
-
Rust
These inputs can be used to visualize relationships, data structures, dependencies, or source-code organization.
Choosing the Right Diagram Engine
| Requirement | Recommended format | Why |
|---|---|---|
| Formal UML modeling | PlantUML | Supports many UML diagram types and detailed relationships |
| Markdown documentation | Mermaid | Simple syntax and easy embedding |
| Dependency or network analysis | Graphviz | Strong graph-oriented layout capabilities |
| Modern architecture sketches | D2 | Readable syntax and flexible visual styling |
| Brainstorming and hierarchical notes | Markmap | Converts Markdown lists into expandable mind maps |
| Business and technical data visualization | ECharts | Supports interactive chart types |
| Database relationships | SQL, ERD syntax, or supported diagram formats | Helps visualize tables, keys, and relationships |
| Infrastructure and application architecture | PlantUML, Mermaid, or D2 | Supports services, dependencies, and deployment structures |
A team does not need to force every diagram into one language. The best format depends on the diagram’s purpose, audience, destination, and level of detail.
Image-to-Code Conversion for C4 Models
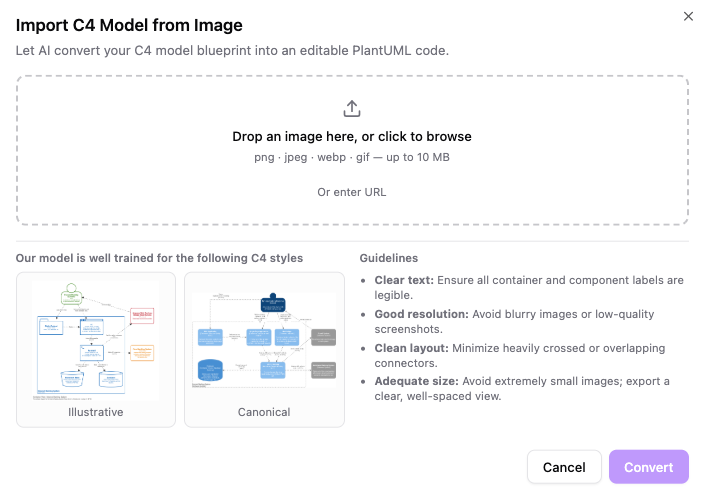
Existing architecture documentation is often available only as screenshots, exported images, slide graphics, or whiteboard photographs. Recreating these diagrams manually can take significant time.
VPasCode’s AI-powered C4 image import is designed to convert static architecture images into editable PlantUML C4 code.
Supported workflow
-
Upload a PNG, WEBP, GIF, or JPEG image.
-
Alternatively, provide a direct image URL.
-
Allow the AI system to identify architectural elements.
-
Review the generated PlantUML C4 source.
-
Compare the original image with the rendered result.
-
Correct names, relationships, boundaries, or missing elements.
-
Continue editing the diagram as code.
-
Send the result to documentation or modeling tools.
Example use cases
Image-to-code conversion can help with:
-
Migrating legacy architecture documentation
-
Converting whiteboard designs into reusable source
-
Updating diagrams created in presentation software
-
Preserving architecture history
-
Extracting structure from screenshots
-
Creating editable documentation from static assets
The generated code should be reviewed carefully. Image recognition may misunderstand labels, crossing lines, grouping boundaries, or relationship directions.
Custom AI Endpoint Support
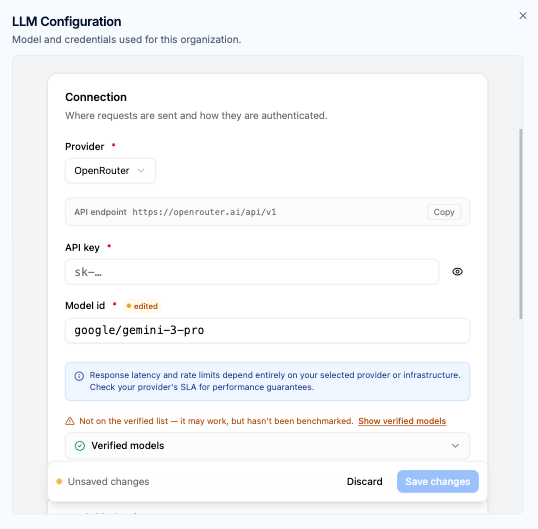
Organizations may need to connect diagramming workflows to approved AI providers, managed accounts, or internal infrastructure. VPasCode supports custom AI endpoint configuration for teams that require greater control over model selection and routing.
Supported provider categories include:
-
OpenAI
-
Anthropic
-
Google
-
DeepSeek
-
Mistral
-
Qwen
-
Enterprise cloud endpoints
Governance capabilities
Custom endpoint support can help organizations establish:
-
Workspace-wide AI configurations
-
Centralized API key management
-
Consistent model selection
-
Usage tracking
-
Data governance procedures
-
Security auditing
-
Operational fallback options
Selecting a model for the task
Different diagramming tasks may benefit from different model characteristics.
-
High-throughput models: Useful for quick label changes, formatting, and short diagram revisions.
-
High-reasoning models: Useful for complex architecture generation, code interpretation, and multi-tier system analysis.
-
Specialized models: Useful when a team has an approved provider for a particular technical domain.
Teams should define clear rules for which models can be used for drafts, internal documentation, customer-facing content, and sensitive enterprise workflows.
Connecting VPasCode with the Visual Paradigm Ecosystem
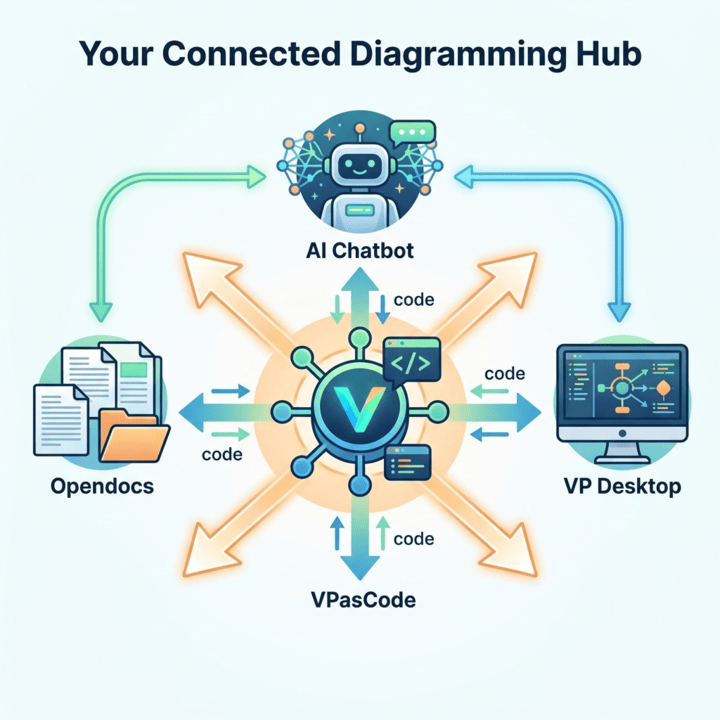
VPasCode can serve as a central diagramming layer between AI assistants, browser-based modeling, desktop modeling, and technical documentation.
AI chatbot to VPasCode
A useful workflow begins with an AI-generated draft:
-
Describe the system or process in natural language.
-
Generate PlantUML, Mermaid, Graphviz, or another supported format.
-
Open the source in VPasCode.
-
Review the live diagram.
-
Refine syntax and visual structure.
-
Share or publish the result.
VPasCode to OpenDocs
Once the diagram is ready, it can be connected to a documentation workflow.
This makes it possible to:
-
Publish diagrams with explanatory text
-
Keep source and visual output together
-
Build reusable technical pages
-
Share diagrams with project stakeholders
-
Maintain living documentation
VPasCode to Visual Paradigm Desktop
VP Desktop is useful when the work requires more extensive modeling, analysis, requirements management, or enterprise architecture activities.
A practical division of responsibilities is:
-
Use AI for brainstorming and first drafts.
-
Use VPasCode for fast text-based editing and previews.
-
Use Visual Paradigm Online for graphical refinement when needed.
-
Use Visual Paradigm Desktop for deeper modeling and lifecycle management.
-
Use OpenDocs for publishing and maintaining technical documentation.
Recommended Workflow for Architecture Teams
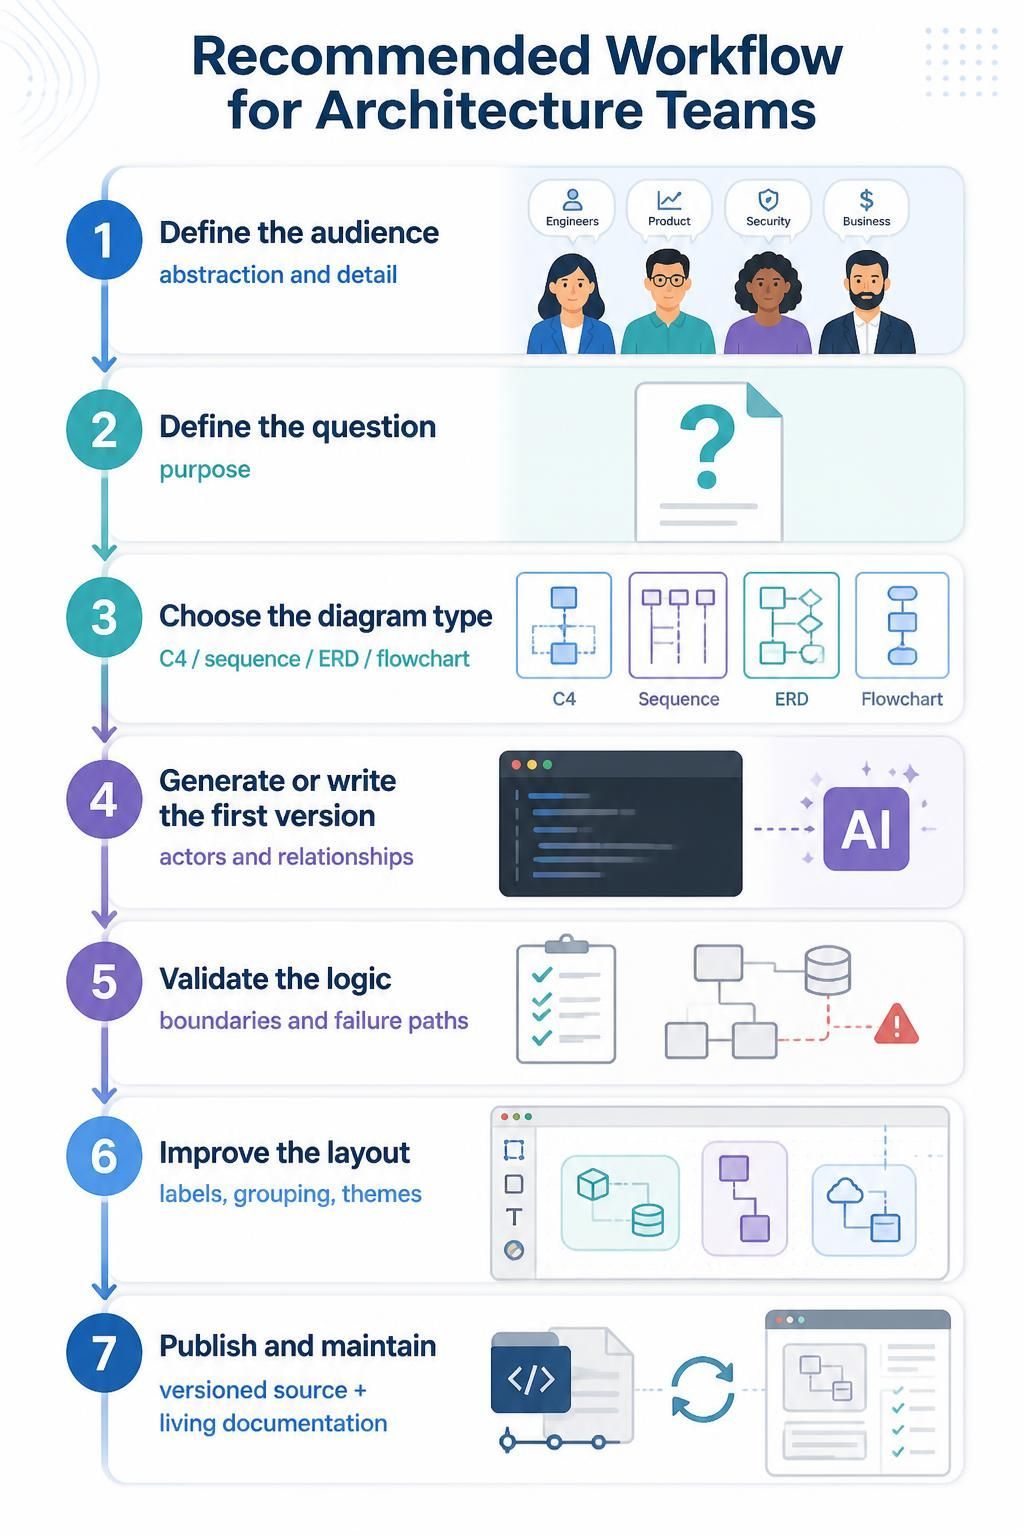
Step 1: Define the audience
Decide whether the diagram is intended for:
-
Developers
-
Architects
-
Product managers
-
Executives
-
Operations teams
-
Customers
-
Auditors
-
Students or trainees
The audience determines the level of abstraction and the amount of technical detail.
Step 2: Define the question
Write down the question the diagram should answer.
For example:
How does a user request move from the web application to the database?
This prevents unnecessary elements from being added.
Step 3: Choose the diagram type
Select the most appropriate notation:
-
C4 context diagram for system boundaries
-
Sequence diagram for interactions over time
-
Class diagram for object structures
-
Deployment diagram for infrastructure
-
ERD for database relationships
-
Flowchart for decisions and processes
-
Gantt chart for project planning
-
Mind map for brainstorming
Step 4: Generate or write the first version
Start with a small, readable diagram. If using AI, provide explicit details about:
-
Actors
-
Systems
-
Services
-
Data stores
-
Relationships
-
Direction of communication
-
Failure paths
-
Required notation
Step 5: Validate the logic
Check whether the diagram reflects the real system:
-
Are all important actors included?
-
Are relationships directed correctly?
-
Are system boundaries clear?
-
Do names match the codebase?
-
Are responsibilities assigned to the correct components?
-
Are external dependencies identified?
-
Are error paths represented where necessary?
Step 6: Improve the layout
Use grouping, labels, direction, spacing, and themes to make the diagram easier to read. Avoid adding decorative elements that do not improve understanding.
Step 7: Publish and maintain
Store the source with the project and publish the rendered diagram in the appropriate documentation location. Update both the source and the published documentation whenever the architecture changes.
Example: Modeling an Online Ordering System
The following example combines several common diagramming activities.
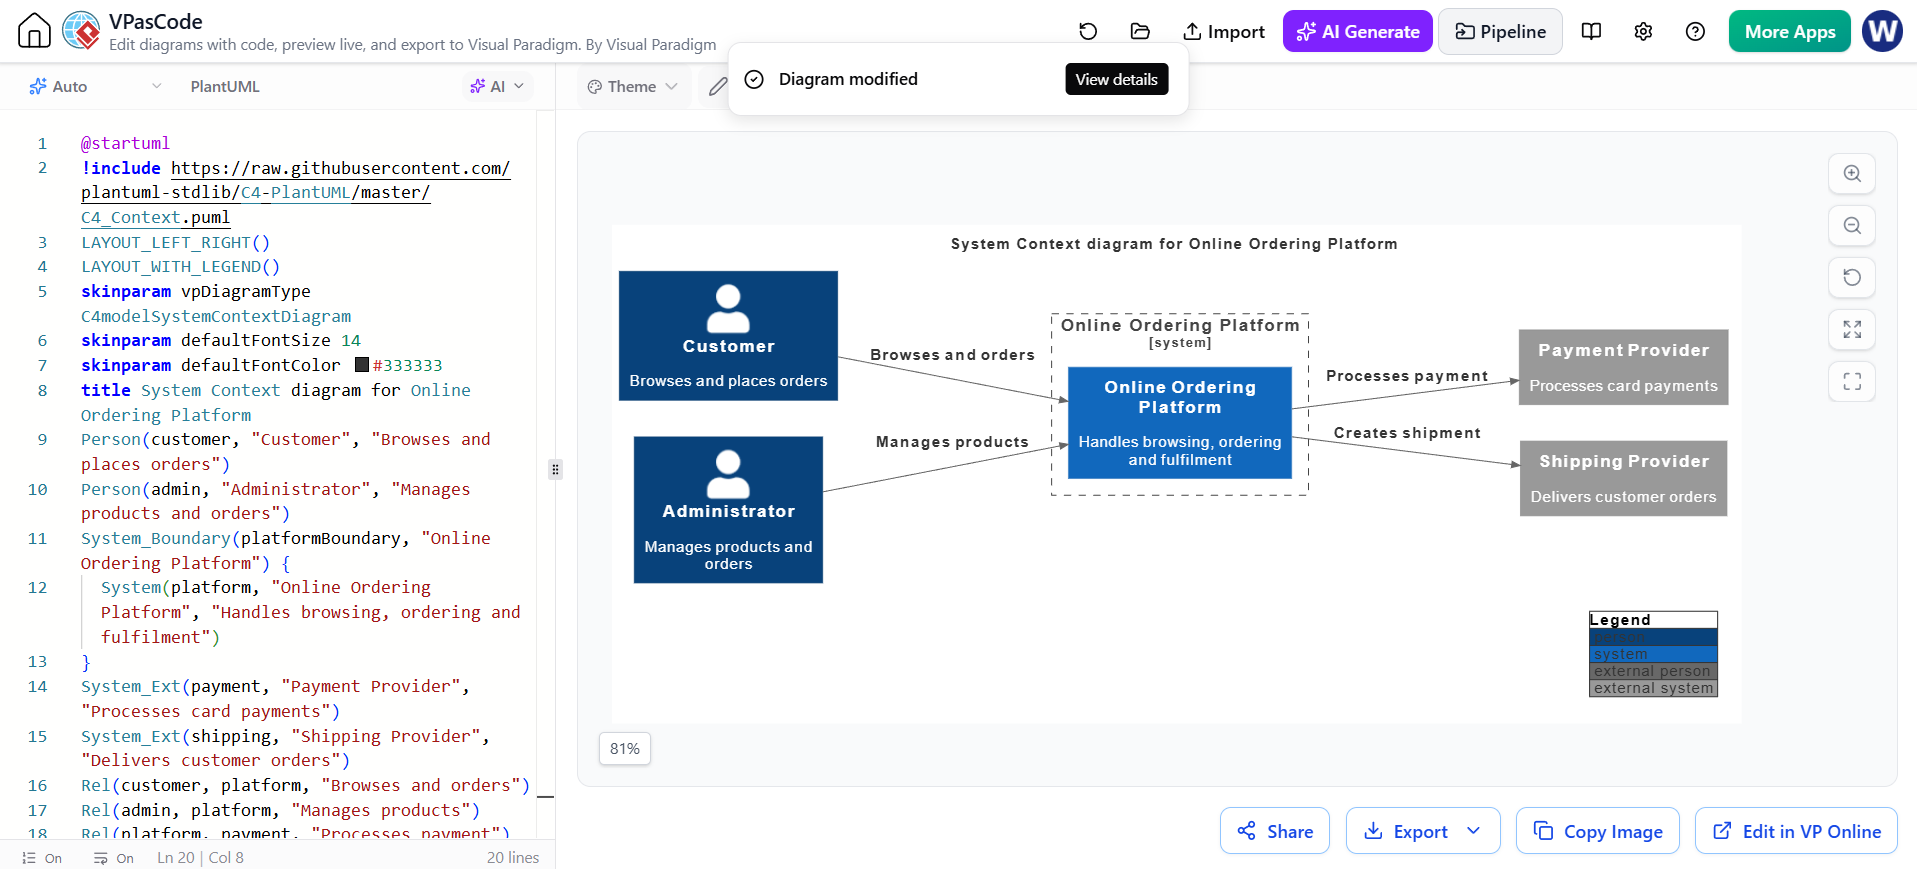
Context diagram
@startuml
!include https://raw.githubusercontent.com/plantuml-stdlib/C4-PlantUML/master/C4_Context.puml
LAYOUT_LEFT_RIGHT()
LAYOUT_WITH_LEGEND()
skinparam vpDiagramType C4modelSystemContextDiagram
skinparam defaultFontSize 14
skinparam defaultFontColor #333333
title System Context diagram for Online Ordering Platform
Person(customer, "Customer", "Browses and places orders")
Person(admin, "Administrator", "Manages products and orders")
System_Boundary(platformBoundary, "Online Ordering Platform") {
  System(platform, "Online Ordering Platform", "Handles browsing, ordering and fulfilment")
}
System_Ext(payment, "Payment Provider", "Processes card payments")
System_Ext(shipping, "Shipping Provider", "Delivers customer orders")
Rel(customer, platform, "Browses and orders")
Rel(admin, platform, "Manages products")
Rel(platform, payment, "Processes payment")
Rel(platform, shipping, "Creates shipment")
@endumlThis diagram explains the system boundary and external relationships without exposing internal implementation details.
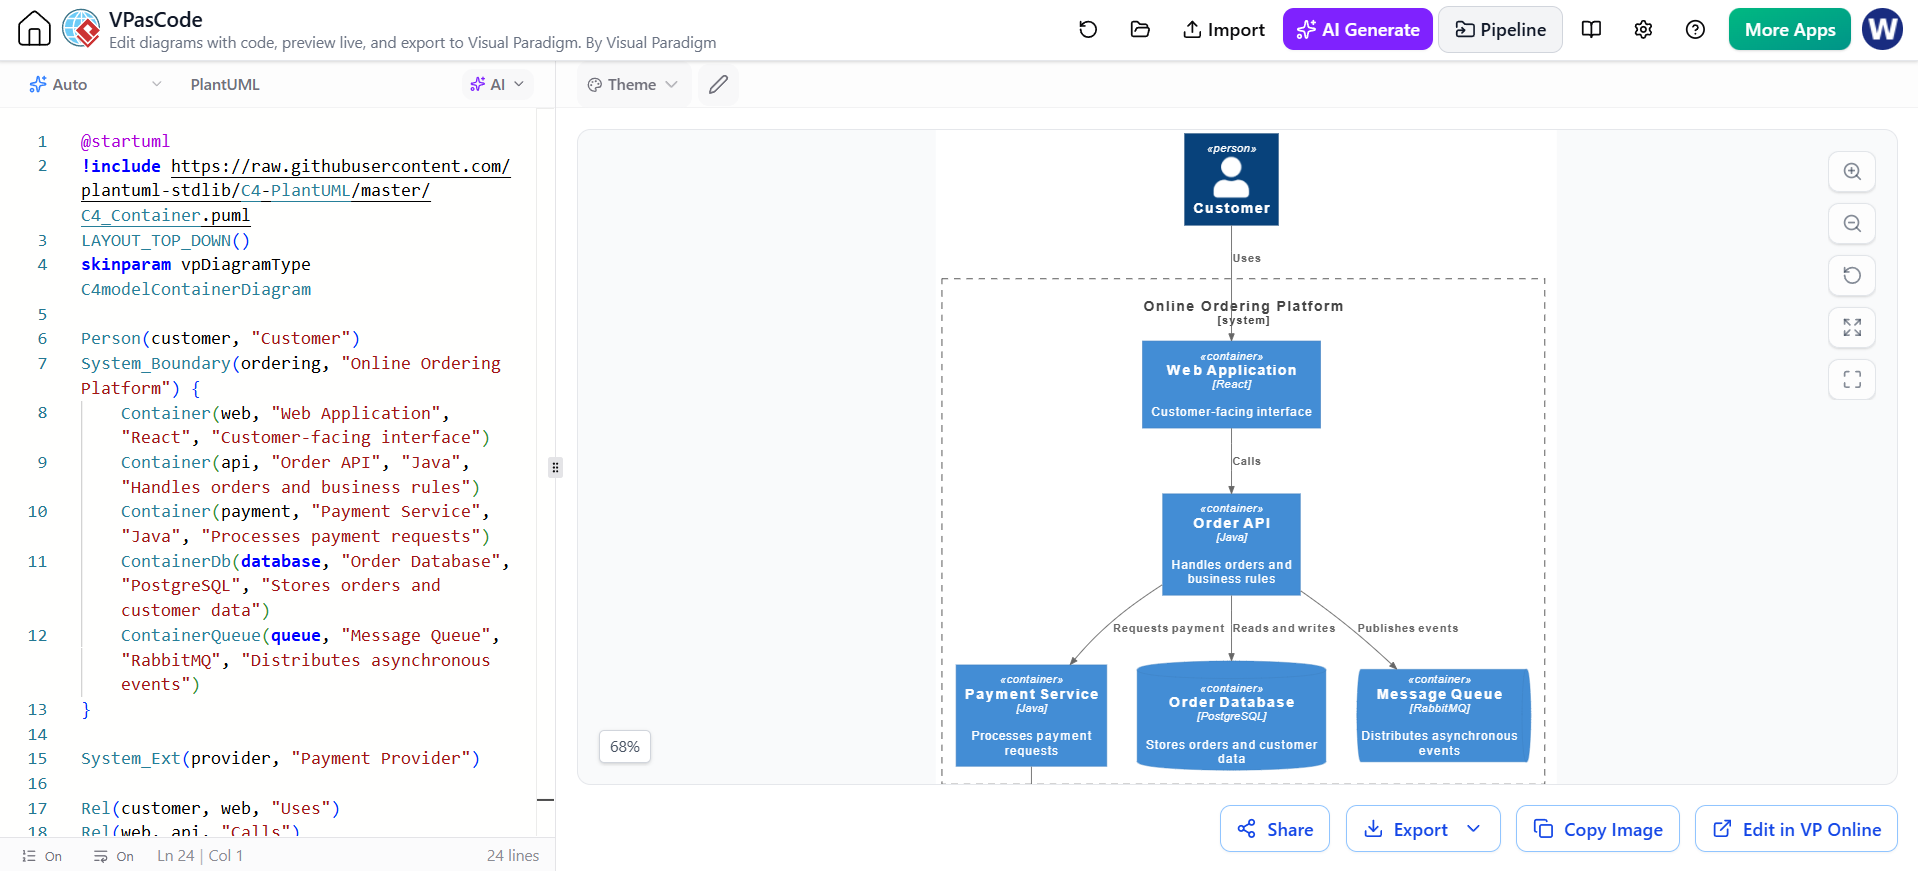
Container diagram
@startuml
!include https://raw.githubusercontent.com/plantuml-stdlib/C4-PlantUML/master/C4_Container.puml
LAYOUT_TOP_DOWN()
skinparam vpDiagramType C4modelContainerDiagram

Person(customer, "Customer")
System_Boundary(ordering, "Online Ordering Platform") {
    Container(web, "Web Application", "React", "Customer-facing interface")
    Container(api, "Order API", "Java", "Handles orders and business rules")
    Container(payment, "Payment Service", "Java", "Processes payment requests")
    ContainerDb(database, "Order Database", "PostgreSQL", "Stores orders and customer data")
    ContainerQueue(queue, "Message Queue", "RabbitMQ", "Distributes asynchronous events")
}

System_Ext(provider, "Payment Provider")

Rel(customer, web, "Uses")
Rel(web, api, "Calls")
Rel(api, payment, "Requests payment")
Rel(api, database, "Reads and writes")
Rel(api, queue, "Publishes events")
Rel(payment, provider, "Processes transactions")
@endumlThis view adds internal services while remaining understandable to technical stakeholders.
Sequence diagram
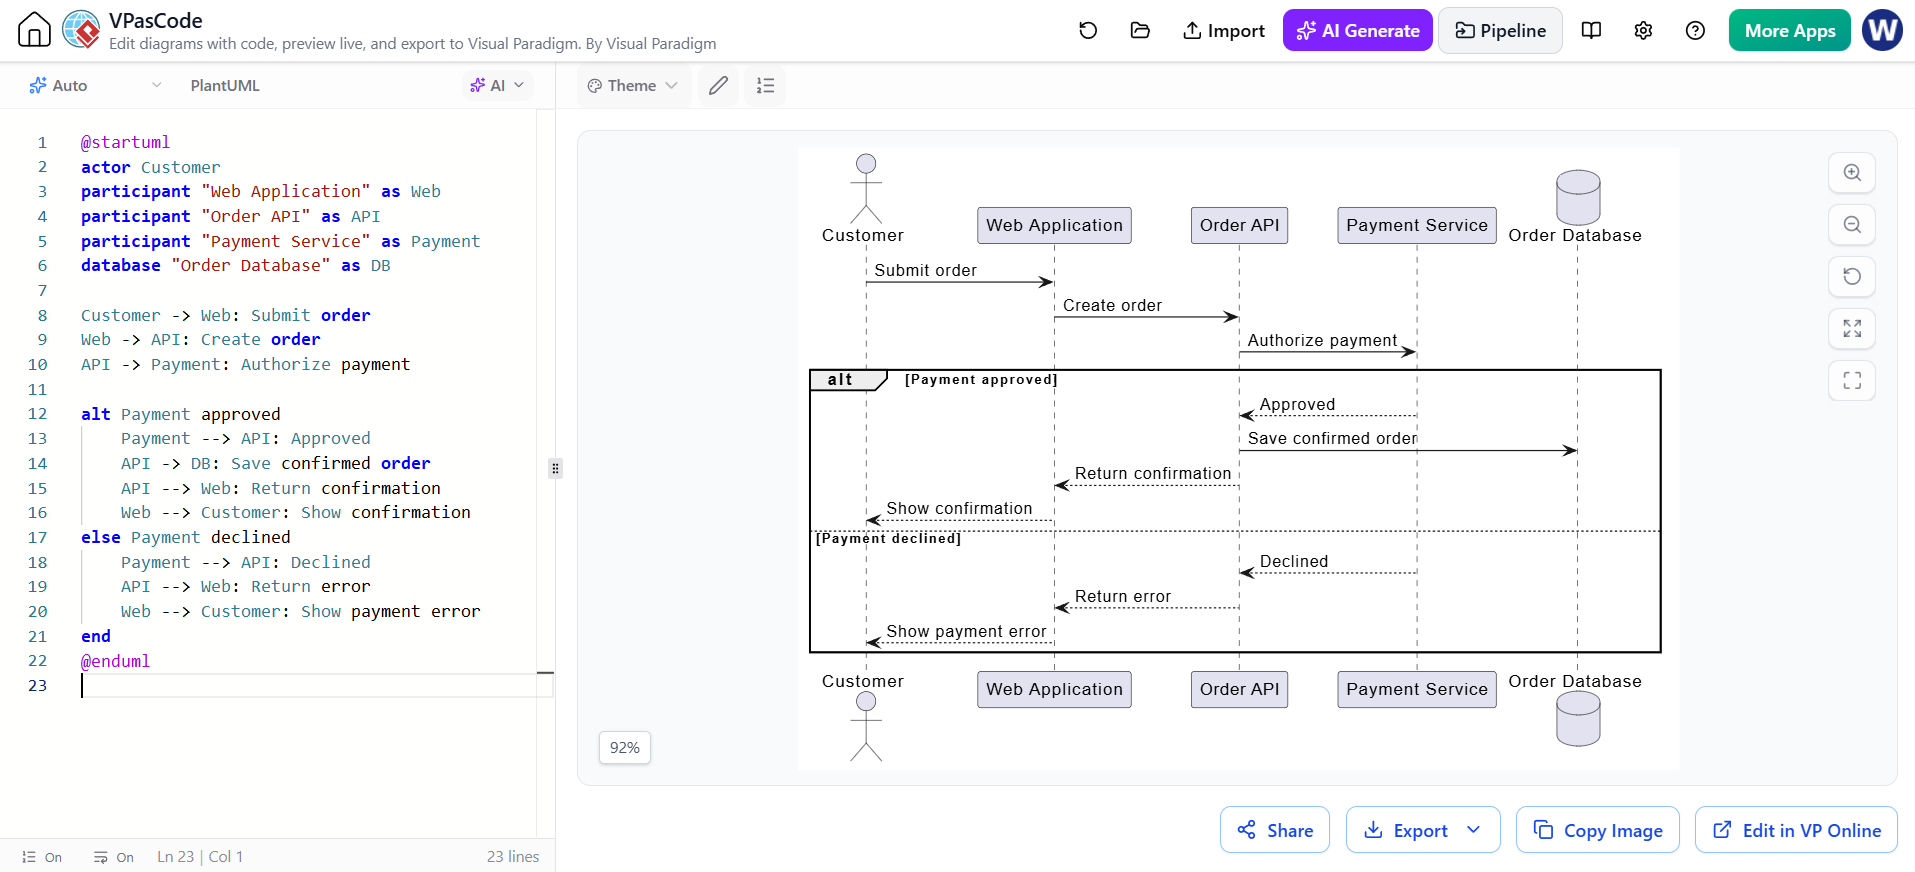
@startuml
actor Customer
participant "Web Application" as Web
participant "Order API" as API
participant "Payment Service" as Payment
database "Order Database" as DB

Customer -> Web: Submit order
Web -> API: Create order
API -> Payment: Authorize payment

alt Payment approved
    Payment --> API: Approved
    API -> DB: Save confirmed order
    API --> Web: Return confirmation
    Web --> Customer: Show confirmation
else Payment declined
    Payment --> API: Declined
    API --> Web: Return error
    Web --> Customer: Show payment error
end
@endumlThis diagram focuses on behavior and timing rather than system structure.
Common Mistakes to Avoid
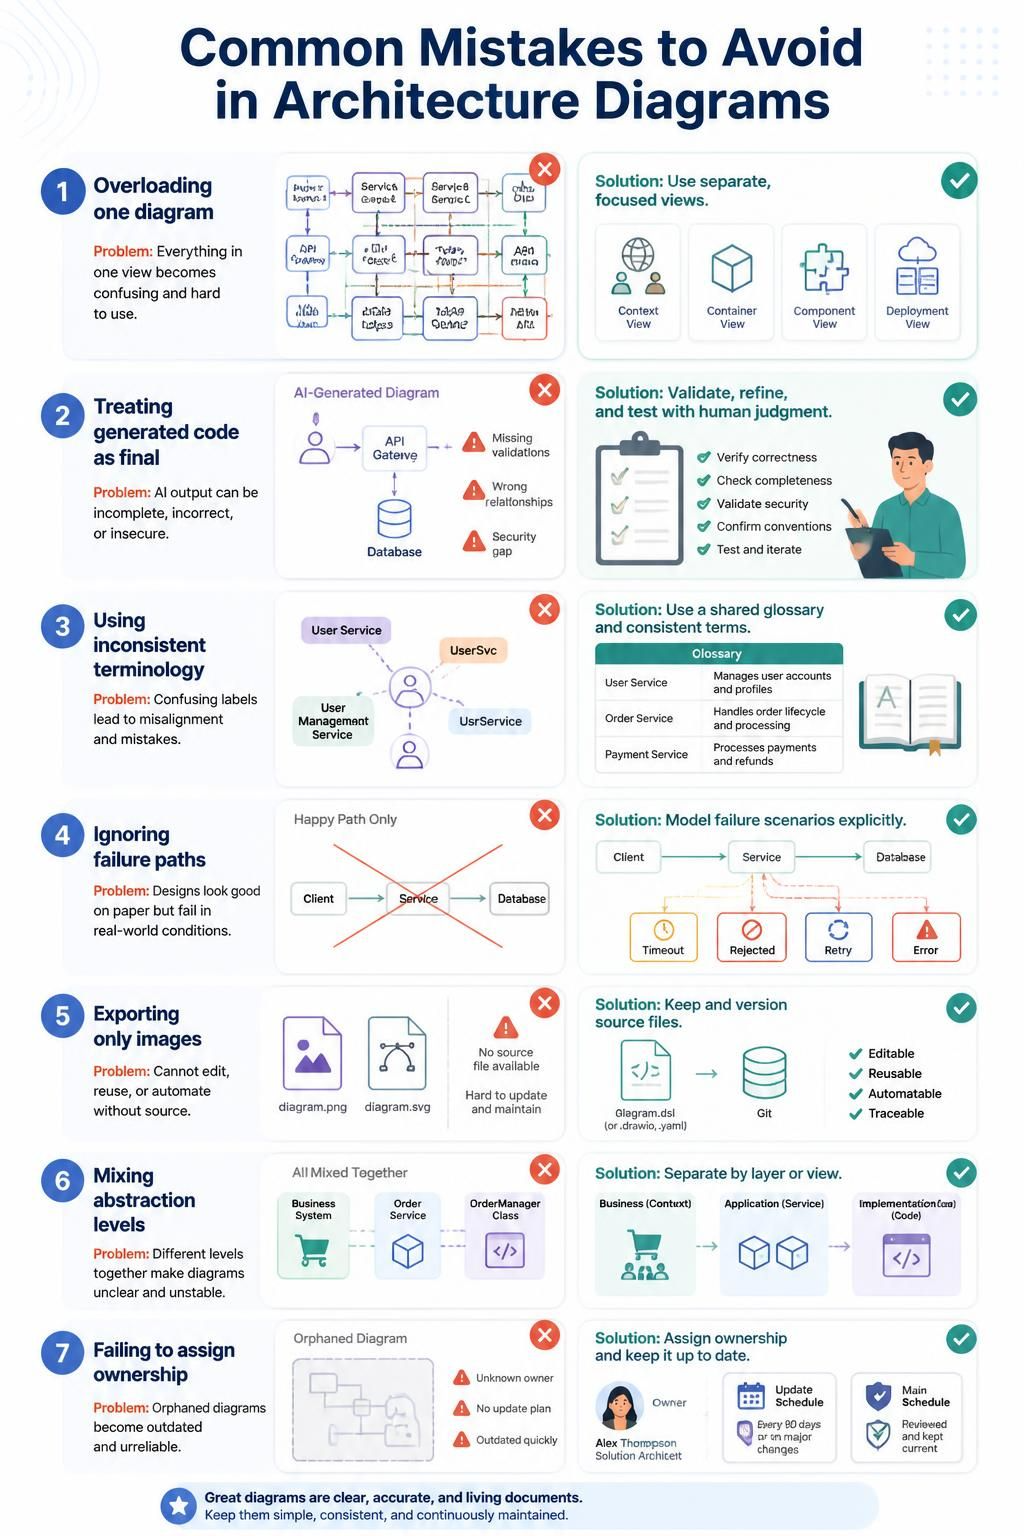
Overloading one diagram
Trying to represent every service, database, user, vendor, and infrastructure component in one image usually creates confusion. Create separate views for different questions.
Treating generated code as final
AI-generated diagrams can contain incorrect assumptions or invented relationships. Validate every important element against the actual system.
Using inconsistent terminology
Different names for the same system element make documentation harder to search and maintain. Establish a shared vocabulary.
Ignoring failure paths
Successful flows are easy to illustrate, but failure paths often carry more operational value. Include rejected payments, unavailable services, invalid input, timeouts, and retry behavior where relevant.
Exporting only images
PNG and SVG files are useful outputs, but they are not sufficient as the only record. Preserve the source code so the diagram can be updated later.
Mixing abstraction levels
Avoid placing high-level business systems next to individual classes or low-level infrastructure settings unless the purpose of the diagram requires it.
Failing to assign ownership
A diagram becomes more useful when teams know who maintains it. Define an owner, update process, and review schedule for important architecture documents.
Feature and Edition Overview
| Capability | Free | Starter | Advance | Combo | Deluxe |
|---|---|---|---|---|---|
| PlantUML support | ✓ | ✓ | ✓ | ✓ | ✓ |
| Mermaid support | ✓ | ✓ | ✓ | ✓ | ✓ |
| Graphviz support | ✓ | ✓ | ✓ | ✓ | ✓ |
| Markmap support | ✓ | ✓ | ✓ | ✓ | ✓ |
| ECharts support | ✓ | ✓ | ✓ | ✓ | ✓ |
| Live code rendering | ✓ | ✓ | ✓ | ✓ | ✓ |
| Automatic format detection | ✓ | ✓ | ✓ | ✓ | ✓ |
| Word-wrap toggle | ✓ | ✓ | ✓ | ✓ | ✓ |
| Share links and embed code | ✓ | ✓ | ✓ | ✓ | ✓ |
| Social sharing and QR code | ✓ | ✓ | ✓ | ✓ | ✓ |
| PNG export | ✓ | ✓ | ✓ | ✓ | ✓ |
| SVG export | ✓ | ✓ | ✓ | ✓ | ✓ |
| Diagram code translation | — | — | — | ✓ | ✓ |
| Code correction with explanation | — | — | — | ✓ | ✓ |
| AI C4 model import | — | — | — | ✓ | ✓ |
| Custom AI endpoint | — | — | — | — | ✓ |
| OpenDocs pipeline integration | — | — | — | ✓ | ✓ |
| Editing in Visual Paradigm Online | — | — | — | ✓ | ✓ |
Getting Started Checklist
Use the following checklist for a first project:
-
Choose a small system or workflow.
-
Identify the intended audience.
-
Write the question the diagram should answer.
-
Select PlantUML, Mermaid, Graphviz, D2, Markmap, or another suitable format.
-
Create a first draft manually or with AI assistance.
-
Open the source in VPasCode.
-
Review the live preview.
-
Fix syntax and layout problems.
-
Check names and relationships against the real system.
-
Add failure paths or important constraints.
-
Export the diagram or share it through a link.
-
Store the source code with the project documentation.
-
Assign an owner for future updates.
Reference Articles and Posts
-
Visual Paradigm VPasCode: Comprehensive Guide: Overview of VPasCode, its editor, AI features, supported formats, and workflows.
-
Beyond UML: Every Architecture and Data Diagram You Can Edit as Code in VPasCode: Explains architecture, UML, data, process, roadmap, and mind-map diagram options.
-
Beyond Code and AI: Why Visual Paradigm Remains Essential for Professional Software Architecture: Discusses how diagram-as-code, AI, and professional modeling tools can work together.
-
Pairing VPasCode with OpenDocs: A Comprehensive Guide: Describes the workflow for publishing diagrams as part of living technical documentation.
-
BPMN for Beginners: A Practical Guide to Business Process Modeling: Introduces BPMN concepts and business-process modeling techniques.
-
BPMN Tutorial: Visual Paradigm Tooling, AI Chatbot & Ecosystem: Covers BPMN modeling with Visual Paradigm tools and AI-assisted workflows.
-
Mastering Apache ECharts in Visual Paradigm: From AI Prompt to Final Asset: Shows how natural-language prompts and ECharts can be combined to create data visualizations.
-
Visual Paradigm Unified Platform: Comprehensive Guide: Explains how Visual Paradigm products and collaboration tools connect within a unified workspace.
-
Visual Paradigm Online Productivity Suite: Provides access to online diagramming, documentation, AI, charting, and productivity tools.
Conclusion
Diagram-as-code turns visual documentation into a maintainable engineering asset. By expressing diagrams as text, teams can version them, review changes, automate workflows, and keep technical documentation aligned with evolving systems.
VPasCode extends this approach with real-time rendering, multiple diagram engines, AI generation, code correction, translation, image-to-C4 conversion, sharing, exporting, and connections to the wider Visual Paradigm ecosystem.
The most effective workflow is not limited to one tool or one diagram format. Use AI to explore ideas, VPasCode to create and refine diagram source, Visual Paradigm tools for deeper modeling, and OpenDocs to publish living documentation.
When diagrams are treated as structured, versionable models rather than static images, they become easier to maintain and far more valuable throughout the software development lifecycle.
Related posts:
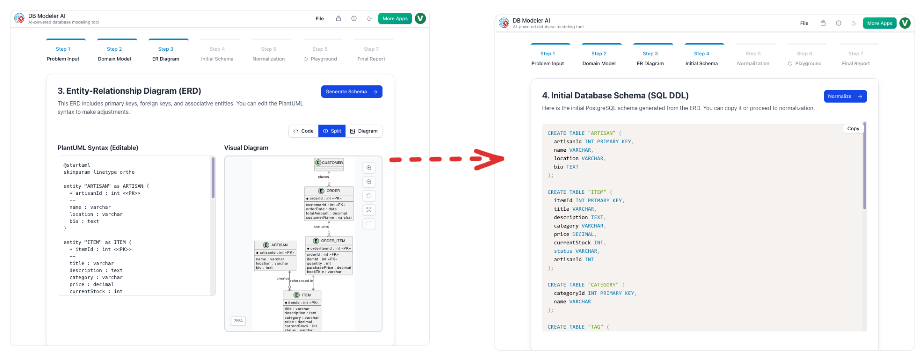 From Static Diagrams to Living Knowledge: A Case Study on Visual Paradigm’s Unified AI-Driven Documentation Ecosystem
 VPasCode Release: Free Diagram-as-Code & Premium AI Features Explained
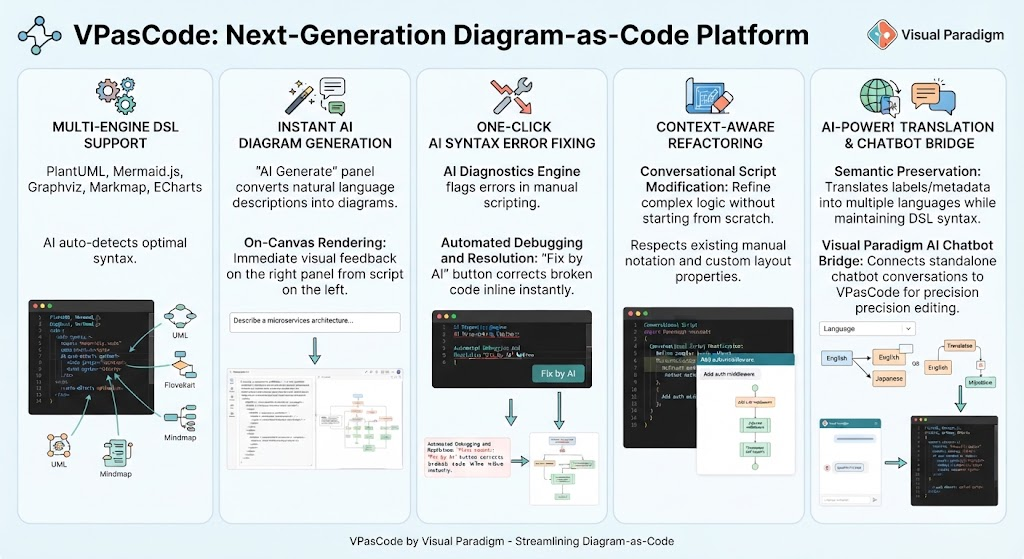 Mastering AI-Native Diagramming: A Comprehensive Guide to Visual Paradigm’s VPasCode
 Comprehensive Guide to Custom AI Endpoint Support in Visual Paradigm

 English
 Arabic
 Chinese (Simplified)
 Dutch
Dutch French
 German
 Italian
 Japanese
 Korean
 Portuguese
 Russian
 Spanish