


Introduction
In today’s rapidly evolving software development landscape, the ability to visualize, design, and communicate complex system architectures has become more critical than ever. As systems grow in complexity—spanning microservices, cloud-native deployments, and distributed databases—traditional documentation methods often fall short. This is where UML Component Diagrams step in as a powerful modeling tool, bridging the gap between abstract design and concrete implementation.
This case study explores the fundamentals of UML Component Diagrams, their practical applications in modern software engineering, and how artificial intelligence is transforming the way architects and developers create, refine, and maintain these essential diagrams. Whether you are breaking down a monolithic application into microservices or designing a new cloud-native platform from scratch, understanding component diagrams—and leveraging AI to accelerate their creation—can significantly improve system clarity, team collaboration, and development velocity.

Through real-world examples, step-by-step guidance, and insights into AI-enhanced modeling workflows, this article provides a complete reference for practitioners seeking to master component-based system design.
What is a Component Diagram?
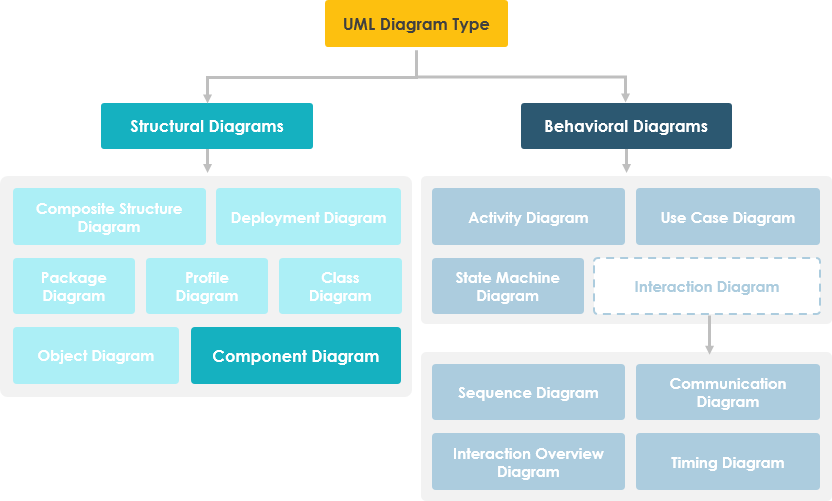
UML Component diagrams are used in modeling the physical aspects of object-oriented systems that are used for visualizing, specifying, and documenting component-based systems and also for constructing executable systems through forward and reverse engineering. Component diagrams are essentially class diagrams that focus on a system’s components that often used to model the static implementation view of a system.
Component Diagram at a Glance
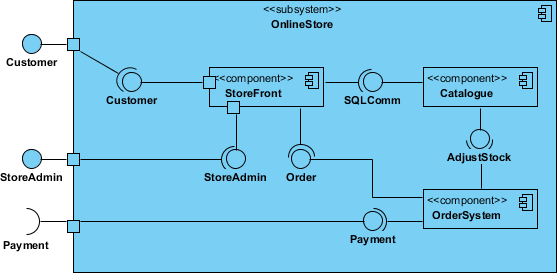
A component diagram breaks down the actual system under development into various high levels of functionality. Each component is responsible for one clear aim within the entire system and only interacts with other essential elements on a need-to-know basis.
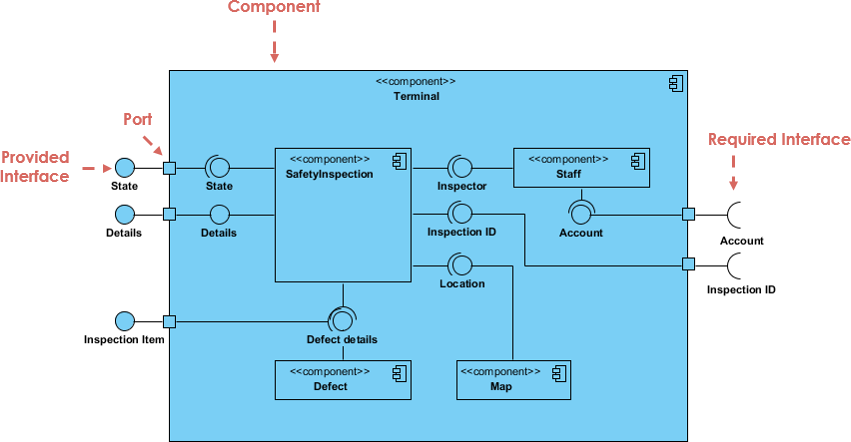
The example above shows the internal components of a larger component:
-
The data (account and inspection ID) flows into the component via the port on the right-hand side and is converted into a format the internal components can use. The interfaces on the right are known as required interfaces, which represents the services the component needed in order to carry out its duty.
-
The data then passes to and through several other components via various connections before it is output at the ports on the left. Those interfaces on the left are known as provided interface, which represents the services to deliver by the exhibiting component.
-
It is important to note that the internal components are surrounded by a large ‘box’ which can be the overall system itself (in which case there would not be a component symbol in the top right corner) or a subsystem or component of the overall system (in this case the ‘box’ is a component itself).
Basic Concepts of Component Diagram
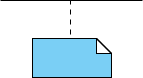
A component represents a modular part of a system that encapsulates its contents and whose manifestation is replaceable within its environment. In UML 2, a component is drawn as a rectangle with optional compartments stacked vertically. A high-level, abstracted view of a component in UML 2 can be modeled as:
-
A rectangle with the component’s name
-
A rectangle with the component icon
-
A rectangle with the stereotype text and/or icon

Architect Your Modular Systems with AI
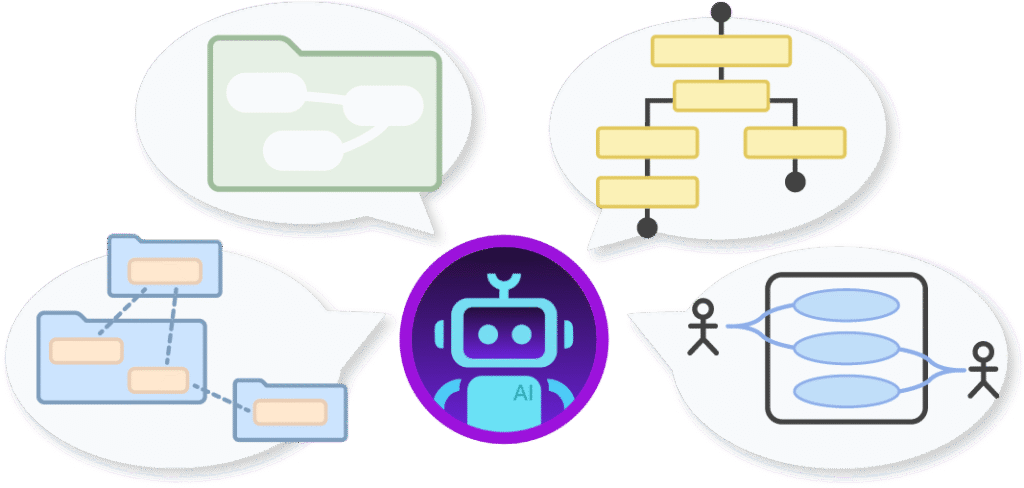
Component diagrams visualize the modular parts and physical manifestation of your system. Using Visual Paradigm’s AI Chatbot, you can instantly brainstorm system architectures, identify provided/required interfaces, and generate initial component diagrams through a simple conversational interface.
NOW AVAILABLE: AI Chatbot: Your Design Partner
Simply describe your modules, microservices, or database structures to the chatbot. It will help you define:
-
Modular Boundaries: Identify which parts of your system should be encapsulated as components.
-
Dependency Mapping: Visualize how different executables and libraries interact within your release.
Learn more about our AI-driven modeling ecosystem:
AI Component Guide All AI Tools
Interface
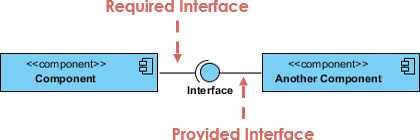
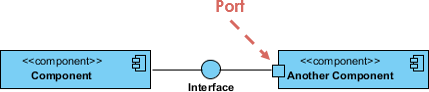
In the example below shows two type of component interfaces:
Provided interface symbols with a complete circle at their end represent an interface that the component provides – this “lollipop” symbol is shorthand for a realization relationship of an interface classifier.
Required Interface symbols with only a half circle at their end (a.k.a. sockets) represent an interface that the component requires (in both cases, the interface’s name is placed near the interface symbol itself).
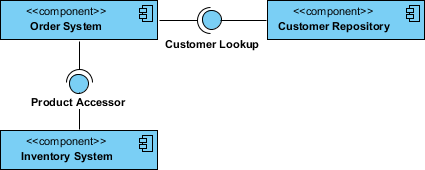
Component Diagram Example – Using Interface (Order System)
Subsystems
The subsystem classifier is a specialized version of a component classifier. Because of this, the subsystem notation element inherits all the same rules as the component notation element. The only difference is that a subsystem notation element has the keyword of subsystem instead of component.
Port
Ports are represented using a square along the edge of the system or a component. A port is often used to help expose required and provided interfaces of a component.
Relationships
Graphically, a component diagram is a collection of vertices and arcs and commonly contain components, interfaces and dependency, aggregation, constraint, generalization, association, and realization relationships. It may also contain notes and constraints.
| Relationships | Notation |
|---|---|
Association:
|
 |
Composition:
|
 |
Aggregation
|
 |
Constraint
|
 |
Dependency
|
 |
Links:
|
 |
Modeling Source Code
-
Either by forward or reverse engineering, identify the set of source code files of interest and model them as components stereotyped as files.
-
For larger systems, use packages to show groups of source code files.
-
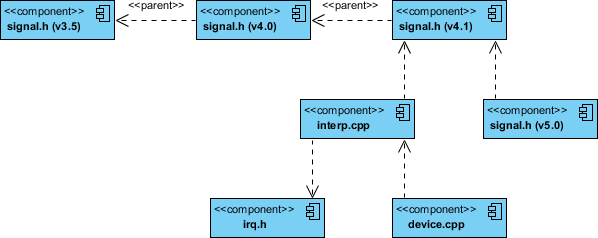
Consider exposing a tagged value indicating such information as the version number of the source code file, its author, and the date it was last changed. Use tools to manage the value of this tag.
-
Model the compilation dependencies among these files using dependencies. Again, use tools to help generate and manage these dependencies.
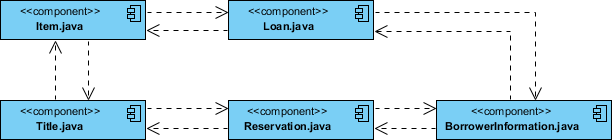
Component Example – Java Source Code
Component Diagram Example – C++ Code with versioning
Modeling an Executable Release
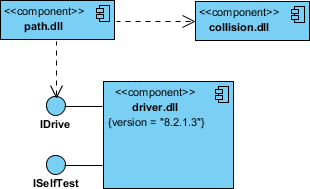
-
Identify the set of components you’d like to model. Typically, this will involve some or all the components that live on one node, or the distribution of these sets of components across all the nodes in the system.
-
Consider the stereotype of each component in this set. For most systems, you’ll find a small number of different kinds of components (such as executables, libraries, tables, files, and documents). You can use the UML’s extensibility mechanisms to provide visual cues(clues) for these stereotypes.
-
For each component in this set, consider its relationship to its neighbors. Most often, this will involve interfaces that are exported (realized) by certain components and then imported (used) by others. If you want to expose the seams in your system, model these interfaces explicitly. If you want your model at a higher level of abstraction, elide these relationships by showing only dependencies among the components.
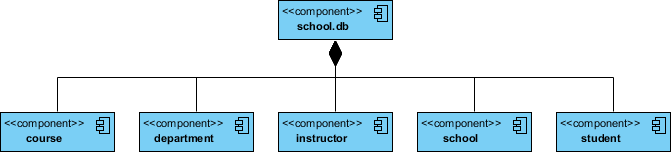
Modeling a Physical Database
-
Identify the classes in your model that represent your logical database schema.
-
Select a strategy for mapping these classes to tables. You will also want to consider the physical distribution of your databases. Your mapping strategy will be affected by the location in which you want your data to live on your deployed system.
-
To visualize, specify, construct, and document your mapping, create a component diagram that contains components stereotyped as tables.
-
Where possible, use tools to help you transform your logical design into a physical design.
How to Draw a Component Diagram in UML?
Component Diagrams show the types of software components in the system, their interfaces and dependencies. People often use UML Component Diagram in the following scenarios:
-
Show the structure of the code itself
-
Can be used to hide the specification detail (i.e., information hiding) and focus on the relationship between components
-
Model the structure of software releases; show how components integrate with current system design
-
Model source code and relationships between files
-
Specify the files that are compiled into an executable
How to create Component Diagrams?
The steps below outline the major steps to take in creating a UML Component Diagram.
-
Decide on the purpose of the diagram
-
Add components to the diagram, grouping them within other components if appropriate
-
Add other elements to the diagram, such as classes, objects and interfaces
-
Add the dependencies between the elements of the diagram
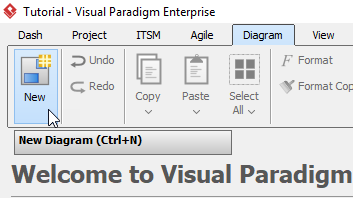
Creating a Component Diagram
-
Click Diagram > New from the toolbar.
-
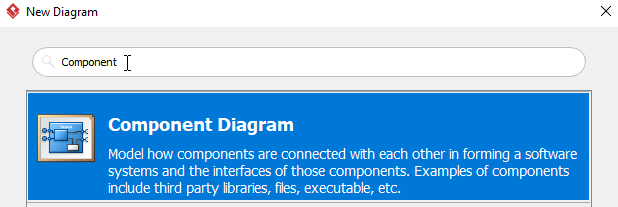
In the New Diagram window, select Component Diagram, then click Next. You can use the search bar above to filter results.
-
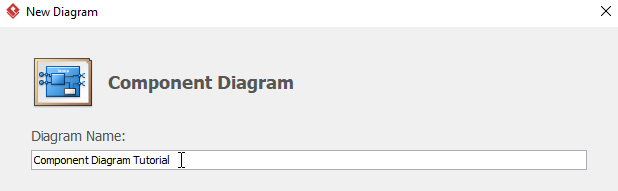
Name the diagram, then click OK. You will then see a blank diagram. We will name the diagram Component Diagram Tutorial in this tutorial.
-
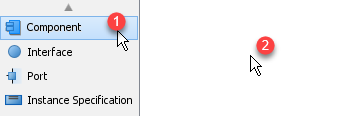
To create a component, select Component, then click any empty space on the diagram.
-
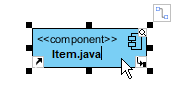
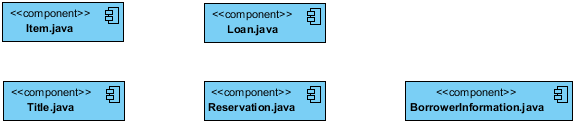
Rename the component by double clicking the component. In this case, we will be renaming this component Item.java.
-
Repeat step 4 and 5 for more components. You will see something like this after creating all components:
-
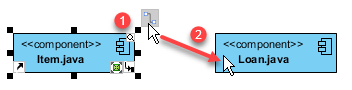
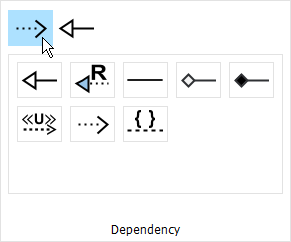
We can create some dependencies once the components are created. In this example, we are creating a dependency from Item.java to Loan.java. Click Item.java, then click and hold the resource button Resource Catalog, drag the cursor to Loan and release, select Dependency from the popup window. You will now see a dependency from Item.java to Loan.java.
-
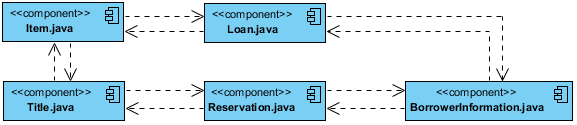
Repeat step 7 for more dependencies.
-
You will see something like this when you finished your diagram:
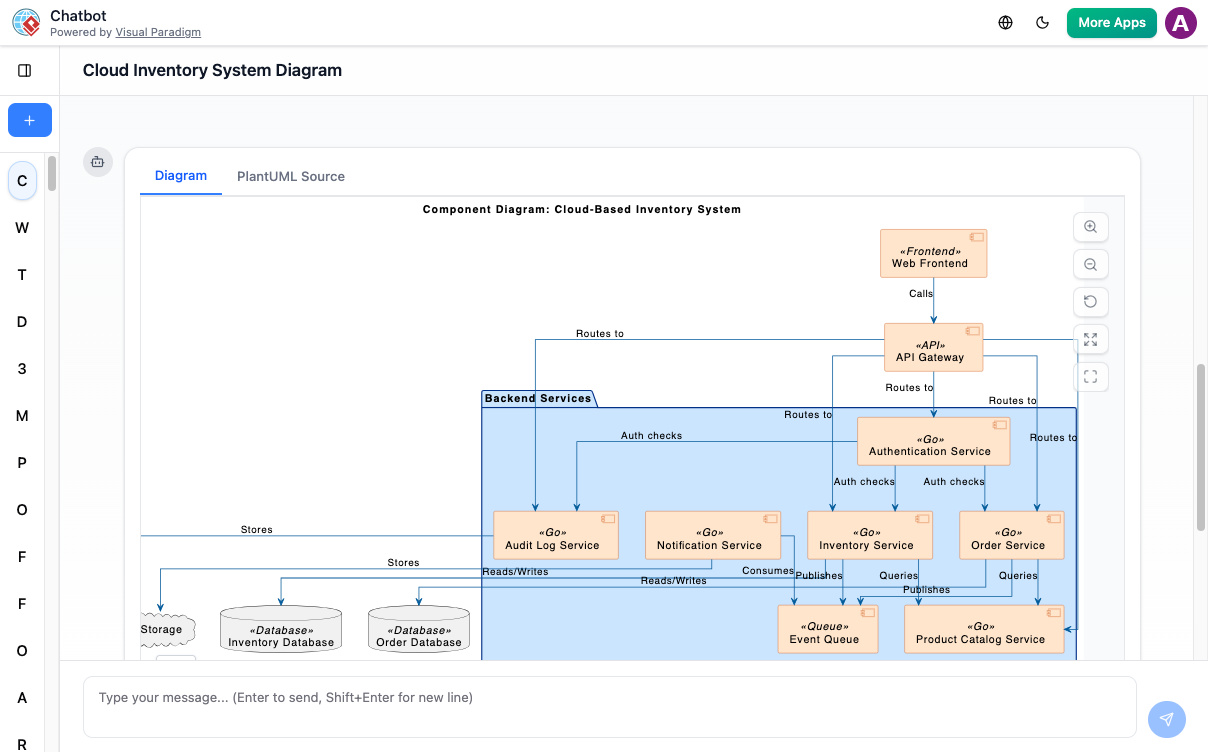
AI Component Diagram Generator: New AI UML Tool Feature
UML Component Diagram – AI Chatbot
C4 Component Diagram – AI Chatbot
Visual Paradigm offers comprehensive, enterprise-grade support for UML Component Diagrams, deeply enhanced by native generative AI tools. In software engineering, component diagrams map out the physical manifestation, modular blocks, and interface connections of a system. Visual Paradigm treats these blocks as intelligent metadata rather than flat, static drawings.
1. The AI-Powered Approach to Component Diagrams
The platform integrates Visual Paradigm AI directly into the Desktop workspace, VP Online, and OpenDocs. This removes the mechanical friction of manually plotting complex architectures.
-
Text-to-Architecture Generation: You can bypass standard templates. By selecting Tools -> AI Diagram Generation, you provide a plain English prompt (e.g., “Generate a component diagram for a microservices banking application detailing the Auth Service, Payment Gateway, and Notification system”). The AI contextually deduces the correct modular boundaries and draws them instantly.
-
Automated Interface Extraction: The AI automatically isolates dependencies and maps out Provided Interfaces (lollipop symbols) and Required Interfaces (socket symbols). It accurately formats how modular parts communicate without requiring you to manually link ports.
-
Conversational Architectural Refactoring: Via the Visual Paradigm AI Chatbot panel, you can evolve the structural design using text commands. For example, you can tell the chatbot: “Isolate the database layer into its own package container” or “Remove the user profile service and route traffic directly to the main cluster”.
-
Dual Blueprint Flexibility: Beyond standard UML components, the AI engine can seamlessly pivot your system description to create a C4 Component Diagram—allowing you to visualize structural context at multiple abstract levels (Context, Container, Component, Code).
2. Core Technical UML Component Features
Once the AI establishes your high-level modular structure, you can utilize Visual Paradigm’s robust modeling engine to refine technical granularities:
-
Component Realization & Manifestation: Map abstract components cleanly to concrete implementation layouts, such as physical artifacts, execution files, or database tables.
-
Encapsulation via Ports: Explicitly define external interaction points using Ports, enabling you to group distinct interface boundaries directly on a component’s edge.
-
Subsystems & Package Nesting: Group tightly-coupled components inside Packages or Subsystem borders to clearly define architectural namespaces and structural layers.
-
Smart Resource Cataloging: If you need to expand manually, clicking and dragging out from any component opens the Resource Catalog, which intelligently suggests structurally legal connectors (like dependencies or assembly couplings).
3. Traceability & The Downstream Pipeline
The primary benefit of Visual Paradigm’s approach is that your AI-assisted component diagrams remain tethered to your wider project lifecycle.
-
Model-Level Integration: Every component generated by the AI is logged as an actual system element. If you rename a component, that change syncs globally across associated deployment or class diagrams.
-
Documentation on Demand: You can instruct the integrated AI to read your generated visual components and instantly compile a formal architectural report, outlining interface specifications and system dependencies.
-
Seamless Tool Promotion: Brainstorm structures quickly using the online web editor, then click to import the model straight into Visual Paradigm Desktop for advanced code engineering or version control.
Are you mapping a monolithic system you want to break down into microservices, or are you designing a cloud-native application from scratch? Let me know, and I can give you an AI prompt framework tailored to your stack!
Conclusion
UML Component Diagrams remain a cornerstone of effective software architecture, providing a clear, visual language for describing how modular pieces of a system interact, depend on one another, and come together to deliver business value. As software systems continue to grow in scale and complexity—from monoliths to microservices, from on-premise deployments to cloud-native architectures—the need for precise, maintainable, and communicative modeling has never been greater.
The integration of artificial intelligence into component diagram tooling represents a paradigm shift. No longer must architects and developers spend hours manually drawing boxes and connectors; instead, they can focus on high-level design decisions while AI handles the mechanical aspects of diagram creation, interface mapping, and dependency tracking. This not only accelerates the design phase but also improves accuracy, consistency, and collaboration across distributed teams.
By combining foundational UML principles with modern AI capabilities, teams can achieve a new level of agility in system design—rapidly prototyping architectures, validating integration points, and generating living documentation that evolves alongside the codebase. Whether you are modernizing legacy systems, launching new cloud services, or simply seeking better ways to communicate technical designs, mastering component diagrams—and leveraging AI to enhance them—offers a powerful path forward.
As you embark on your next architecture project, consider starting with a simple prompt to an AI-powered diagramming tool. Describe your system in plain language, let the AI generate an initial component model, and then refine it with your domain expertise. The result will be a clearer, more maintainable, and more collaborative foundation for building great software.
References
- Unified Modeling Language: Wikipedia’s comprehensive overview of UML standards, notation, and modeling practices.
- What is Component Diagram?: Visual Paradigm’s foundational guide explaining component diagram concepts, notation, and use cases.
- AI Component Diagram Generator Update: Release notes detailing new AI-powered features for generating UML component diagrams.
- UML Component Diagram – AI Chatbot: Interactive AI tool for generating component diagrams through natural language prompts.
- C4 Component Diagram – AI Chatbot: AI-assisted tool for creating C4 model component diagrams via conversational interface.
- AI Component Diagram Generator Guide: Step-by-step tutorial for using Visual Paradigm’s AI to create component diagrams.
- Best AI Diagram Generator Ecosystem: Overview of Visual Paradigm’s AI-powered diagramming tools and capabilities.
- Mastering AI-Powered UML Modeling: In-depth guide to leveraging generative AI for UML modeling workflows.
- AI Diagram Generation Feature: Product page describing Visual Paradigm’s AI diagram generation capabilities.
- AI Chatbot Feature: Overview of Visual Paradigm’s conversational AI assistant for software modeling.
- How to Draw a Component Diagram in UML: Practical tutorial for creating component diagrams using Visual Paradigm tools.
- Visual Paradigm Community Edition Guide: Introduction to free UML modeling tools for individuals and small teams.
- AI-Generated Component Diagram: Social Media App: Example of AI-generated component diagram for a social media application architecture.
- AI Component Diagram: Healthcare Management System: Case study demonstrating AI-assisted component modeling for healthcare systems.
- C4 Diagram Tool Feature: Product overview of Visual Paradigm’s C4 model diagramming capabilities.
- AI Component Diagram Generator: OpenDocs Update: Announcement of AI diagram generation support in Visual Paradigm OpenDocs.
- Building Modular Software with AI: Hands-On Review: Personal review and practical insights on using AI for component diagram modeling.
- YouTube Tutorial: Component Diagrams with AI: Video walkthrough of creating component diagrams using Visual Paradigm’s AI tools.
- YouTube Tutorial: AI-Powered Architecture Design: Demonstration of conversational AI for refining system architecture diagrams.
