


Introduction
In today’s fast-paced software development and enterprise architecture environments, visual communication through diagrams is essential. Teams must frequently create flowcharts, UML models, sequence diagrams, mind maps, and architecture overviews to align stakeholders, document systems, and accelerate decision-making. However, the fragmentation of diagramming tools often leads to workflow inefficiencies—switching between applications, reconciling different syntaxes, and struggling with collaboration.
This case study explores three prominent solutions: VPasCode, PlantText Editor, and Mermaid Live Editor. By examining their core strengths, target audiences, and practical use cases, we provide a clear framework for organizations and individual professionals to select the most suitable platform. Whether you manage large-scale enterprise modeling or need quick documentation visuals, understanding these differences can dramatically improve productivity and diagram quality.
Core Overview
The fundamental distinction among these tools lies in their scope and flexibility. VPasCode stands out as a unified, multi-engine platform that integrates multiple diagramming languages. In contrast, PlantText and Mermaid Live Editor are specialized, single-engine web-based tools optimized for their respective ecosystems.
| Feature | VPasCode | PlantText Editor | Mermaid Live Editor |
|---|---|---|---|
| Supported Engines | PlantUML, Mermaid, Graphviz | PlantUML only | Mermaid only |
| Target Audience | Enterprise architects & polyglot teams | Traditional backend/Java engineers | Markdown writers & frontend devs |
| Interface Style | Modern multi-workspace | Minimalist, traditional web UI | Modern split-pane preview |
| Primary Strength | Everything in one place | High-fidelity UML models | Native Markdown ecosystem alignment |
This comparison highlights how each tool addresses different pain points in the diagramming workflow, from versatility to specialized precision and seamless integration.
Key Tool Profiles
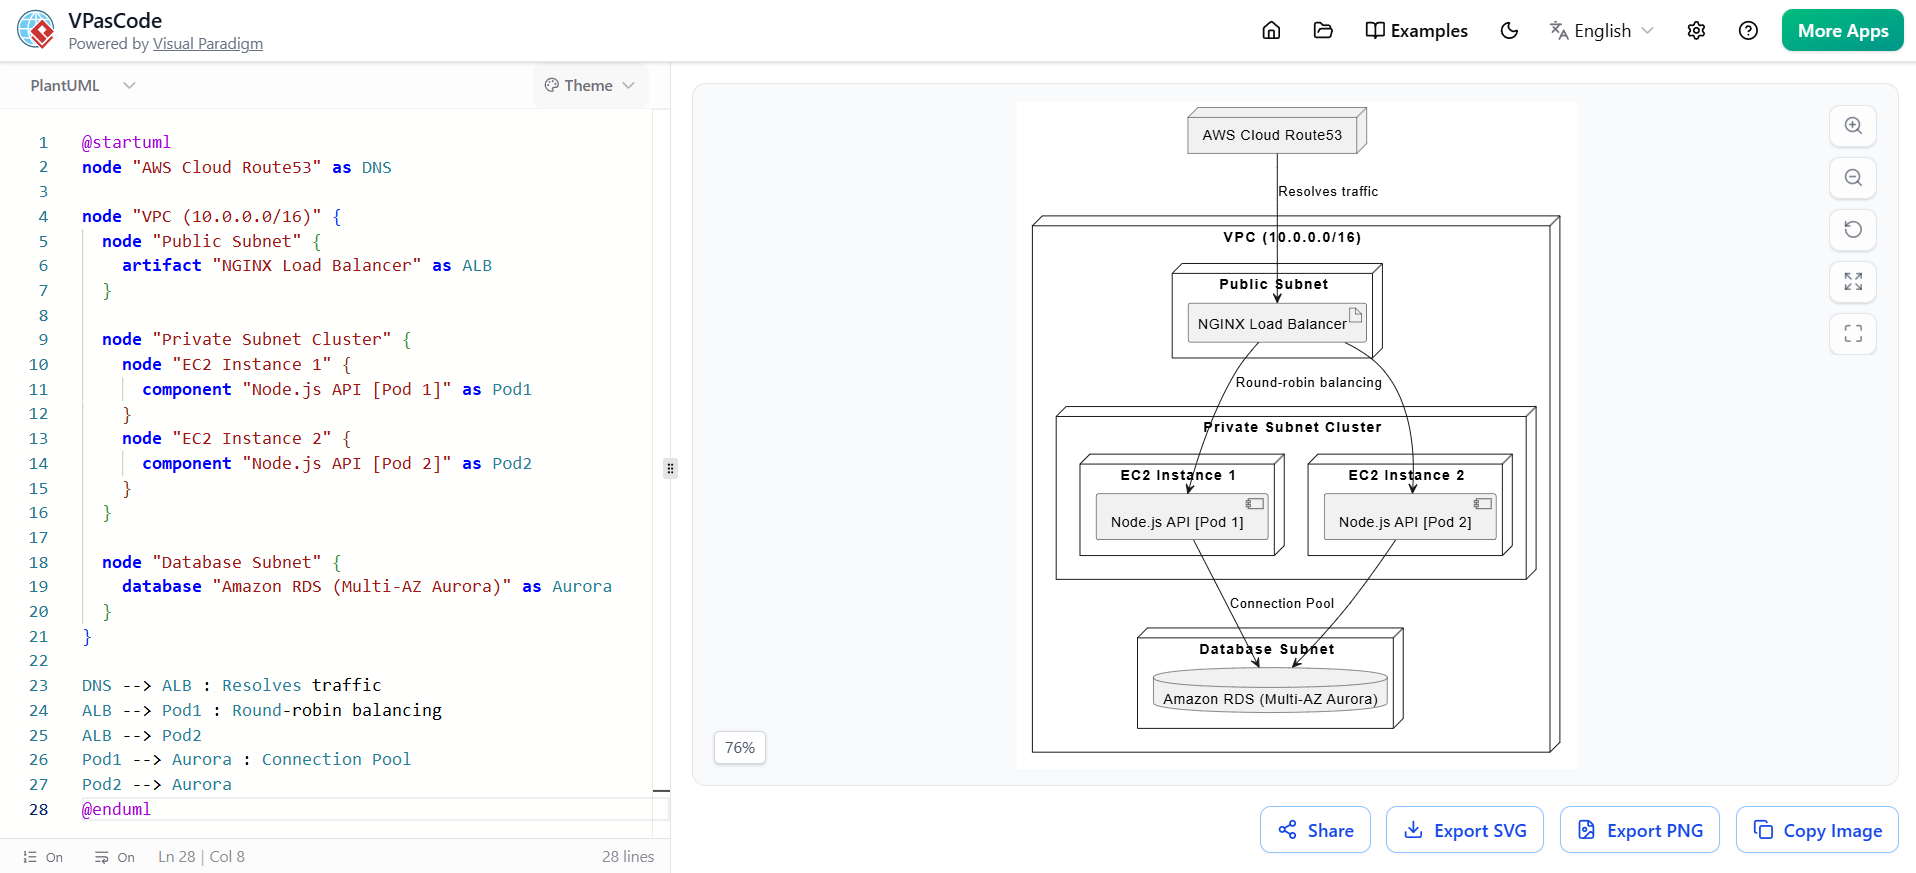
VPasCode: The All-in-One Engine
VPasCode serves as a comprehensive workspace that brings together PlantUML, Mermaid.js, and Graphviz within a single, cohesive interface. This eliminates the common frustration of syntax locking, where team members are divided between different diagramming languages.
Its modern multi-workspace design supports zero-setup cloud workflows, backed by Visual Paradigm’s robust architecture engine. Teams can seamlessly switch between complex UML diagrams and lightweight flowcharts without exporting or importing files repeatedly.
Best suited for: Multi-disciplinary teams that need to handle diverse and complex diagrams simultaneously. Enterprise architects working on system integration projects, solution designers collaborating across departments, and agile teams that iterate rapidly on both high-level architecture and detailed component models benefit most from this unified approach.
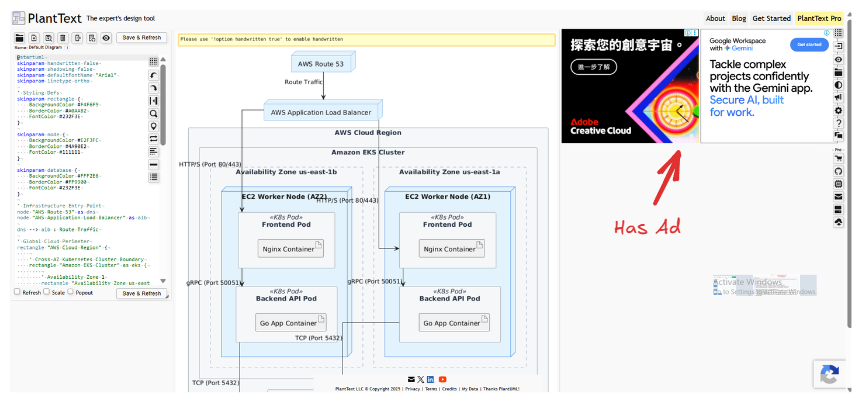
PlantText Editor: The PlantUML Standard
PlantText remains a dedicated and reliable choice for users who require strict PlantUML compliance. It excels at producing high-fidelity UML diagrams, particularly for intricate sequence diagrams, class structures, and comprehensive software design documentation.
While its interface follows a more traditional minimalist web style, it delivers stable and precise text-to-graphics rendering that many backend and Java-focused engineers trust for heavy-duty modeling tasks.
Best suited for: Organizations and professionals where standard UML compliance is critical. This includes traditional software development teams working on large monolithic systems, enterprise application planning, and scenarios demanding deep structural modeling with maximum accuracy.
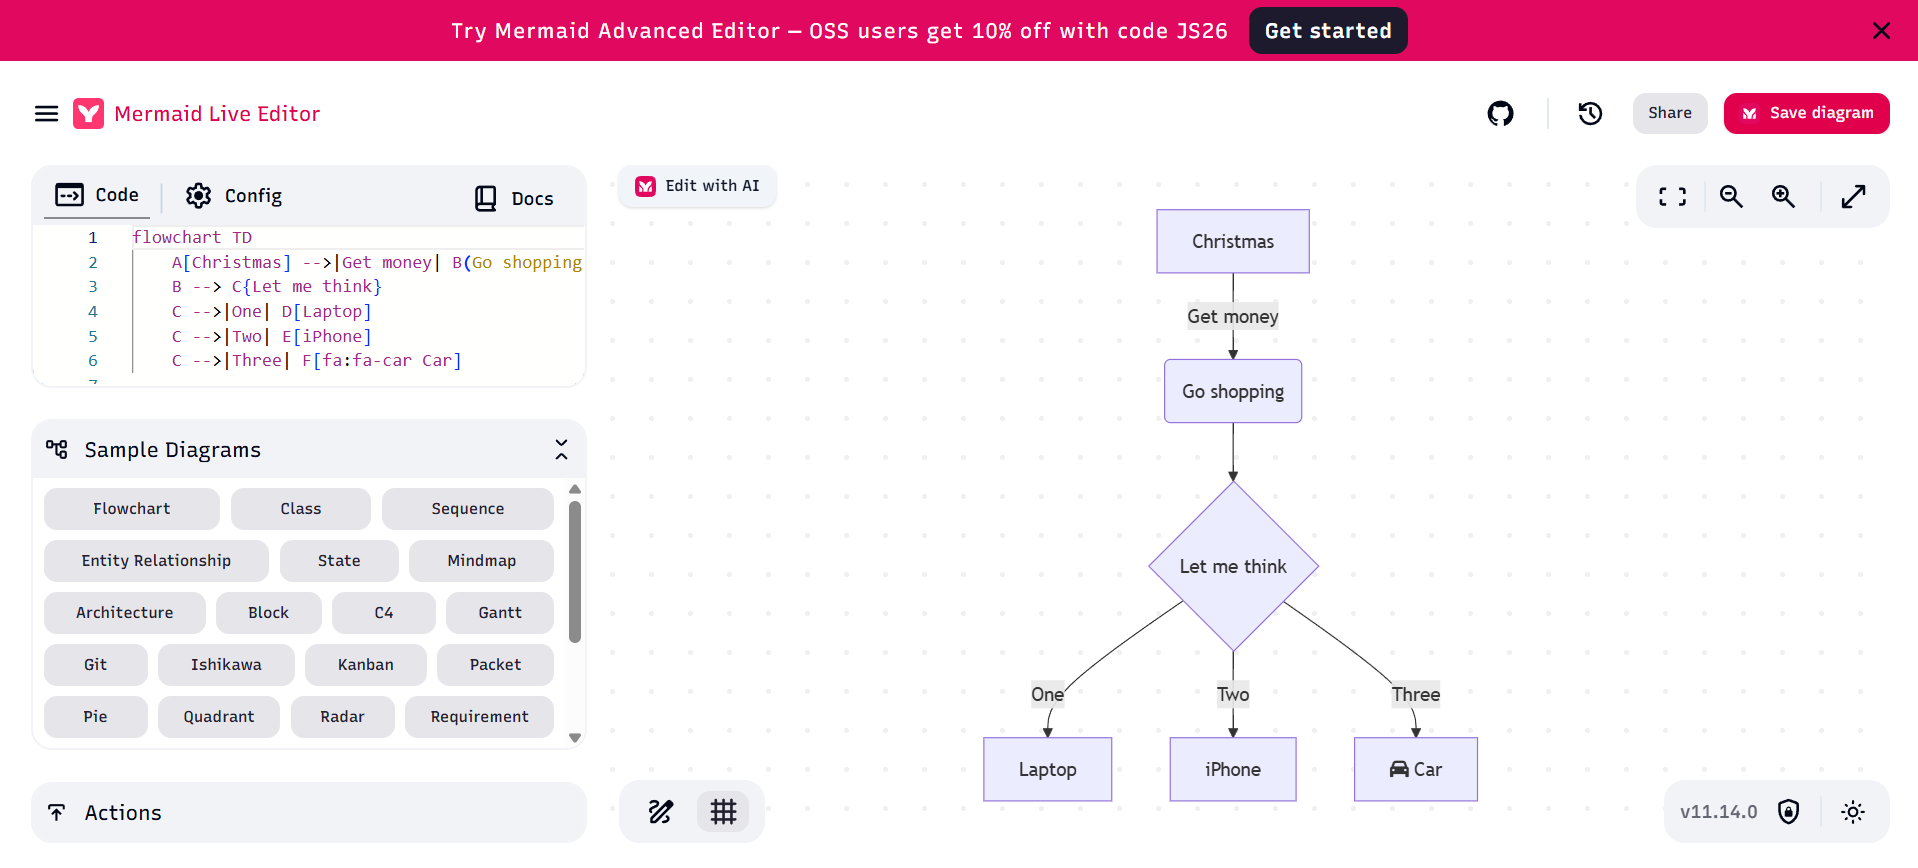
Mermaid Live Editor: The Markdown Favorite
Mermaid Live Editor has gained popularity among documentation-focused teams due to its tight integration with Markdown ecosystems. It offers a clean, modern split-pane preview with excellent support for dark and light themes, producing crisp vector graphics.
Key advantages include frictionless sharing through instant links and native compatibility with platforms like GitHub, Obsidian, and other Markdown-based documentation tools. It shines in creating user journeys, mind maps, Gantt charts, and straightforward flowcharts.
Best suited for: Quick visualization needs in documentation sprints, README files, technical blogs, and collaborative writing environments. Frontend developers, technical writers, product managers, and open-source contributors who value speed and ecosystem integration prefer this tool.
Practical Use Case Scenarios
-
Large Enterprise Transformation Project: A team of 25 architects and developers used VPasCode to maintain consistency across business process models (Mermaid), detailed component diagrams (PlantUML), and infrastructure graphs (Graphviz) without switching tools.
-
Legacy System Documentation: A backend engineering group relied on PlantText to create precise UML representations of complex legacy Java systems where fidelity to standard notation was mandatory.
-
Agile Product Documentation: A cross-functional product team embedded Mermaid diagrams directly into their GitHub repository and Obsidian knowledge base for living documentation that updated seamlessly during sprints.
Conclusion
Selecting the right diagramming tool ultimately depends on your team’s specific needs, existing workflows, and long-term collaboration requirements. VPasCode offers the most flexibility for diverse, multi-language environments. PlantText delivers unmatched depth for traditional UML-heavy modeling. Mermaid Live Editor provides the smoothest experience for modern Markdown-centric documentation.
Organizations should evaluate their primary use cases: Do you need a single powerful workspace that grows with complexity, or a specialized tool that excels within a narrower but highly refined domain? By aligning tool choice with team structure and project demands, teams can reduce friction, improve visual communication, and accelerate delivery.
As diagramming continues to evolve as a core part of software craftsmanship, platforms like these demonstrate how the right technology can transform abstract ideas into clear, actionable visuals—ultimately driving better collaboration and more successful outcomes.
Diagram as Code Editor Resources
VPasCode Editor
- Welcome to VPasCode: An overview of VPasCode’s mission and core value proposition as a unified Diagram-as-Code platform. Learn how it streamlines visual documentation for development teams.
- The Unified Engine Advantage: Discover how VPasCode integrates PlantUML, Mermaid, and Graphviz into a single workspace. Compare the strengths of each engine and understand the unified approach.
- 60-Second Quickstart Guide: Get up and running with VPasCode in under a minute. This step-by-step guide walks you through creating your first diagram with instant rendering.
VPasCode Workflows and Features
- Live Editor: Master the VPasCode workspace with its dual-panel interface. Learn to navigate the editing pane and live preview for real-time diagram development.
- Sharing: Share diagrams instantly via URL without requiring a database backend. Understand the zero-database sharing mechanism that makes collaboration effortless.
- Export PNG / SVG: Export your diagrams in high-quality PNG or SVG formats for documentation, presentations, or web embedding. Learn the export options and best practices.
PlantUML
- PlantUML Syntax Basics: Learn the fundamental syntax rules and structure of PlantUML code. Master the basics needed to create any PlantUML diagram.
- Use Case Diagram: Model system functionality from a user’s perspective with actors and use cases. Create clear representations of system requirements and user interactions.
- Class Diagram: Define class structures, attributes, methods, and relationships in object-oriented design. Visualize your system’s static structure and architecture.
- Sequence Diagram: Model interactions between objects over time with lifelines and messages. Document the dynamic flow of operations in your system.
- Activity Diagram: Create flowcharts and workflow models to visualize business processes and algorithms. Map out decision points and parallel activities.
- State Diagram: Model state machines and transitions to show how objects change state in response to events. Perfect for understanding lifecycle management.
- Object Diagram: Display instances of classes at a specific point in time with actual values. Snapshot your system’s runtime state for debugging or documentation.
- Component Diagram: Illustrate high-level system components and their interactions. Organize your architecture into modular, reusable units.
- Deployment Diagram: Map physical architecture showing nodes, servers, and deployment artifacts. Document your infrastructure and runtime environment.
- Timing Diagram: Visualize time-constrained interactions and state changes along a timeline. Ideal for real-time systems and protocol specifications.
- ERD: Design Entity-Relationship diagrams for database modeling. Define tables, columns, keys, and relationships in your data schema.
- ArchiMate Diagram: Model enterprise architecture using ArchiMate standards across business, application, and technology layers. Align IT with business strategy.
- C4 Model: Create software architecture diagrams at four levels: Context, Containers, Components, and Code. Communicate architecture to different audiences effectively.
Mermaid.js
- Mermaid.js Syntax Basis: Understand the core syntax rules and structure of Mermaid.js diagrams. Get started with this Markdown-friendly diagramming language.
- Flowchart: Create flowcharts using nodes, edges, and various shapes to visualize processes and decision trees. Perfect for algorithm documentation.
- Class Diagram: Define class structures and relationships using Mermaid’s simplified syntax. Document object-oriented designs directly in Markdown.
- Sequence Diagram: Model message flows between participants with lifelines and activations. Document API interactions and system workflows.
- ERD: Design database schemas with entities, attributes, and relationships. Visualize your data model in documentation.
- State Diagram: Represent state transitions and finite state machines. Model component lifecycles and event-driven behavior.
- Mind Map: Create hierarchical idea maps for brainstorming and organizing thoughts. Visualize concepts radiating from a central topic.
- Gantt Chart: Visualize project timelines with tasks, durations, and dependencies. Track project schedules and milestones effectively.
- Quadrant Chart: Create 2×2 matrix analyses for prioritization and comparison. Plot items across two dimensions for strategic decision-making.
- Timeline: Display chronological events and historical sequences. Document project history or product evolution over time.
5. Graphviz Playbook
-
- Graphviz Syntax Basis: Introduction to the DOT language, the foundation of Graphviz diagrams. Learn the basic syntax for defining nodes and edges.
- Digraph: Create directed graphs with arrows to show relationships with direction. Ideal for dependency graphs and flow analysis.
- Graph: Build undirected graphs with simple lines connecting nodes. Perfect for network topologies and symmetric relationships.
- Cluster: Group related nodes into subgraphs or clusters for better organization. Create visual boundaries to show logical groupings in complex diagrams.
