


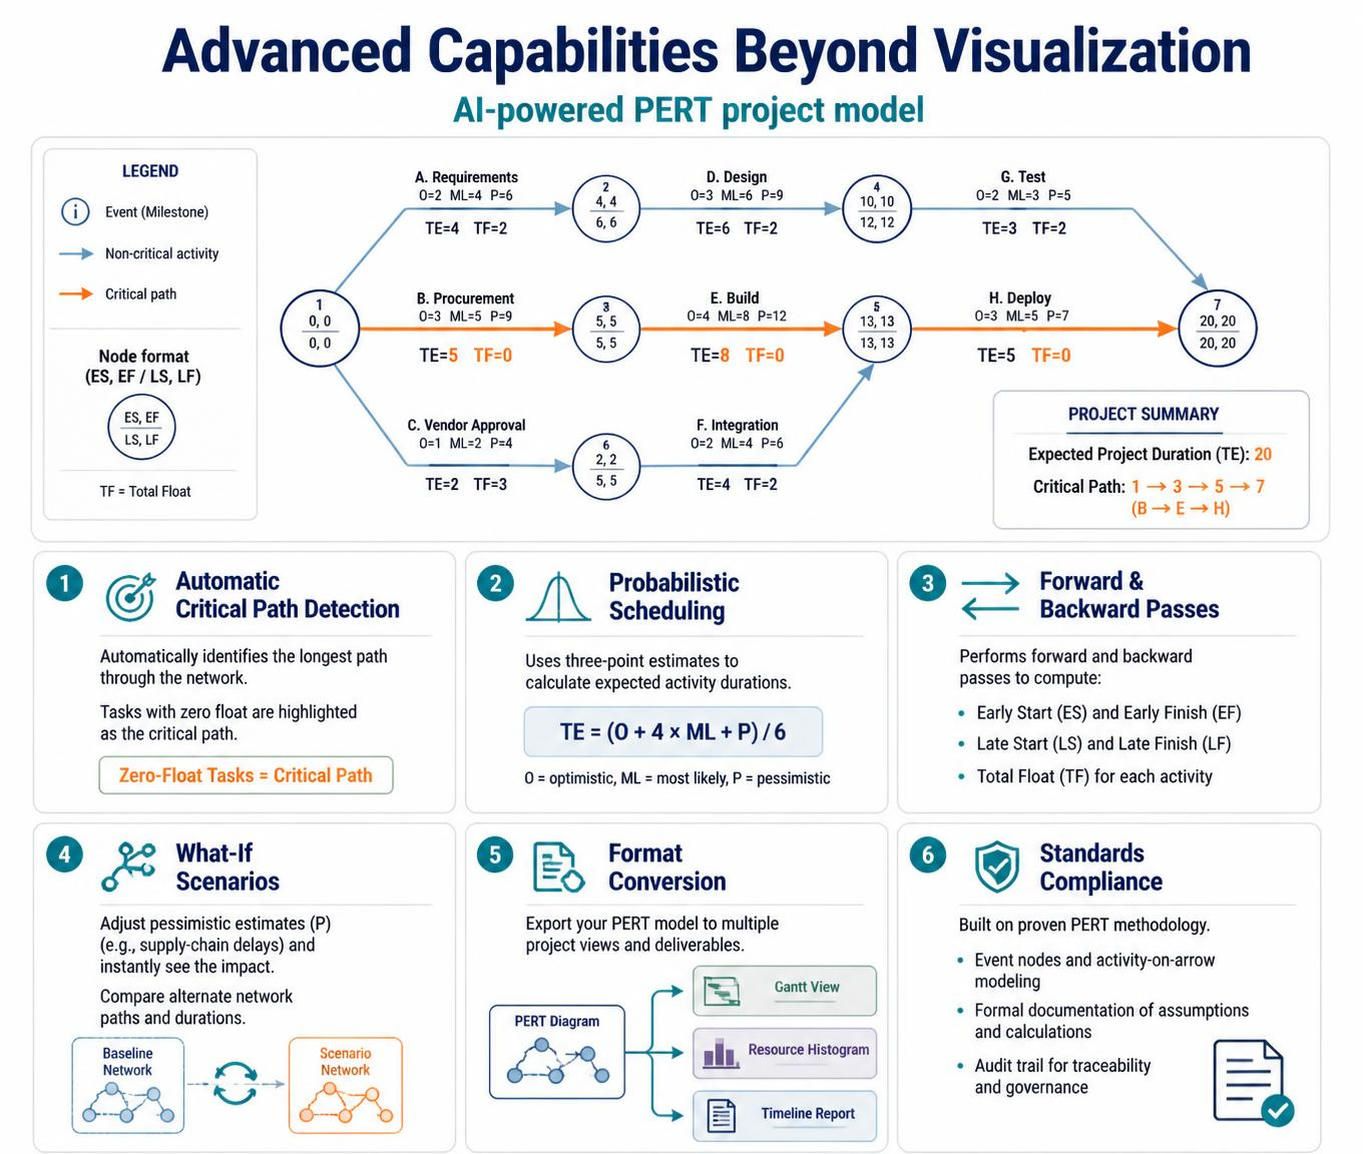
In the realm of project management, visualization is merely the starting point. The true power of a network diagram lies in its ability to function as a computational engine. This tutorial explores the advanced capabilities of the AI-powered PERT (Program Evaluation and Review Technique) model found in Visual Paradigm. We will move beyond static drawing to understand how intelligent scheduling engines automatically calculate project timelines, detect critical risks, and simulate complex “What-If” scenarios.
1. The Anatomy of the Intelligent PERT Model
Unlike a simple flowchart, a PERT chart is a mathematical representation of a project’s sequence. The AI generates a fully analytical model where every node and arrow carries specific data. By examining the system architecture, we can decode the information density of the diagram.
Understanding the Node Data Structure
The core of the PERT analysis is the “Event Node” (the circle). In this advanced model, each node is a data container holding four specific values, often referred to as the “Big Four” in scheduling:
- ES (Early Start): The earliest time an activity can begin.
- EF (Early Finish): The earliest time an activity can be completed.
- LS (Late Start): The latest time an activity can begin without delaying the project.
- LF (Late Finish): The latest time an activity can be completed without delaying the project.
The diagram visualizes these values within the circles. For example, in the activity B. Procurement, the node displays 5, 5 (Early times) and 5, 5 (Late times). Because the Early Start matches the Late Start (0 variance), this task is identified as critical.
2. The Critical Path Method (CPM) Logic
The most vital function of the AI engine is Automatic Critical Path Detection. This is not merely a visual highlight; it is a mathematical result derived from the longest path through the network.
- Identifying the Bottleneck: The AI computes the path with the longest duration. In our model, the path
1 → 3 → 5 → 7represents the sequence of activities B (Procurement) → E (Build) → H (Deploy). - Zero Float Rule: Any task on this path has a Total Float (TF) of 0. This means there is no flexibility; a delay in any of these tasks will directly delay the final project delivery.
- Visual Cue: The system highlights these zero-float tasks in orange (the Critical Path), distinguishing them from non-critical tasks which have “slack” or buffer time.
3. Probabilistic Scheduling with PERT Formulas
Traditional project management often relies on single-point estimates (e.g., “This task takes 5 days”). However, real-world projects involve uncertainty. The AI-powered model implements the classic Pert Formula to calculate an Expected Time (TE) based on three-point estimates:
- O (Optimistic): The best-case scenario.
- ML (Most Likely): The most probable duration.
- P (Pessimistic): The worst-case scenario.
The AI automatically applies the weighted average formula:
TE = (O + 4 × ML + P) / 6For instance, looking at Activity A (Requirements), the values are O=2, ML=4, P=6. The calculation is:
TE = (2 + (4 × 4) + 6) / 6 = 4This probabilistic approach allows for “risk-aware planning,” acknowledging that while the most likely time is 4 days, the weighted average accounts for potential risks.
💡 Pro Tip: Float is Not Free
While non-critical tasks have “Total Float” (slack time), remember that float is a shared resource. If you use up all the float for a task to delay it, that task immediately becomes critical and consumes the buffer of subsequent tasks.
4. Advanced Analytical Features
Forward and Backward Pass Calculations
The AI engine performs internal calculations known as the Forward Pass (to determine Early Start/Finish) and the Backward Pass (to determine Late Start/Finish). This allows the system to instantly identify non-critical paths and calculate exactly how much buffer time is available for specific activities.
What-If Scenario Analysis
One of the most powerful features is the ability to simulate risk. Because the model is analytical rather than static, you can modify the natural language prompt to alter project constraints. For example:
"Simulate a risk scenario where the Supply Chain (Activity B) has a pessimistic estimate of 12 weeks due to logistics issues."The tool instantly regenerates the chart, recalculating the TE values and potentially shifting the Critical Path to a different set of activities.
5. Standards Compliance & Format Conversion
For formal documentation, the output adheres to industry-standard Activity-on-Arrow notation. This is crucial for audit trails and presentations to governance boards, as it aligns with PMP (Project Management Professional) methodologies.
Furthermore, the system is not siloed. It supports seamless format conversion:
- Gantt View: For agile and waterfall timeline tracking.
- Resource Histograms: For workforce capacity planning.
- Timeline Reports: For executive summaries.
By leveraging these advanced capabilities, project managers move from simply drawing diagrams to building intelligent, self-updating models that drive decision-making.

 English
 Arabic
 Chinese (Simplified)
 Dutch
 French
 German
 Italian
 Japanese
 Korean
 Portuguese
 Russian
 Spanish