


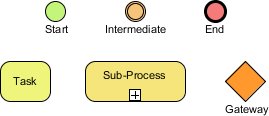
Welcome to this comprehensive tutorial on Business Process Model and Notation (BPMN). Whether you are a business analyst mapping out workflows or a developer designing system architectures, understanding the visual syntax of BPMN is crucial. This guide will break down the fundamental building blocks of a BPMN diagram, specifically focusing on Swimlanes and Flow Elements, and demonstrate how to implement them effectively using Visual Paradigm.
The Foundation: Swimlanes and Process Participants
Before diving into the specific actions of a process, we must define the “who” and the “where.” In BPMN, these containers are collectively known as Swimlanes. They provide visual clarity by segregating activities based on responsibility.
Understanding Pools and Lanes
Swimlanes are graphical containers representing process participants. There are two distinct types you will encounter:
- Pools: These represent external or major participants. A pool acts as a container for a specific business process. If a process involves multiple organizations (e.g., a Customer and a Bank), they are typically represented by separate Pools to show inter-organizational communication.
- Lanes: These are sub-partitions within a Pool. Lanes are used to further categorize activities by specific roles, departments, or systems within that organization. For instance, within a “Sales Department” Pool, you might have Lanes for “Sales Representative,” “Manager,” and “Finance.”
Using Swimlanes effectively prevents ambiguity. If a “Task” is placed in a specific Lane, it is immediately clear which role is responsible for executing that work.
Defining Behavior: The Flow Elements
Once the structure is set, we populate the diagram with Flow Elements. These elements define the actual behavior and sequence of the process. BPMN 2.0 classifies these into three main categories:
1. Events
Events are things that happen during the course of a process. They are represented by circles and are usually depicted with a thin outline. Events have a beginning and an end, and they influence the flow of the process.
- Start Events: These trigger the process. They mark the point at which a process begins.
- Intermediate Events: These occur between the start and end. They can represent delays, message receptions, or timer triggers.
- End Events: These signify the conclusion of a process or a specific path within it.
2. Activities
Activities represent the work performed within a process. They are the “meat” of the diagram.
- Tasks: These are the smallest unit of work. A task is an atomic activity that is not detailed further in the current diagram (e.g., “Approve Loan” or “Send Email”).
- Sub-Processes: These are complex activities that can be broken down into more detailed steps. They act as containers for other elements. In a high-level diagram, a sub-process is collapsed, but you can drill down into it to see the detailed workflow.
3. Gateways
Gateways control the flow paths based on logic and decision points. They do not perform work themselves but determine which path the process takes next.
- Decision Gateways: These split the flow based on conditions (e.g., “Is the budget approved?”).
- Merging Gateways: These converge multiple paths back into a single flow.
Implementation Guide: Modeling in Visual Paradigm
To create these diagrams, industry professionals rely on robust modeling tools. Visual Paradigm is a premier tool for BPMN modeling, offering intuitive drag-and-drop interfaces and strict adherence to BPMN 2.0 standards.
Setting Up Your Swimlanes
In Visual Paradigm, you begin by creating a Pool to represent the main process. Inside this pool, you can right-click to add Lanes. You can then assign roles (like “User” or “System”) to these lanes to define responsibility clearly.
Constructing the Flow
Once your lanes are ready, you can drag the following elements from the toolbar onto your canvas:
- Start Event: Drag the circle icon into the first lane to initiate the process.
- Tasks: Drag the rounded rectangle labeled “Task” into the appropriate lane.
- Gateways: Use the diamond shape to introduce decision logic.
- Sub-Processes: Use the larger rounded rectangle with a plus sign to encapsulate complex logic.
Connect these elements using Sequence Flows (solid arrows) to define the order of execution. If you are modeling message exchanges between different Pools, use Message Flows (dashed arrows).
Visual Reference: BPMN Shapes
Below is a quick reference guide to the standard shapes you will encounter when using the Visual Paradigm toolbar:
graph TD
    A[Start Event: Circle] --> B[Task: Rounded Rect]
    B --> C{Gateway: Diamond}
    C -->|Yes| D[Sub-Process: Large Rect]
    C -->|No| E[End Event: Thick Circle]
    D --> F[Task]
    F --> E
    style A fill:#90EE90,stroke:#333,stroke-width:2px
    style B fill:#FFFF99,stroke:#333,stroke-width:2px
    style C fill:#FFA500,stroke:#333,stroke-width:2px
    style D fill:#FFFF99,stroke:#333,stroke-width:2px
    style E fill:#FF6347,stroke:#333,stroke-width:2px
As shown in the diagram above, the Start Event is typically green, while the End Event is red. Tasks and Sub-Processes are usually yellow. This color coding helps stakeholders quickly identify the status and type of process element at a glance.
Conclusion
Mastering BPMN requires a solid understanding of both the structural containers (Swimlanes) and the behavioral elements (Events, Activities, Gateways). By utilizing Visual Paradigm, you can ensure that your models are not only visually accurate but also semantically correct, paving the way for successful process automation and optimization.

 English
 Arabic
 Chinese (Simplified)
 Dutch
Dutch French
 German
 Italian
 Japanese
 Korean
 Portuguese
 Russian
 Spanish