


Software architecture documentation often feels overwhelming. Developers either create overly complex diagrams that nobody understands or skip documentation entirely, leaving teams lost in a maze of code. This is where the C4 model changes the game.
Created by Simon Brown, the C4 model is a simple, hierarchical approach to software architecture visualization. Think of it as Google Maps for your software: you start with a world view and progressively zoom in until you see individual streets and buildings. This tutorial will walk you through all four levels of the C4 model with practical examples, code snippets, and guidance on using modern tools like Visual Paradigm to create professional architecture diagrams that actually help your team.
Level 1: The System Context Diagram
The journey begins at the highest level of abstraction. The Level 1: System Context Diagram (or simply “Context Diagram”) provides a bird’s-eye view of the software system you are building.
Its primary goal is to define the boundaries of the system. It answers the question: “What are we building, and who or what is it talking to?”
Key Elements
- Software System (The Centerpiece): Represented as a single box. In our example, this is the “E-Banking System.”
- People (Users): Represented as stick figures. These are the humans interacting with the system (e.g., Customers, Staff).
- External Systems: Represented as boxes or cloud icons. These are other systems outside your control that your system communicates with (e.g., Mainframes, Third-Party APIs).
- Relationships: Lines connecting the system to people and external systems, labeled with the data being passed (e.g., “Processes Transaction”).
Level 2: The Container Diagram
Now that we know what the system is, we need to see what it is made of. The Level 2: Container Diagram zooms in to show the high-level building blocks of the system.
A Container is a deployable unit. It is a distinct part of the system that runs in its own runtime environment. Examples include a Web Application, a Mobile App, a Microservice, or a Database.
Visualizing the Zoom
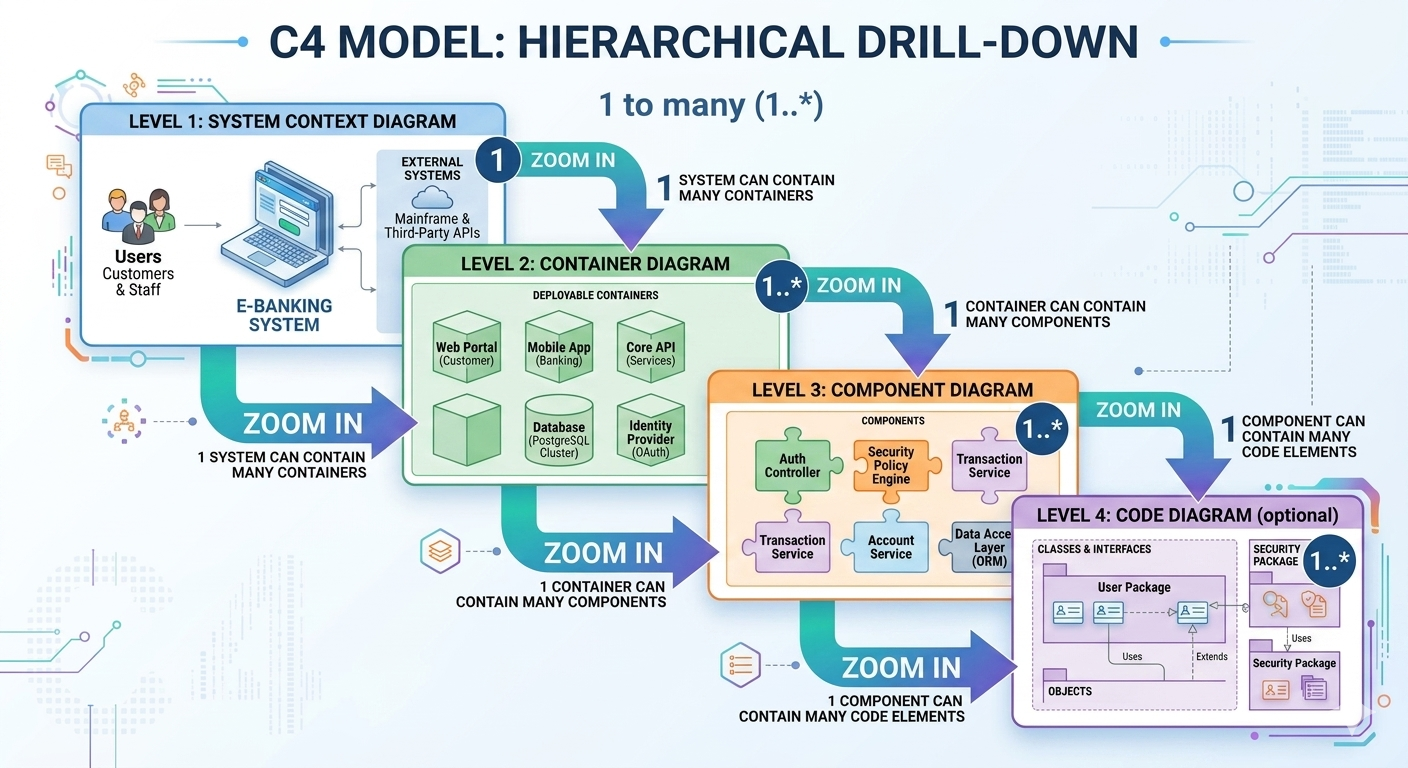
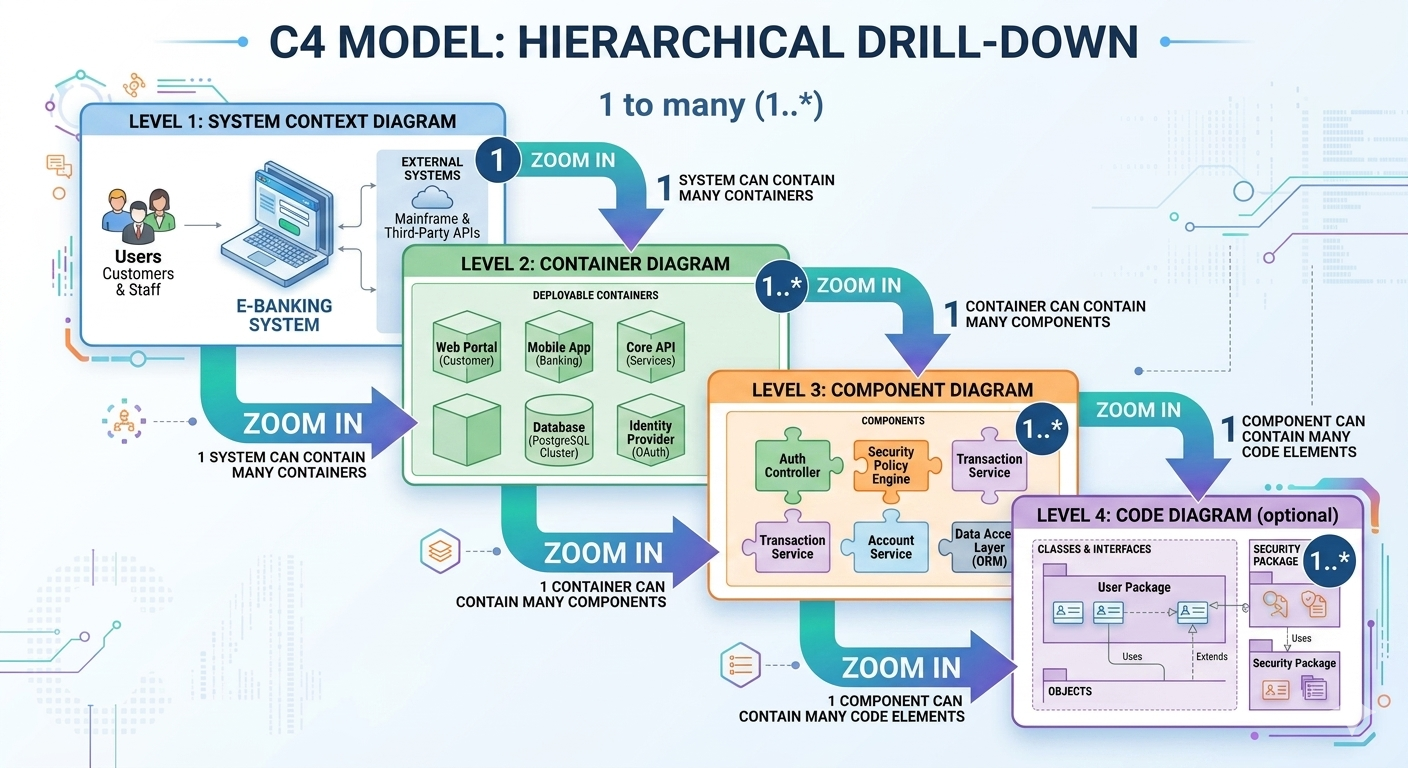
As shown in the “Zoom In” transition of the C4 model, a single System (Level 1) contains many Containers (Level 2). If the System is a “City,” the Containers are the “Buildings.”
Example Scenario
In our E-Banking example, the system isn’t just one monolithic block. It consists of:
- Web Portal: The website users visit.
- Mobile App: The iOS/Android application.
- Core API: The backend service handling logic.
- Database: Where data is stored.
Level 3: The Component Diagram
Containers are often too large to understand fully. We need to see how they work. The Level 3: Component Diagram zooms in on a specific container to reveal its internal architecture.
A Component is a logical grouping of functionality. It is not a single class or file, but a cohesive piece of functionality within a container. Components usually map to classes, packages, or modules in your code.
Drilling Down into the “Core API”
Let’s look inside the Core API container from Level 2. Inside, we find:
- Auth Controller: Handles user login and token validation.
- Security Policy Engine: Applies rules to requests.
- Transaction Service: Handles money movement logic.
- Account Service: Manages account details.
This level is crucial for developers because it shows how the “black box” of the container is actually constructed and how different pieces of logic interact.
Level 4: The Code Diagram (Optional)
The Level 4: Code Diagram is the most granular level. It zooms in on a specific component to show the actual code structure.
This level is often optional and can become extremely detailed. It typically shows:
- Classes & Interfaces: The specific classes involved in a feature.
- Relationships: How classes extend, implement, or use one another.
- Objects: Instantiations of classes.
In our example, a Level 4 diagram might show the User Package containing specific classes like User, Customer, and Admin, and how they relate to the Security Package.
Implementing C4 with PlantUML and Visual Paradigm
While you can draw these diagrams by hand, using tools like Visual Paradigm or generating them via code (like PlantUML) ensures consistency and maintainability. Visual Paradigm offers specific support for the C4 model, allowing you to generate these diagrams from your code or model them visually.
Here is how you might represent the Level 1: System Context using PlantUML syntax, which can be rendered in Visual Paradigm or other UML tools:
@startuml
title Level 1: System Context Diagram

skinparam packageStyle rectangle
skinparam componentStyle rectangle

actor "Customer" as customer
actor "Staff" as staff
package "E-Banking System" {
    [E-Banking Application] as app
}

package "External Systems" {
    [Mainframe] as mainframe
    [Third-Party APIs] as api
}

customer --> app : Uses Web Portal
staff --> app : Uses Admin Portal
app --> mainframe : Syncs Data
app --> api : Fetches Exchange Rates

@enduml
Why Use This Approach?
By defining the architecture hierarchically, you avoid the “spaghetti diagram” problem. You provide the right level of detail for the right audience:
- Management/Executives: Look at Level 1 to understand the business scope.
- Product Owners: Look at Level 2 to understand the technology stack.
- Developers: Look at Level 3 and 4 to understand how to write code.
Mastering the C4 model transforms architecture documentation from a chore into a powerful communication tool that aligns your entire team.

 English
 Arabic
 Chinese (Simplified)
 Dutch
 French
 German
 Italian
 Japanese
 Korean
 Portuguese
 Russian
 Spanish