


Introduction
In today’s fast-paced business environment, clear communication of processes and workflows is critical for operational efficiency and team alignment. Traditional methods of documenting procedures—whether through lengthy text descriptions or disconnected diagramming tools—often lead to misunderstandings, version control issues, and maintenance overhead. Visual Paradigm OpenDocs revolutionizes this landscape by integrating powerful flowchart creation capabilities directly into your documentation workspace, enhanced by AI assistance that transforms natural language prompts into professional process diagrams.
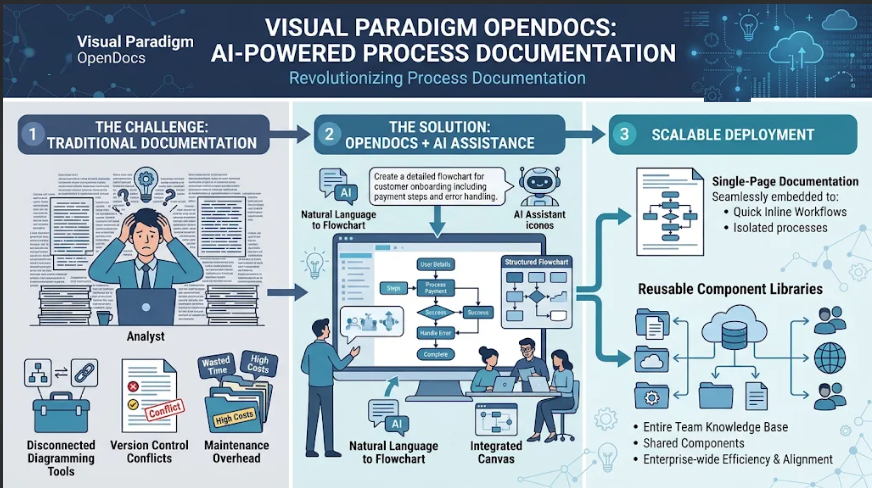
This guide explores how teams can leverage Visual Paradigm’s ecosystem to create, manage, and deploy flowcharts efficiently, whether for single-page documentation or reusable component libraries that span entire knowledge bases.
Key Concepts
What Are Flowcharts in OpenDocs?
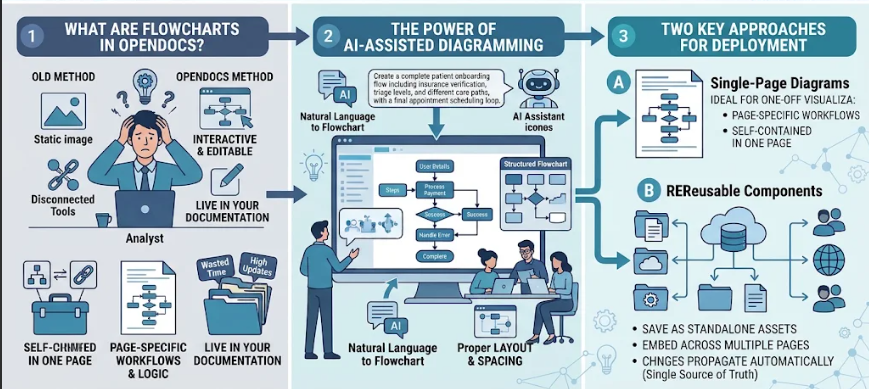
Flowcharts in Visual Paradigm OpenDocs are interactive, editable diagrams that represent business processes, decision logic, and operational workflows. Unlike static images exported from external tools, OpenDocs flowcharts remain live within your documentation, allowing for real-time updates and maintaining a single source of truth.
The Power of AI-Assisted Diagramming
Visual Paradigm’s AI engine understands natural language descriptions of processes and can automatically generate complete flowchart structures including:
- Process steps and activities
- Decision nodes with branching logic
- Connectors showing flow direction
- Proper layout and spacing
Reusable Components vs. Single-Page Diagrams
Reusable Components: Master flowcharts saved as standalone assets that can be embedded across multiple pages. Changes to the master automatically propagate to all instances.
Single-Page Diagrams: Self-contained flowcharts created directly within a specific page, ideal for one-off visualizations or page-specific workflows.
Method 1: Creating Reusable Flowchart Components
When to Use This Approach
- Standard operating procedures referenced across multiple documents
- Core business processes used by various teams
- Approval workflows that appear in different policy documents
- System architectures referenced throughout technical documentation
Step-by-Step Implementation
Step 1: Create the Component Page
- Navigate to your document tree or node view
- Click the Plus (+) icon next to the desired parent node
- Select “New Component Page”
- Choose “Flowchart” as the diagram type
- A blank editor opens with the full Visual Paradigm flowchart toolkit
Step 2: Build Your Flowchart
Option A: Manual Construction
- Drag and drop shapes from the palette (process boxes, decisions, terminators, etc.)
- Connect elements using directional arrows
- Add labels and annotations
- Arrange elements for optimal readability
Option B: AI-Powered Generation
- Click “Create with AI” button
- Enter a natural language description, such as:
“Create a flowchart for employee expense approval: Employee submits expense report → Manager reviews → If under $500, auto-approve; if over $500, send to Finance Director → Finance Director approves or rejects → Notification sent to employee → Process ends” - Review and refine the AI-generated structure
- Adjust positioning, add missing details, or modify decision logic
Step 3: Save and Finalize
- Click “Save” to store your flowchart as a reusable component
- Use the Back Arrow to return to your document structure
- Your flowchart is now available for insertion anywhere in your knowledge base
Step 4: Insert Into Target Pages
- Open any page where you want the flowchart to appear
- Enter edit mode
- Click “Insert” → “Diagrams” → “Import Existing”
- Select your saved flowchart component
- The diagram appears instantly on your page
Example: Customer Onboarding Workflow
AI Prompt:
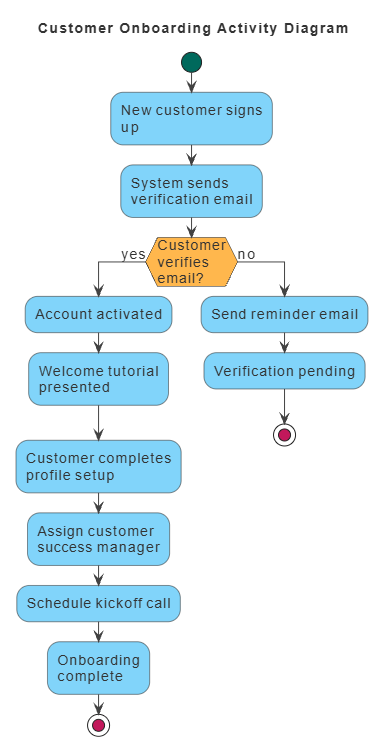
“Generate a customer onboarding flowchart: New customer signs up → System sends verification email → Customer verifies email → Account activated → Welcome tutorial presented → Customer completes profile setup → Assign customer success manager → Schedule kickoff call → Onboarding complete”
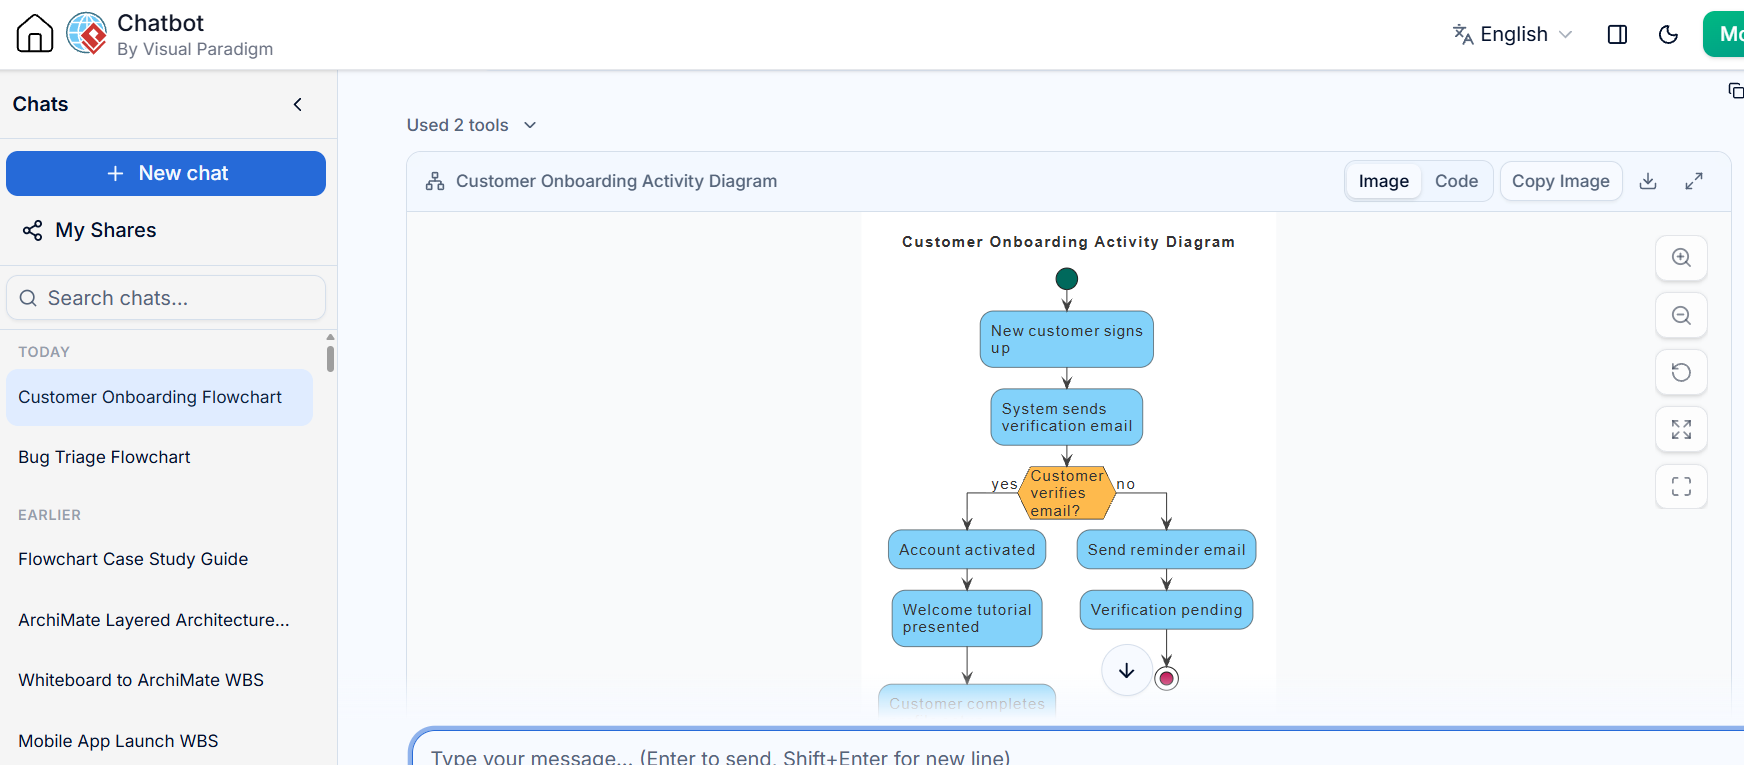
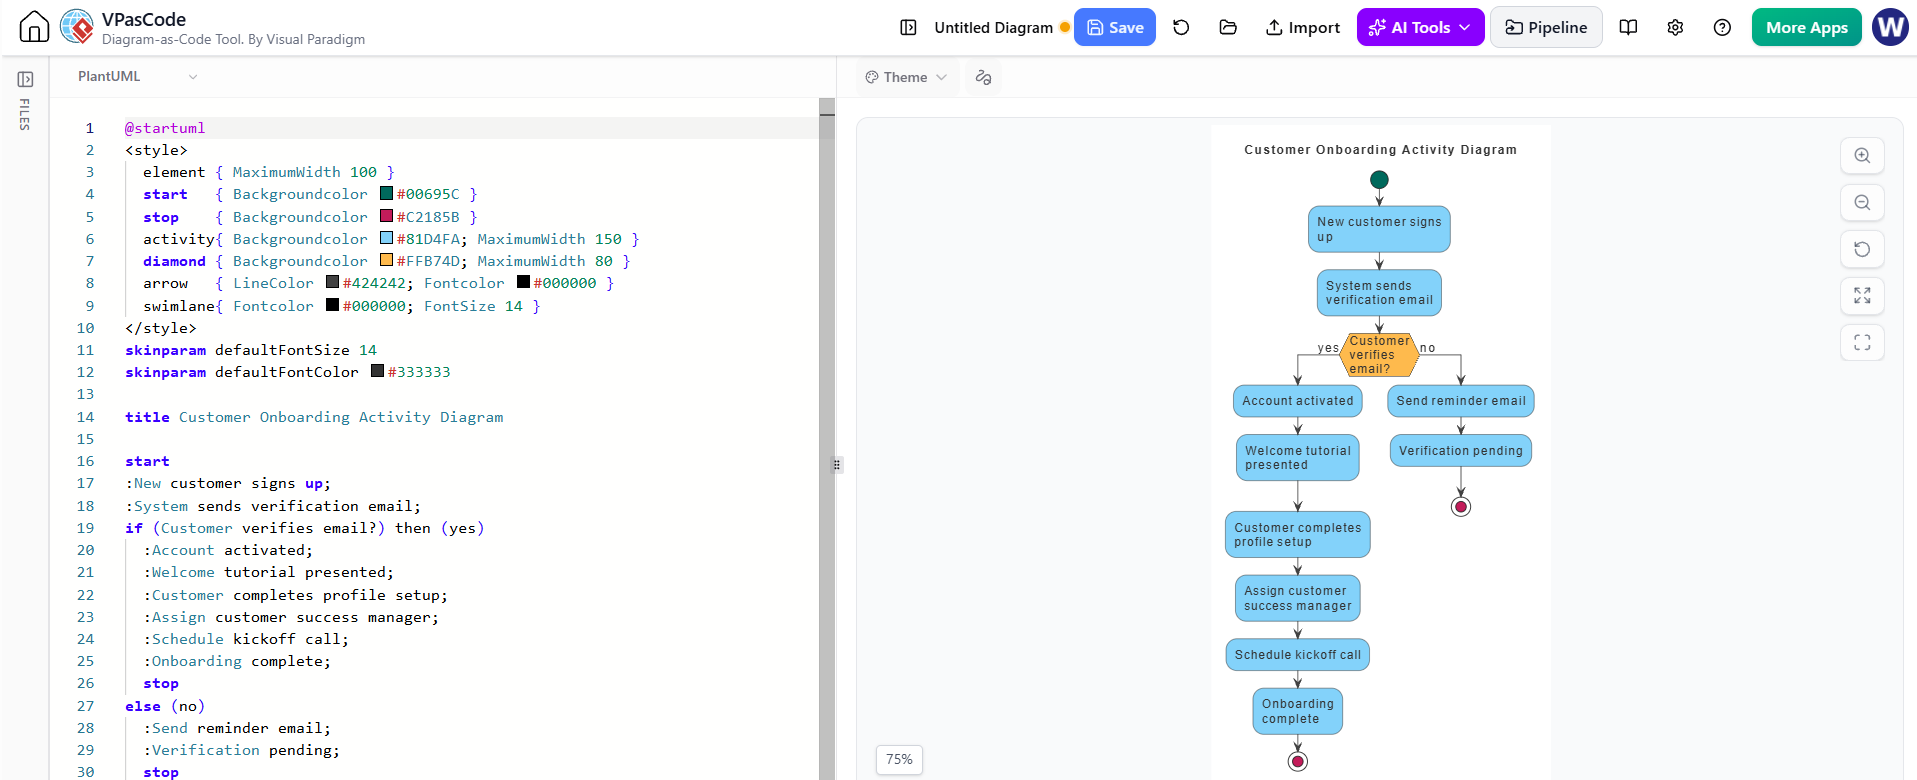
Result: A clean, professional flowchart showing the eight-step onboarding journey with proper connectors and decision points, ready to be embedded in sales documentation, support guides, and training materials.
Method 2: Creating Single-Page Flowcharts
When to Use This Approach
- Page-specific process explanations
- Quick visual aids for particular sections
- Temporary or experimental workflow diagrams
- One-time reference diagrams
Step-by-Step Implementation
Step 1: Access the Editor
- Open your target page in edit mode
- Click “Insert” → “Diagrams” → “Flowchart”
- The flowchart editor overlays directly on your page
Step 2: Create Your Diagram
- Build manually using the shape library and connector tools
- Or use “Create with AI” with a specific prompt relevant to that page’s content
- Make adjustments to match your exact requirements
Step 3: Save and Close
- Click “Save” to embed the flowchart directly into the page
- Close the editor
- The flowchart becomes part of the page content
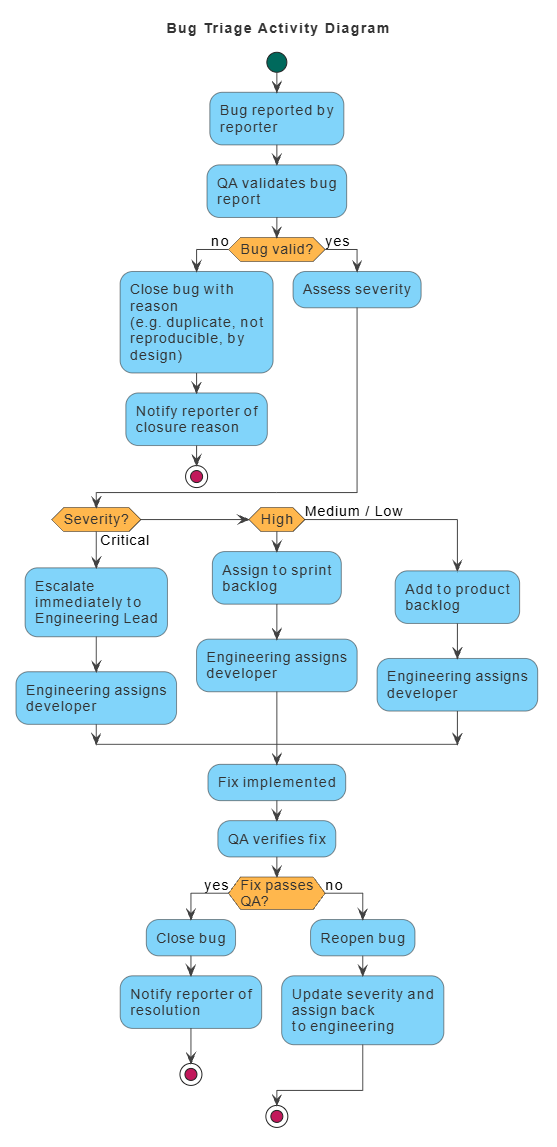
Example: Bug Triage Process
AI Prompt:
“Create a bug triage flowchart for our development team: Bug reported → QA validates → If invalid, close with reason; if valid, assess severity → Critical: immediate escalation to engineering lead; High: assign to sprint backlog; Medium/Low: add to product backlog → Engineering assigns developer → Fix implemented → QA verifies fix → If passes, close bug; if fails, reopen → Notify reporter of resolution”
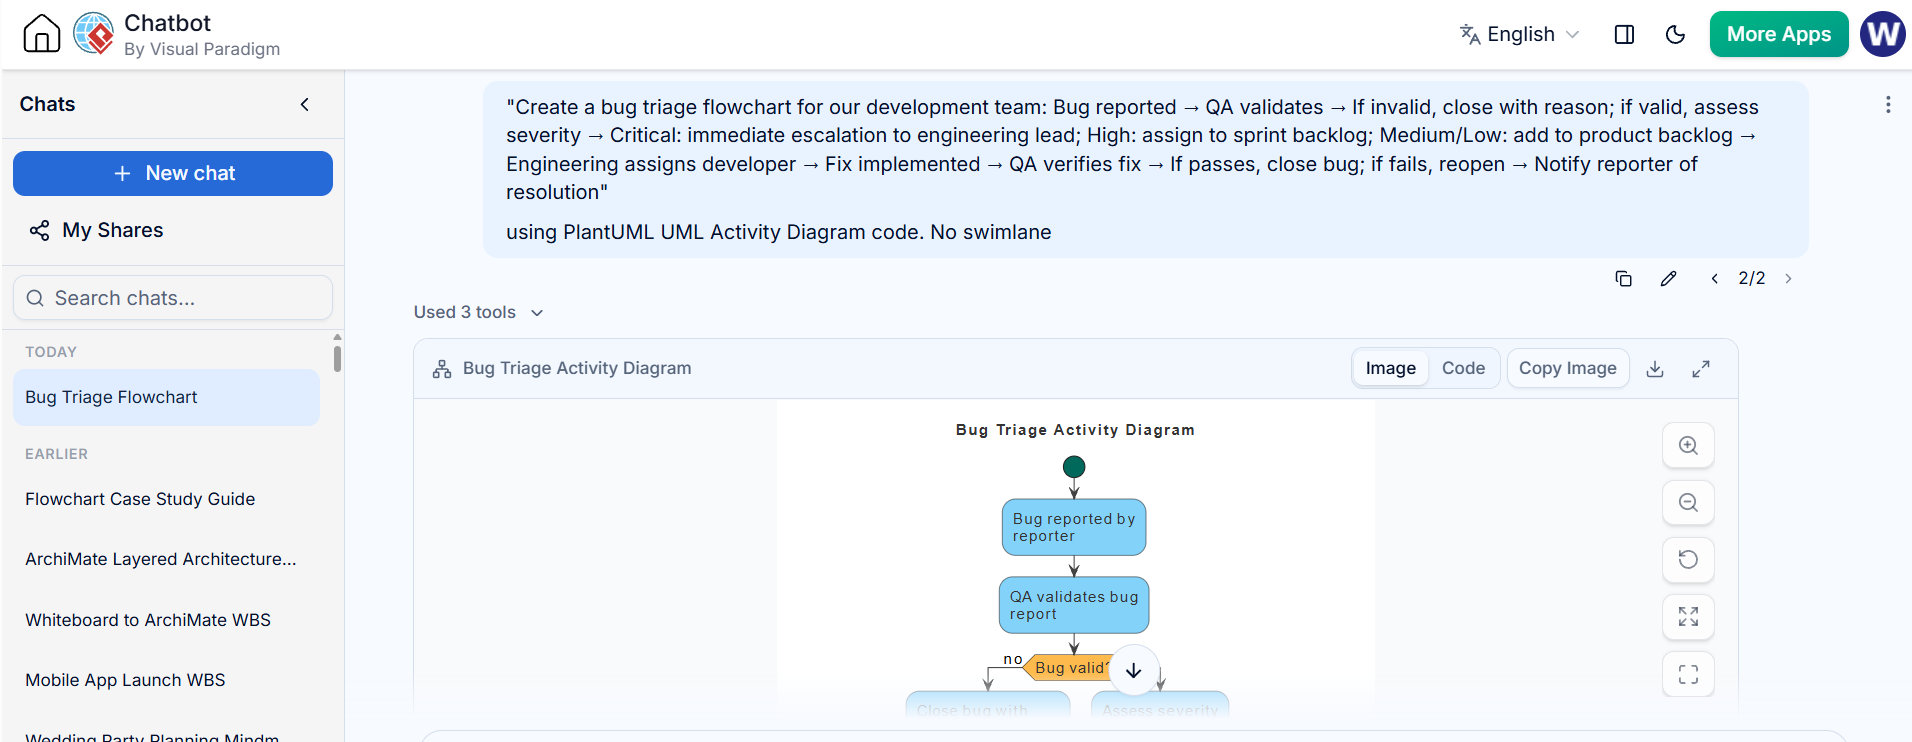
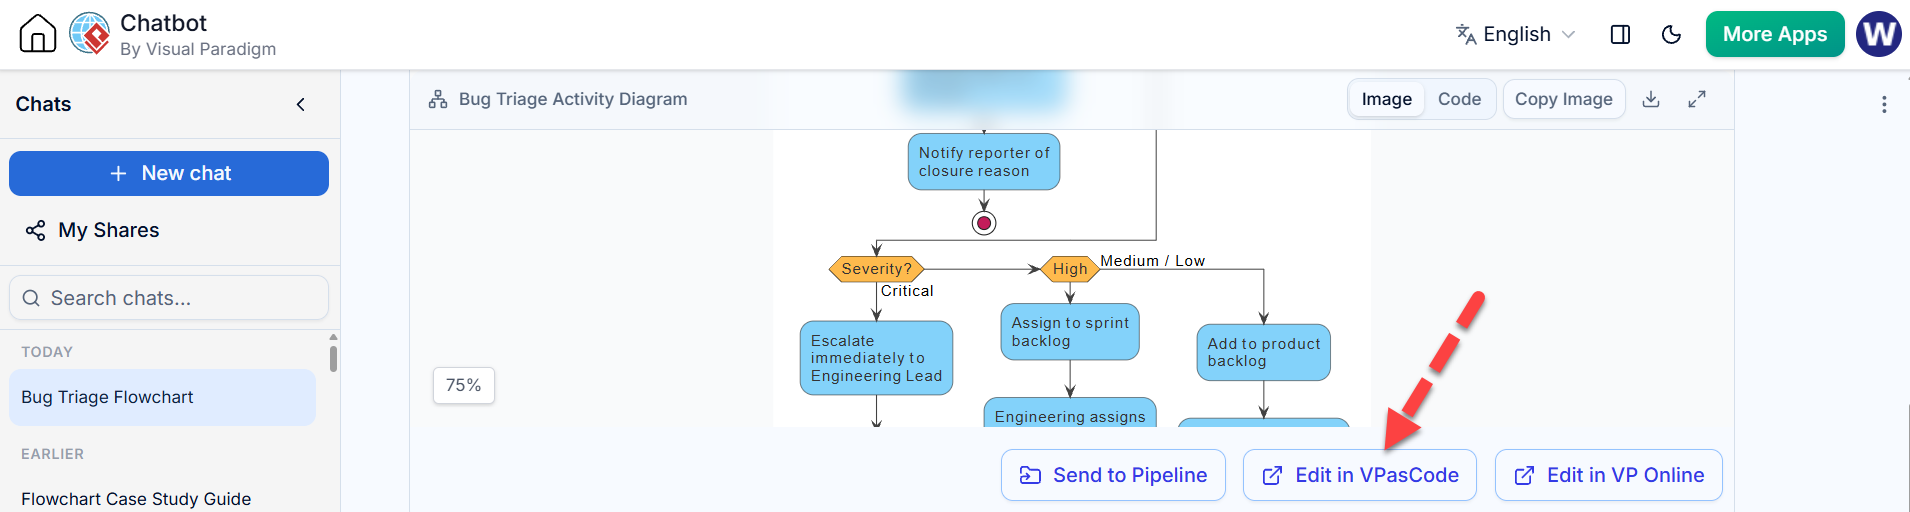
Send to VPasCode for validation:
Render the Flowchart in VPasCode Tool:
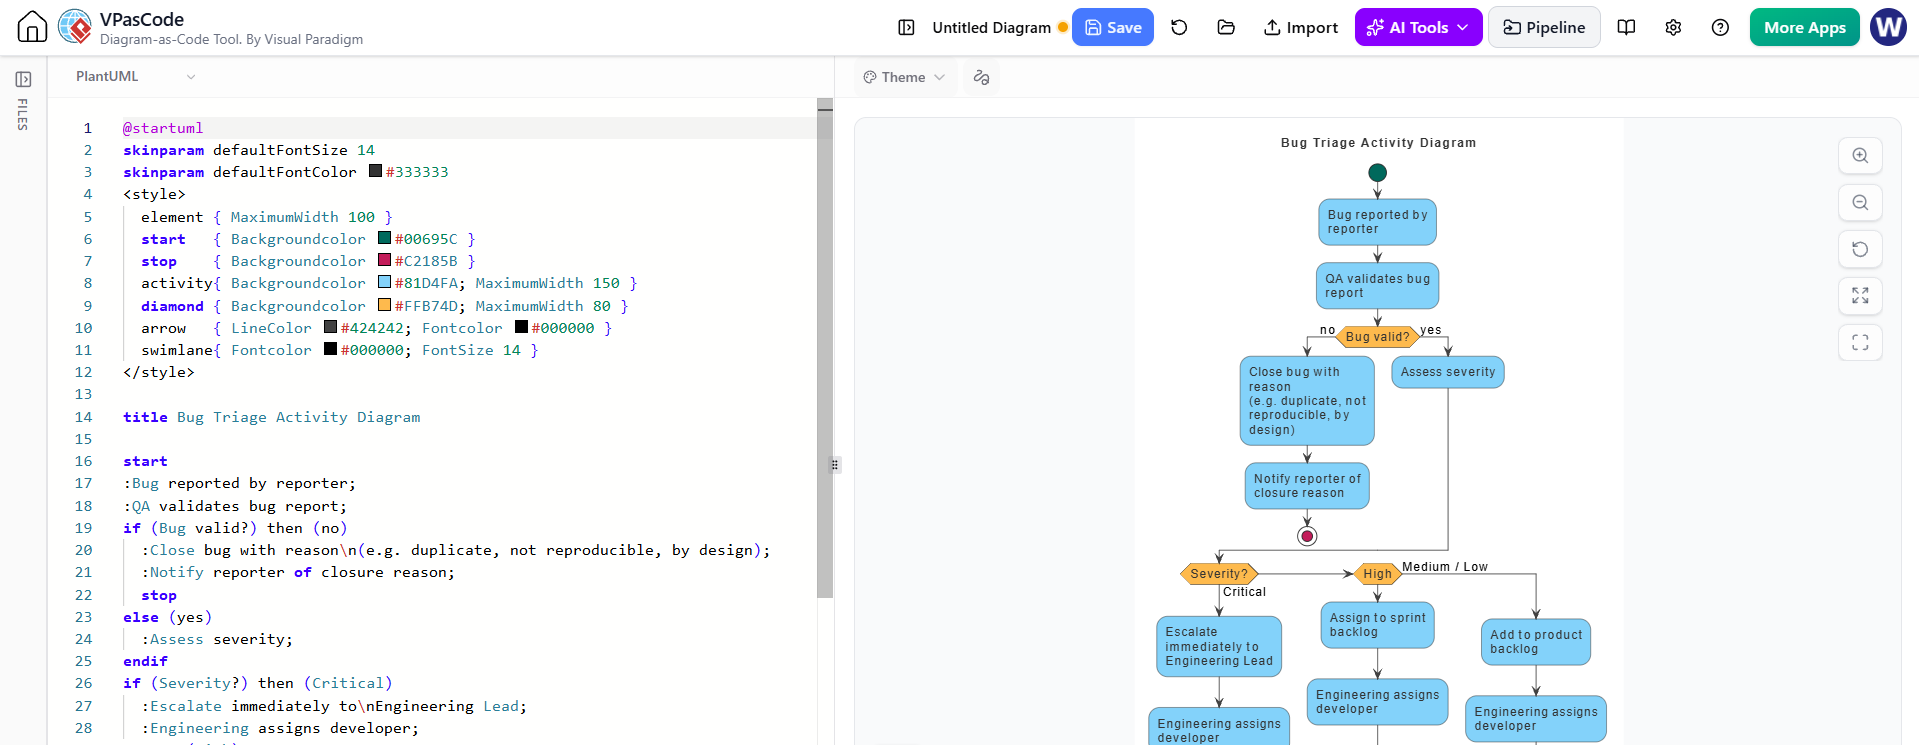
Result: A comprehensive triage workflow embedded directly in your quality assurance documentation page.
Practical Applications Across Teams
Process Engineers & Operations Leads
- Document standard operating procedures with embedded approval flows
- Create visual policy guidelines that teams can easily follow
- Integrate with AI Chatbot Tools to allow employees to query process documentation conversationally
- Maintain living documents that evolve with process improvements
Software Developers & Technical Analysts
- Map system decision logic and control flows
- Visualize user journey paths and interaction sequences
- Leverage VPasCode or the browser-based VPasCode Editor for custom automation scripts that generate or modify flowcharts programmatically
- Document API workflows and integration patterns
Technical Writers & Project Managers
- Create step-by-step onboarding guides with visual process maps
- Align cross-functional teams with shared visual understanding
- Reduce ambiguity in requirement specifications
- Accelerate new hire training with clear procedural visuals
Product Managers
- Visualize feature development workflows
- Map user stories to implementation processes
- Document release management procedures
- Create stakeholder communication materials showing product lifecycle stages
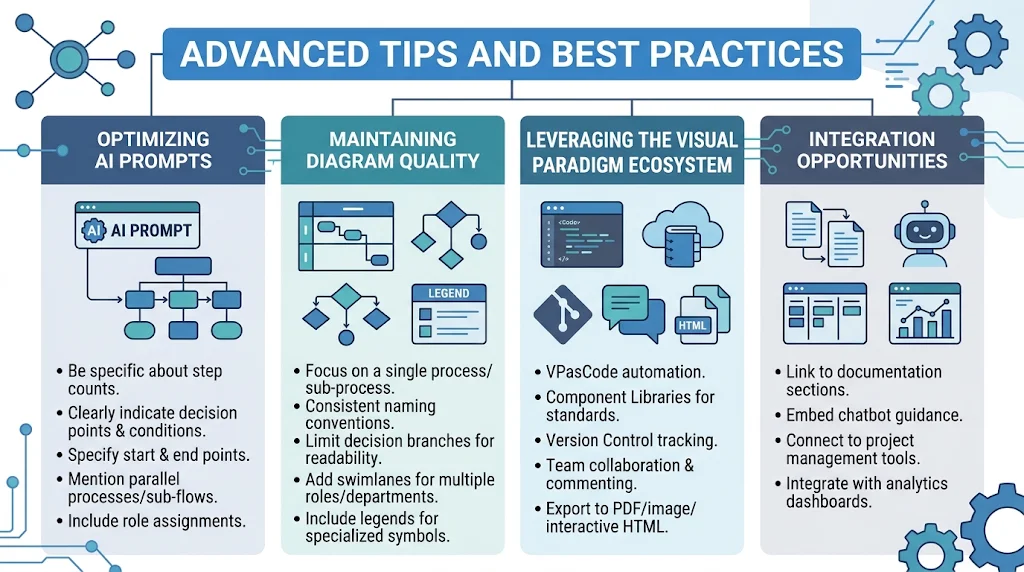
Advanced Tips and Best Practices
Optimizing AI Prompts
- Be specific about the number of steps
- Clearly indicate decision points and their conditions
- Specify the starting and ending points
- Mention any parallel processes or sub-flows
- Include role assignments where relevant
Maintaining Diagram Quality
- Keep flowcharts focused on a single process or sub-process
- Use consistent naming conventions for similar actions
- Limit decision branches to maintain readability
- Add swimlanes when multiple roles or departments are involved
- Include legends for any specialized symbols
Leveraging the Visual Paradigm Ecosystem
- VPasCode: Automate diagram generation and modification through code
- Component Libraries: Build organizational standards for common process patterns
- Version Control: Track changes to critical process documentation
- Collaboration Features: Enable team review and commenting on flowcharts
- Export Options: Generate PDFs, images, or interactive HTML versions when needed
Integration Opportunities
- Link flowcharts to related documentation sections
- Embed chatbot interfaces for interactive process guidance
- Connect to project management tools for status tracking
- Integrate with analytics dashboards showing process performance metrics
Conclusion
Visual Paradigm OpenDocs transforms flowchart creation from a tedious, disconnected task into an integrated, AI-enhanced experience that keeps your process documentation alive and actionable. Whether you’re building reusable component libraries for enterprise-wide standardization or creating quick single-page visualizations for specific contexts, the platform provides the flexibility and power needed for modern technical documentation.
By combining AI-powered generation with manual refinement capabilities, teams can produce professional flowcharts in minutes rather than hours. The ability to embed these diagrams directly within living documents ensures that process knowledge remains accessible, up-to-date, and tightly coupled with supporting textual documentation.
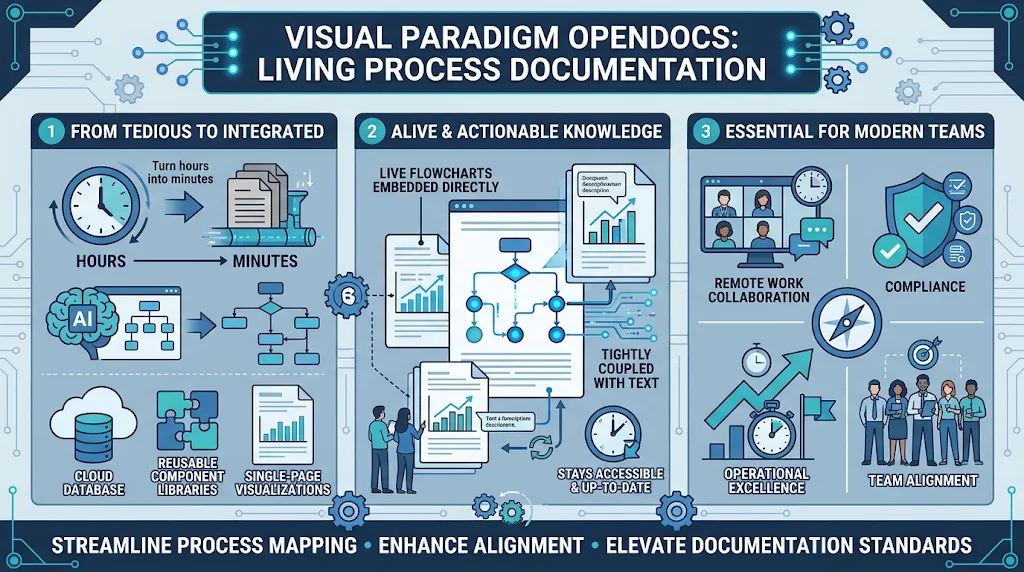
As organizations increasingly rely on clear process communication for remote work, compliance, and operational excellence, mastering flowchart creation in Visual Paradigm OpenDocs becomes not just a nice-to-have skill, but an essential capability for effective knowledge management. Start leveraging these tools today to streamline your process mapping, enhance team alignment, and elevate your documentation standards.

 English
 Arabic
 Chinese (Simplified)
 Dutch
 French
 German
 Italian
 Japanese
 Korean
 Portuguese
 Russian
 Spanish