


1. Introduction & Getting Started
The Solution: VPasCode – Diagram-as-Code, Unified and AI-Ready
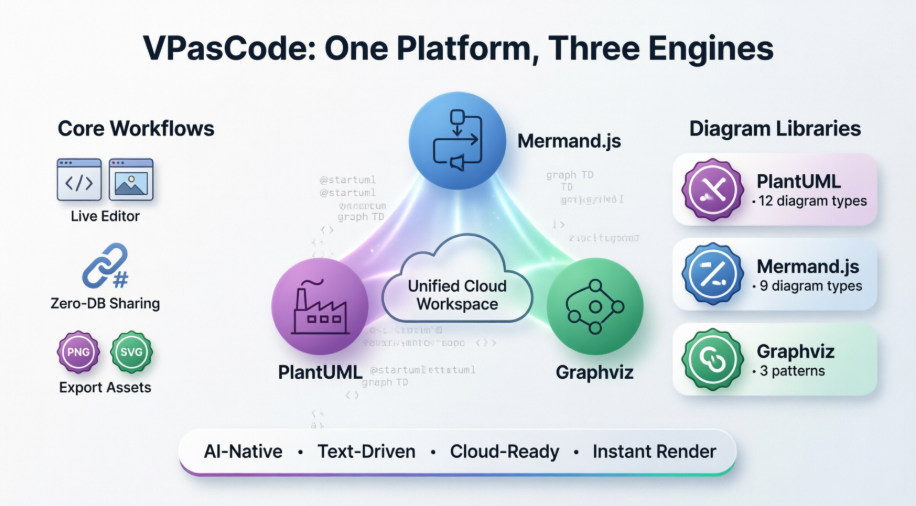
VPasCode (pronounced “V-P-as-code” 🗣️) is a cloud-native platform designed to meet developers where they work: in the text editor. Built by Visual Paradigm, it enables engineers to declare system structures, data flows, and relationships using standardized text syntax—then instantly renders them into clean, professional diagrams.
Core Philosophy
“Write text. Leverage AI. Accelerate your documentation.”
Rather than replacing visual design suites, VPasCode complements them by offering a high-velocity, code-first workflow tailored for iterative development, CI/CD integration, and collaborative review.
Key Advantages of the Text-to-Diagram Workflow
✅ Seamless Version Control Integration
Diagrams are stored as plain-text scripts (.puml, .mmd, .dot), living alongside source code in repositories. Changes are tracked via standard Git workflows:
+ User --> AuthService: POST /login
+ AuthService --> Redis: CACHE token
- User --> LegacyAuth: (deprecated)
Pull requests become living architecture reviews—no more stale Visio files in shared drives.
✅ Automated Layout Engineering
Developers define what connects to what; VPasCode handles how it looks. Rendering engines automatically:
-
Calculate optimal node positioning and edge routing
-
Apply consistent padding, spacing, and grid alignment
-
Scale layouts responsively for different export formats
✅ Uniform Design Consistency
Text-driven scripts enforce aesthetic standards organization-wide. Teams define style themes once:
skinparam backgroundColor #EEEEEF
skinparam componentStyle uml2
skinparam shadowing false
Every diagram inherits these rules—ensuring brand-aligned, publication-ready visuals without manual formatting.
The AI Frontier: Natural Language to Architecture Diagrams
One of VPasCode’s most transformative capabilities is its native compatibility with Artificial Intelligence. While LLMs struggle with binary canvas formats, they excel at generating structured text.
Real-World AI Workflow Example:
-
Prompt: “Create a microservice pipeline where an API gateway routes requests to a user service with a Redis cache”
-
AI Output (Mermaid syntax):
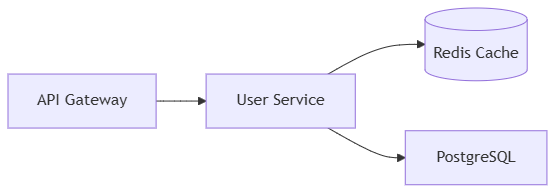
graph LR
  A[API Gateway] --> B[User Service]
  B --> C[(Redis Cache)]
  B --> D[PostgreSQL]
-
VPasCode Rendering: Instant, editable, shareable diagram
This synergy makes DaC a future-proof foundation for:
-
AI-assisted architecture prototyping
-
Automated documentation generation from code comments
-
Chatbot-powered system exploration for new team members
Unified Engine Ecosystem: One Platform, Multiple Syntaxes
The developer community has organically adopted powerful open-source diagramming engines—each with unique strengths:
| Engine | Best For | Syntax Example |
|---|---|---|
| PlantUML | Enterprise UML, rich styling | @startuml ... @enduml |
| Mermaid.js | Web docs, Markdown integration | graph TD; A-->B; |
| Graphviz | Complex networks, algorithmic layouts | digraph G { A -> B; } |
The Fragmentation Problem
Historically, leveraging these engines required:
-
Installing language-specific dependencies locally
-
Managing disparate CLI tools or web interfaces
-
Context-switching between incompatible editors
The VPasCode Solution
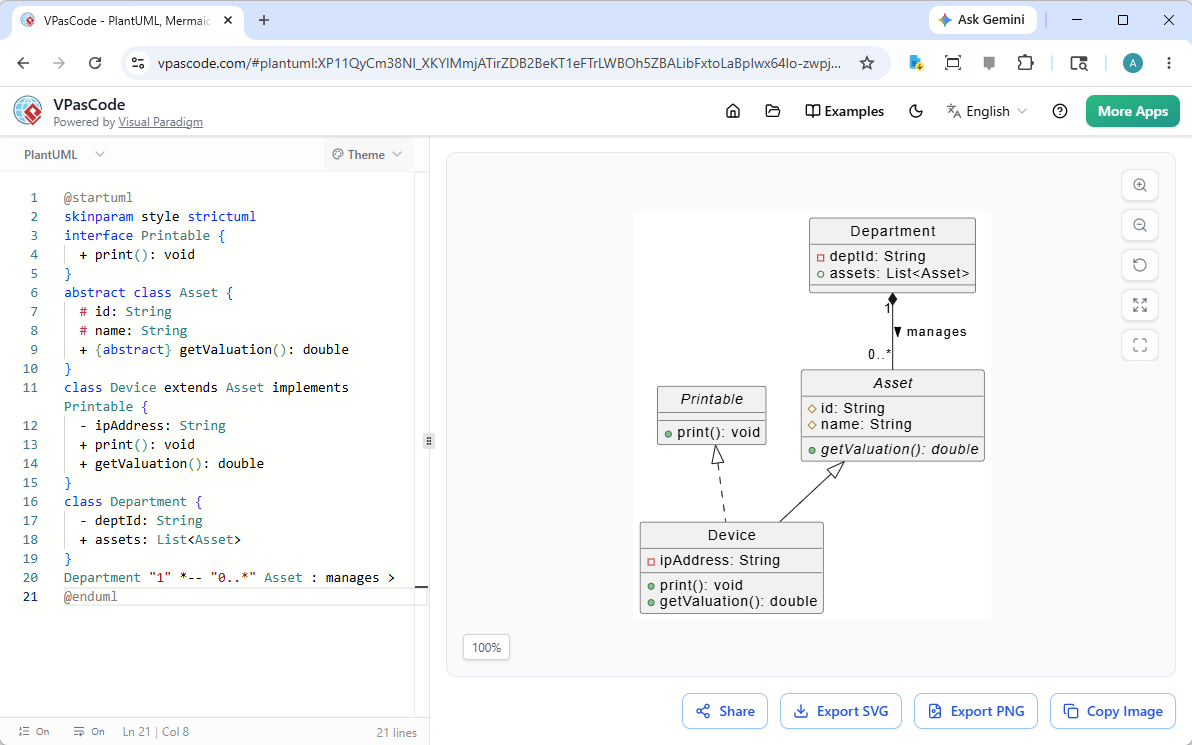
A centralized, cloud-native workspace with a dual-panel editor that auto-detects and instantly parses Mermaid, PlantUML, and Graphviz syntax—simultaneously.
No local setup. No dependency hell. Just a high-fidelity environment to write, render, and share architectural ideas.
Implementation in Practice: A Sample Workflow
-
Author: Developer writes a PlantUML script in VS Code describing a new authentication flow
-
Preview: Script auto-renders in VPasCode’s live preview panel
-
Collaborate: Share via public URL or embed in Confluence/Notion
-
Review: Team comments on the diagram within a GitHub PR
-
Merge: Diagram script merges into
docs/architecture/alongside code changes -
Automate: CI pipeline exports high-res PNG/SVG for release notes
Measurable Impact: Results from Early Adopters
While specific metrics vary by organization, teams implementing VPasCode report:
-
⏱️ 60–80% reduction in time spent creating/updating architecture diagrams
-
🔁 Near-zero documentation drift: Diagrams update automatically with code changes
-
🤝 Improved cross-functional alignment: Clear visuals accelerate stakeholder buy-in
-
🤖 AI leverage: 3x faster prototyping of new system designs via natural language prompts
-
🌐 Unified tooling: Elimination of 3–5 disparate diagramming tools per engineering org
Conclusion
✅ Bookmark this reference list for quick access during diagramming sessions
✅ Experiment with the 60-Second Quickstart Guide to create your first unified diagram
✅ Explore engine-specific playbooks to unlock advanced syntax patterns and domain-specific modeling techniques
- Welcome to VPasCode: [Insert Article Description Here: Overview of VPasCode, its mission, and core value proposition. ]
- The Unified Engine Advantage: [Insert Article Description Here: Explanation of how VPasCode unifies PlantUML, Mermaid, and Graphviz. Insert any architectural or comparison diagrams here.]
- 60-Second Quickstart Guide: [Insert Article Description Here: Step-by-step instructions to create a first diagram. Insert screenshots of the initial setup process here.]
2. Workflows and Features
- Live Editor: [Insert Article Description Here: Guide to the workspace layout, editing pane, and preview pane. Insert images of the live editor interface here.]
- Sharing: [Insert Article Description Here: How to use URL-based sharing without a database. Insert images of the share modal or URL generation process here.]
- Export PNG / SVG: [Insert Article Description Here: Instructions for exporting diagrams in high-quality formats. Insert images showing the export menu and file options here.]
3. PlantUML Playbook
-
PlantUML Syntax Basics: [Insert Article Description Here: Fundamental rules for PlantUML code. Insert basic syntax examples and rendered outputs here.]
-
Use Case Diagram: [Insert Article Description Here: How to model actors and use cases. Insert an example Use Case diagram image here.]
-
Class Diagram: [Insert Article Description Here: Defining classes, attributes, and relationships. Insert an example Class diagram image here.]
-
Sequence Diagram: [Insert Article Description Here: Modeling interactions between objects over time. Insert an example Sequence diagram image here.]
-
Activity Diagram: [Insert Article Description Here: Flowcharts and workflow modeling. Insert an example Activity diagram image here.]
-
State Diagram: [Insert Article Description Here: State machines and transitions. Insert an example State diagram image here.]
-
Object Diagram: [Insert Article Description Here: Instances of classes at a specific point in time. Insert an example Object diagram image here.]
-
Component Diagram: [Insert Article Description Here: High-level system component interactions. Insert an example Component diagram image here.]
-
Deployment Diagram: [Insert Article Description Here: Physical architecture and nodes. Insert an example Deployment diagram image here.]
-
Timing Diagram: [Insert Article Description Here: Time-constrained interactions. Insert an example Timing diagram image here.]
-
ERD: [Insert Article Description Here: Entity-Relationship modeling for databases. Insert an example ERD image here.]
-
ArchiMate Diagram: [Insert Article Description Here: Enterprise architecture modeling using ArchiMate standards. Insert an example ArchiMate diagram image here.]
-
C4 Model: [Insert Article Description Here: Context, Containers, Components, and Code levels of abstraction. Insert an example C4 diagram image here.]
4. Mermaid.js Playbook
-
Mermaid.js Syntax Basis: [Insert Article Description Here: Basic syntax rules for Mermaid. Insert basic syntax examples here.]
-
Flowchart: [Insert Article Description Here: Creating flowcharts using nodes and edges. Insert an example Flowchart image here.]
-
Class Diagram: [Insert Article Description Here: Class structures in Mermaid. Insert an example Class diagram image here.]
-
Sequence Diagram: [Insert Article Description Here: Interaction diagrams in Mermaid. Insert an example Sequence diagram image here.]
-
ERD: [Insert Article Description Here: Database schemas in Mermaid. Insert an example ERD image here.]
-
State Diagram: [Insert Article Description Here: State transitions in Mermaid. Insert an example State diagram image here.]
-
Mind Map: [Insert Article Description Here: Hierarchical idea mapping. Insert an example Mind Map image here.]
-
Gantt Chart: [Insert Article Description Here: Project timeline visualization. Insert an example Gantt Chart image here.]
-
Quadrant Chart: [Insert Article Description Here: 2×2 matrix analysis. Insert an example Quadrant Chart image here.]
-
Timeline: [Insert Article Description Here: Chronological event visualization. Insert an example Timeline image here.]
5. Graphviz Playbook
-
Graphviz Syntax Basis: [Insert Article Description Here: Introduction to the DOT language. Insert basic graph examples here.]
-
Digraph: [Insert Article Description Here: Creating directed graphs (arrows). Insert an example Digraph image here.]
-
Graph: [Insert Article Description Here: Creating undirected graphs (lines). Insert an example Graph image here.]
-
Cluster: [Insert Article Description Here: Grouping nodes into subgraphs. Insert an example Cluster image here.]
