


Introduction
In today’s complex business environment, the ability to clearly document and communicate processes is more critical than ever. Whether you’re a business analyst mapping out workflow optimizations, a software architect defining algorithmic logic, or a project manager coordinating cross-functional teams, flowcharts serve as the universal language of process documentation.
However, traditional flowcharting tools often fall short when it comes to enterprise-level requirements. They may lack integration with broader modeling frameworks, fail to provide validation capabilities, or require excessive manual effort to maintain consistency and traceability. This is where Visual Paradigm transforms the standard flowchart from a simple diagram into a powerful, intelligent modeling asset.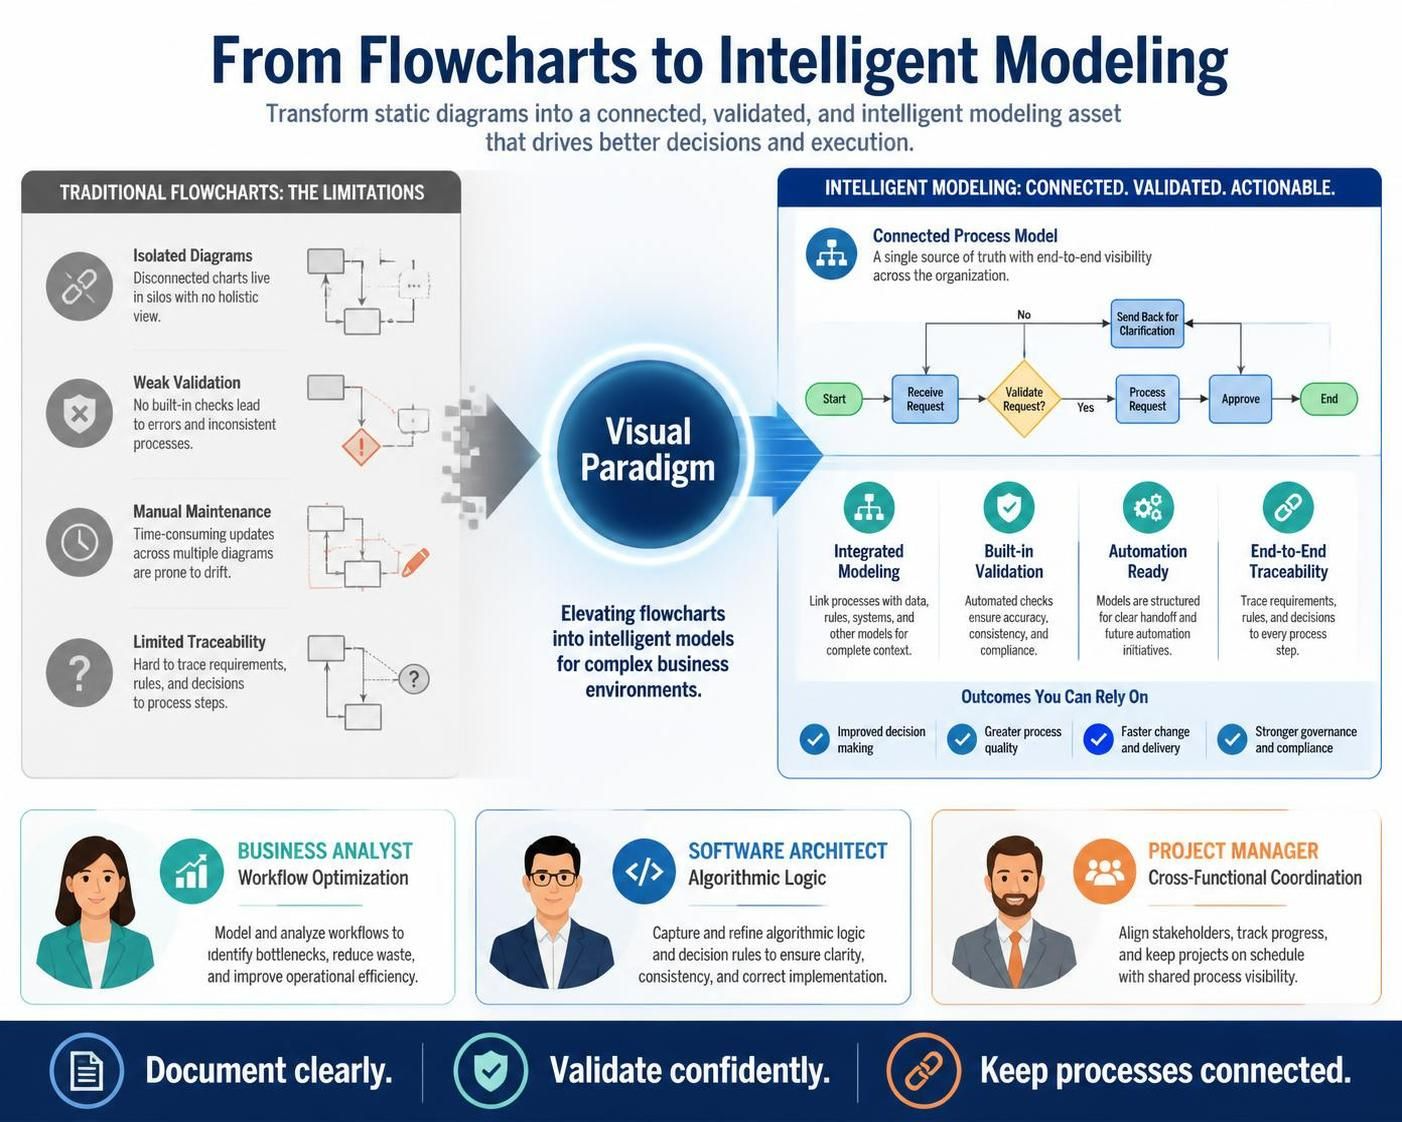
This comprehensive guide explores how Visual Paradigm elevates professional flowcharting through industry-standard compliance, AI-powered generation, deep model integration, and advanced validation features. You’ll learn key concepts, best practices, and practical examples to create robust, traceable, and actionable process models that drive real business value.
What Makes Visual Paradigm Different?

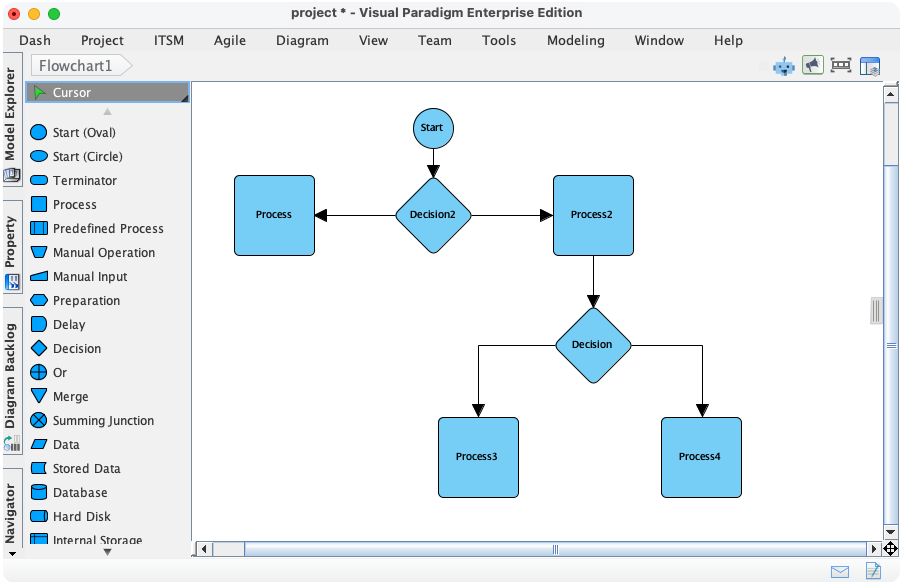
Visual Paradigm is not just another diagramming tool—it’s a comprehensive modeling platform that brings professional-grade capabilities to flowchart creation. By integrating flowcharts into a broader ecosystem of UML, BPMN, requirements management, and process analysis tools, Visual Paradigm ensures your diagrams are not isolated artifacts but living components of your organization’s knowledge base.
Core Advantages
-
Enterprise-Ready Integration: Connect flowcharts to UML diagrams, BPMN models, and requirement specifications for complete traceability
-
AI-Powered Automation: Generate professional flowcharts instantly from natural language descriptions
-
Built-in Validation: Automatically detect logical errors, dead ends, and inconsistencies in your process flows
-
Collaborative Modeling: Share, review, and iterate on process models with stakeholders across departments
Key Concepts in Professional Flowcharting
1. Industry-Standard Symbols (ANSI/ISO Compliance)
Professional flowcharts rely on standardized symbols to ensure clarity and universal understanding. Visual Paradigm provides a complete ANSI/ISO symbol set, including:
-
Terminator (Oval): Indicates the start or end of a process
-
Process (Rectangle): Represents an action or operation step
-
Decision (Diamond): Shows a branching point with yes/no or true/false outcomes
-
Input/Output (Parallelogram): Denotes data entering or leaving the process
-
Connector (Circle): Links different parts of a flowchart, especially useful for complex diagrams
-
Document (Rectangle with wavy bottom): Represents documentation or reports generated by the process
Why It Matters: Using standard symbols ensures that anyone familiar with flowchart conventions can immediately understand your diagram, reducing miscommunication and training overhead.
2. Swimlanes for Role Clarity
Swimlanes organize process steps by responsible party—whether that’s a department, role, or system. Visual Paradigm supports both horizontal and vertical swimlanes, making it easy to visualize:
-
Who is responsible for each step
-
Handoffs between teams or systems
-
Bottlenecks where responsibilities overlap or gaps exist
Example: In a customer onboarding process, you might have swimlanes for Sales, Customer Success, IT Support, and Finance, clearly showing which team handles account setup, which provisions access, and which processes billing.
3. Cross-Diagram Linking and Traceability
One of Visual Paradigm’s standout features is the ability to link flowchart elements to other models in your repository:
-
Link a decision point to a Use Case Diagram showing user interactions
-
Connect a process step to a BPMN model for detailed workflow execution
-
Reference specific requirements that the process fulfills
-
Tie algorithmic steps to UML Activity Diagrams or Sequence Diagrams
This creates a web of traceability that supports impact analysis, compliance auditing, and change management.
4. Process Validation and Optimization
Visual Paradigm doesn’t just let you draw flowcharts—it helps you ensure they’re logically sound. The built-in validation engine can detect:
-
Unreachable steps (dead code in process terms)
-
Missing end points or infinite loops
-
Inconsistent decision branches
-
Orphaned connectors
After validation, you can generate detailed reports highlighting issues and suggesting optimizations, turning your flowchart from a static document into an analytical tool.
AI-Powered Flowchart Generation: Workflow Meets Intelligence
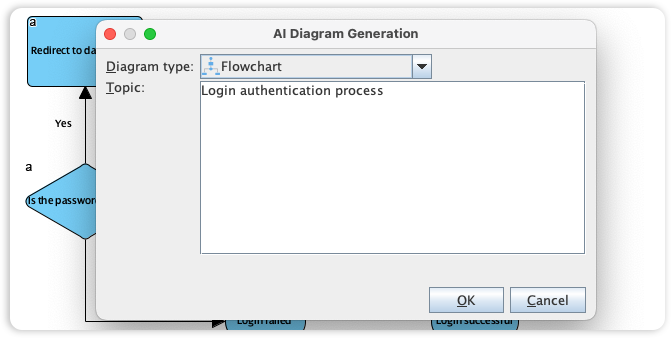
Perhaps the most transformative feature in Visual Paradigm’s flowchart toolkit is the AI Diagram Generator. This capability allows you to bypass the manual drawing phase entirely by describing your process in natural language.
How It Works
-
Describe Your Process: Input a textual description of your workflow, including steps, decision points, and outcomes
-
AI Structures the Logic: The AI analyzes your description and automatically arranges the sequence into a logically sound flowchart
-
Review and Refine: The generated diagram serves as a starting point that you can customize, add details to, or integrate with other models
Practical Example
Input Description:
“When a customer submits a support ticket, the system first checks if it’s a billing issue. If yes, route to Finance team. If no, check if it’s a technical issue. If technical, assign to IT Support. Otherwise, assign to General Customer Service. Each team resolves the ticket and sends confirmation to the customer, then closes the ticket.”
AI Output: Visual Paradigm generates a complete flowchart with:
-
Start terminator
-
Decision diamond for “Billing Issue?”
-
Branch to Finance swimlane if yes
-
Second decision diamond for “Technical Issue?”
-
Branches to IT Support or General Customer Service swimlanes
-
Process boxes for resolution and confirmation
-
End terminator
This reduces what might take 30+ minutes of manual diagramming to under 2 minutes, allowing you to focus on process optimization rather than shape placement.
Use Cases Across Roles
For Business Analysts
Challenge: Documenting complex business processes while ensuring compliance with regulatory requirements and organizational standards.
Visual Paradigm Solution:
-
Use ANSI/ISO symbols for standardized documentation
-
Leverage swimlanes to clarify departmental responsibilities
-
Validate processes to catch logical errors before implementation
-
Link process steps to regulatory requirements for audit trails
-
Generate reports for stakeholder reviews and compliance documentation
Example: A BA maps out the loan approval process, linking each decision point to specific regulatory requirements. The validation tool flags a missing compliance check, preventing a potential regulatory violation.
For Software Architects
Challenge: Defining algorithmic logic and system workflows that integrate seamlessly with broader architectural models.
Visual Paradigm Solution:
-
Create flowcharts that link directly to UML Activity Diagrams and Sequence Diagrams
-
Map decision logic to use cases and system requirements
-
Ensure algorithmic flows align with component interactions defined in component diagrams
-
Use cross-diagram linking to maintain consistency across architectural views
Example: An architect designs the authentication flow for a new microservice, linking each step to corresponding sequence diagrams and component specifications. When requirements change, the linked models update automatically, maintaining consistency.
For Project Managers
Challenge: Visualizing team workflows, identifying bottlenecks, and optimizing resource allocation across cross-functional projects.
Visual Paradigm Solution:
-
Use swimlanes to map responsibilities across team members or departments
-
Identify handoff points where delays commonly occur
-
Validate workflows to ensure all paths lead to completion
-
Share interactive diagrams with stakeholders for feedback and alignment
Example: A PM maps out the product release process with swimlanes for Development, QA, Marketing, and Operations. The diagram reveals that QA and Marketing have overlapping responsibilities during the final testing phase, prompting a clarification of roles that prevents future confusion.
Tips & Best Practices
1. Maintain Symbol Consistency
Always use standard ANSI/ISO symbols throughout your flowcharts. Mixing custom shapes with standard symbols creates confusion and reduces the diagram’s professionalism. Visual Paradigm’s symbol library ensures you always have access to the correct shapes.
2. Leverage Swimlanes Strategically
Don’t just add swimlanes for the sake of it—use them when they add clarity. Good candidates for swimlane organization include:
-
Processes involving multiple departments
-
Workflows with clear handoffs between roles
-
Systems with distinct subsystems or services
Keep swimlane labels concise and meaningful (e.g., “Finance” rather than “The Department That Handles Money”).
3. Validate Early and Often
Run Visual Paradigm’s validation tool regularly during diagram creation, not just at the end. Catching logical errors early saves time and prevents the propagation of flawed assumptions into implementation.
4. Keep Diagrams Focused
A single flowchart should represent one coherent process or sub-process. If your diagram becomes too complex:
-
Break it into sub-processes linked via connectors
-
Use separate diagrams for different levels of detail (high-level overview vs. detailed steps)
-
Leverage cross-diagram linking to maintain relationships between related processes
5. Document Decision Criteria
When using decision diamonds, clearly label the branches with specific criteria (e.g., “Amount > $10,000” rather than just “Yes/No”). This makes the logic explicit and easier to validate or modify later.
6. Integrate with Your Modeling Ecosystem
Take advantage of Visual Paradigm’s cross-diagram linking to connect your flowcharts to:
-
Requirements that the process fulfills
-
Use cases that trigger the process
-
BPMN models for execution details
-
UML diagrams for technical implementation
This creates a living model that evolves with your project rather than becoming an outdated artifact.
Practical Examples
Example 1: Employee Onboarding Process
Scenario: HR needs to document the new employee onboarding workflow involving multiple departments.
Flowchart Structure:
-
Swimlanes: HR, IT, Facilities, Manager
-
Key Steps:
-
HR receives signed offer letter (Start)
-
HR creates employee record in HRIS
-
HR notifies IT and Facilities
-
IT provisions laptop and accounts (parallel with Facilities setting up workspace)
-
Manager schedules orientation meetings
-
Employee completes day-one paperwork
-
HR confirms completion (End)
-
Visual Paradigm Features Used:
-
Swimlanes for role clarity
-
Parallel process indicators for concurrent IT/Facilities tasks
-
Links to HRIS system requirements and IT provisioning procedures
-
Validation to ensure all paths reach completion
Example 2: Bug Triage Algorithm
Scenario: A software team needs to define the logic for prioritizing and assigning bug reports.
Flowchart Structure:
-
Start: Bug report submitted
-
Decision 1: Is it a security vulnerability? → Yes: Escalate to Security Team immediately
-
Decision 2: Does it affect production? → Yes: Assign high priority
-
Decision 3: Is it reproducible? → No: Request more information from reporter
-
Assignment: Based on component, assign to appropriate development team
-
End: Bug logged in tracking system with priority and assignee
Visual Paradigm Features Used:
-
AI generation from textual description of triage rules
-
Decision diamonds with clear criteria labels
-
Links to component ownership matrix in requirements repository
-
Validation to ensure no bugs fall through without assignment
Example 3: Purchase Approval Workflow
Scenario: Finance needs to document the approval process for purchase requests based on amount and category.
Flowchart Structure:
-
Swimlanes: Requester, Manager, Finance, Executive
-
Decision Points:
-
Amount < $1,000: Manager approval only
-
$1,000 – $10,000: Manager + Finance approval
-
$10,000: Manager + Finance + Executive approval
-
Capital expenditure: Additional review regardless of amount
-
-
End: PO issued or request denied with reason
Visual Paradigm Features Used:
-
Swimlanes showing approval hierarchy
-
Multiple decision diamonds with clear monetary thresholds
-
Links to financial policy documents and approval authority matrix
-
Report generation for audit compliance
Advanced Features for Enterprise Users
Process Simulation and Analysis
Beyond static diagrams, Visual Paradigm enables you to simulate process execution to identify:
-
Bottlenecks where work accumulates
-
Resource utilization across roles
-
Cycle times for different process paths
-
Impact of proposed changes before implementation
Version Control and Change Tracking
Track changes to your flowcharts over time with built-in version control:
-
Compare versions to see what changed
-
Revert to previous versions if needed
-
Maintain audit trails for compliance purposes
Collaboration and Review
Share flowcharts with stakeholders for feedback:
-
Add comments and annotations directly on diagrams
-
Track review status and approvals
-
Export to various formats (PDF, PNG, SVG) for distribution
Conclusion
Flowcharts remain one of the most powerful tools for documenting, analyzing, and communicating processes. However, their value multiplies when created within a professional modeling platform like Visual Paradigm that provides industry-standard compliance, AI-powered automation, deep integration capabilities, and built-in validation.
By leveraging Visual Paradigm’s comprehensive flowchart toolkit, you transform simple diagrams into intelligent, traceable, and actionable process models that drive real business value. Whether you’re a business analyst ensuring regulatory compliance, a software architect defining system logic, or a project manager optimizing team workflows, Visual Paradigm provides the tools you need to create professional-grade flowcharts efficiently and effectively.
The integration of AI-powered generation means you can focus on what matters most—optimizing processes and solving business problems—rather than spending hours manually arranging shapes. Combined with cross-diagram linking, validation, and reporting capabilities, Visual Paradigm ensures your flowcharts are not just documentation artifacts but living components of your organization’s operational intelligence.
Start applying these concepts and best practices to your next process modeling project, and experience the difference that professional-grade flowcharting can make in clarity, efficiency, and stakeholder alignment.
Ready to elevate your process modeling? Explore Visual Paradigm’s flowchart capabilities and discover how AI-powered generation, industry-standard compliance, and enterprise integration can transform the way you document and optimize your business processes.
Related Links
Flowcharts are essential for mapping business workflows and technical processes, utilizing drag-and-drop interfaces and standardized symbols to improve organizational communication and logic visualization,,.
- Powerful Online Flowchart Tool with Drag-and-Drop Interface: This web-based tool enables the intuitive creation, editing, and sharing of flowcharts through a simple drag-and-drop editor.
- Step-by-Step Flowchart Tutorial for Beginners and Experts: A detailed guide covering standard symbols, best practices, and real-world applications for effective flowcharting.
- Free Online Flowchart Maker with Advanced Features: This resource allows users to create professional flowcharts for free with access to templates, collaborative tools, and multi-format export options.
- Free Flowchart Templates for Instant Diagram Creation: Users can access a wide range of professionally designed templates across various industries to accelerate their design workflow.
- Feature-Rich Flowchart Maker for Business and Technical Teams: This platform supports team collaboration, version control, and integration with other essential business tools.
- Free Flowchart Maker with No Installation Required: An ideal web-based solution for students, educators, and professionals to design diagrams without downloading software.
- Interactive Flowchart Tutorial for Visual Learning: This resource helps users learn flowchart design through hands-on training, visual examples, and step-by-step guidance.
- Community-Shared Flowchart Template for Project Planning: This link provides access to user-contributed content for project planning, featuring standard symbols and customizable sections.
- How to Create a Flowchart in 10 Minutes – Beginner’s Guide: A practical video tutorial that demonstrates how to quickly generate professional flowcharts using online tools.
- Comprehensive Tutorial: Creating Flowcharts with Visual Paradigm Online: This guide provides a step-by-step walkthrough for mastering the intuitive interface and tools required to build effective visual models.

 English
 Arabic
 Chinese (Simplified)
 Dutch
Dutch French
 German
 Italian
 Japanese
 Korean
 Portuguese
 Russian
 Spanish