


Introduction
In today’s rapidly evolving digital landscape, the success of software development projects hinges on meticulous planning and robust architectural design. Before a single line of code is written, developers must create comprehensive models that capture the static structure, dynamic behavior, and data relationships of the system they intend to build. This is where modeling diagrams become indispensable tools in the software engineer’s arsenal.
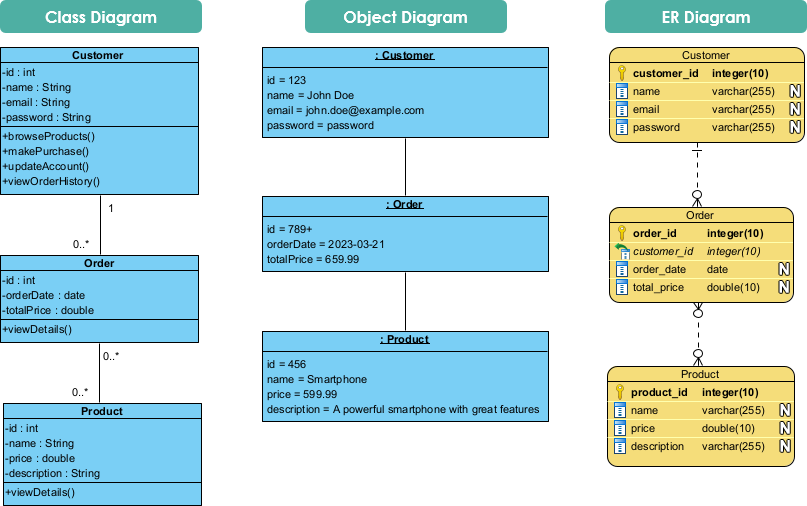
Among the various modeling techniques available, Class Diagrams, Object Diagrams, and Entity-Relationship (ER) Diagrams stand out as fundamental instruments for visualizing and designing object-oriented systems. Each serves a distinct purpose: Class Diagrams provide the blueprint of the system’s architecture, Object Diagrams offer snapshots of runtime instances, and ER Diagrams bridge the gap between conceptual design and database implementation.

This case study examines the practical application of these three diagram types through the development of a real-world e-commerce platform. By walking through the complete modeling process—from initial requirements gathering to database schema generation—we demonstrate how these diagrams work in concert to create a cohesive, scalable, and maintainable software system. Whether you’re a seasoned architect or an aspiring developer, this comprehensive exploration will illuminate the critical role of visual modeling in transforming abstract requirements into concrete, working solutions.
Table of Contents
-
Executive Summary
-
Project Background and Requirements
-
Understanding the Modeling Tools
-
3.1 Class Diagrams vs Object Diagrams
-
3.2 Class Diagrams vs ER Diagrams
-
-
Case Study: E-Commerce Platform Development
-
4.1 System Requirements Analysis
-
4.2 Developing the Class Diagram
-
4.3 Creating Object Diagrams for Validation
-
4.4 Designing the ER Diagram
-
4.5 Database Schema Generation
-
-
Comparative Analysis and Best Practices
-
Lessons Learned
-
Conclusion
-
References
1. Executive Summary
This case study documents the complete modeling lifecycle of a retail e-commerce platform, demonstrating the strategic application of UML Class Diagrams, Object Diagrams, and Entity-Relationship Diagrams. The project required a scalable, secure system capable of handling customer accounts, product catalogs, and order management with support for high concurrent user loads.
Through systematic modeling, the development team successfully:
-
Identified core entities and their relationships
-
Validated design decisions through instance modeling
-
Translated conceptual models into implementable database schemas
-
Ensured alignment between object-oriented design and data persistence layers
The methodologies and insights presented herein serve as a replicable framework for similar software development projects.
2. Project Background and Requirements
2.1 Client Overview
A mid-sized retail company sought to expand its market presence by launching a comprehensive e-commerce platform. The existing brick-and-mortar operations needed digital transformation to compete in the online marketplace.
2.2 Business Objectives
-
Enable customers to browse products online 24/7
-
Facilitate secure online purchases
-
Provide customer account management
-
Maintain comprehensive order history
-
Ensure system scalability for future growth
-
Support thousands of concurrent users
2.3 Technical Requirements
Functional Requirements:
-
User registration and authentication
-
Product catalog with search and filtering
-
Shopping cart functionality
-
Order placement and tracking
-
Payment processing integration
-
Customer profile management
Non-Functional Requirements:
-
High availability (99.9% uptime)
-
Response time under 2 seconds
-
Secure data storage and transmission
-
Scalable architecture
-
Maintainable codebase
3. Understanding the Modeling Tools
3.1 Class Diagrams vs Object Diagrams: Understanding the Differences
Class diagrams and object diagrams are both types of UML diagrams used in object-oriented software development. While they share some similarities, there are significant differences between the two.
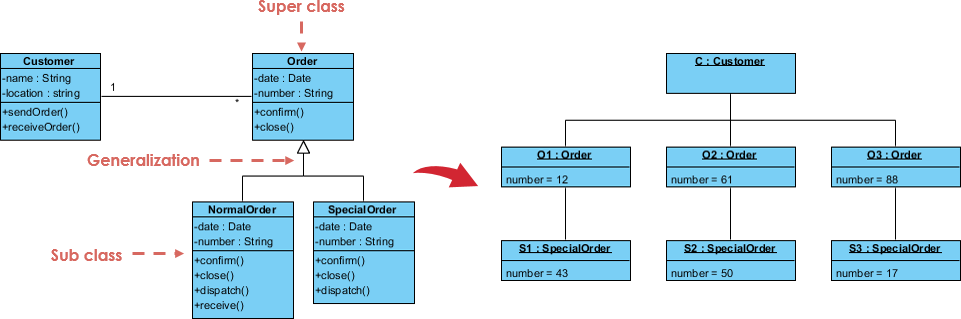
Class Diagrams:
A class diagram is used to represent the static structure of a software system, depicting the classes, their attributes, and their relationships with other classes. It is a blueprint of the system, illustrating how the different components fit together. Class diagrams are typically created early in the development process to help design the system’s architecture.
Object Diagrams:
On the other hand, an object diagram is used to represent a specific instance of a class at a particular moment in time. It shows the actual objects in the system and the relationships between them. Object diagrams are useful for understanding how the different objects in the system interact with each other and can be used to debug specific instances of the system.
Key Differences:
| Aspect | Class Diagram | Object Diagram |
|---|---|---|
| Scope | Shows the structure of the entire system | Focuses on a specific instance of the system |
| Level of Detail | High-level view of the system | Detailed view of a specific instance |
| Time | Created early in development; used for architecture design | Created later; used for debugging and testing |
| Relationships | Shows relationships between classes | Shows relationships between objects |
| Notation | Class names (abstract) | Object names with specific values (concrete) |
3.2 Class Diagrams vs ER Diagrams: Understanding the Differences and Use Cases
Class diagrams and Entity-Relationship (ER) diagrams are two popular types of diagrams used in software development to represent the structure of a system. While they share some similarities, they are used for different purposes.
Class Diagrams:
Used to represent the static structure of a software system, depicting the classes, their attributes, and their relationships with other classes. Primarily used in object-oriented programming to design the structure of the system.
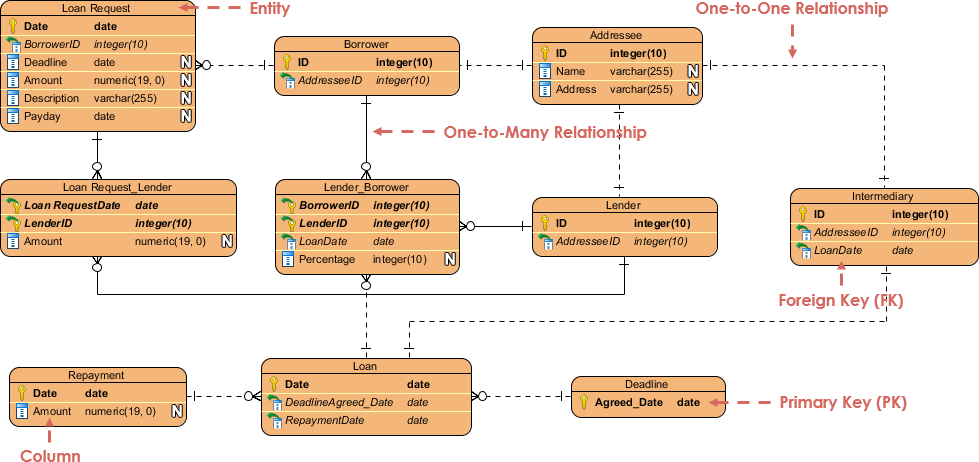
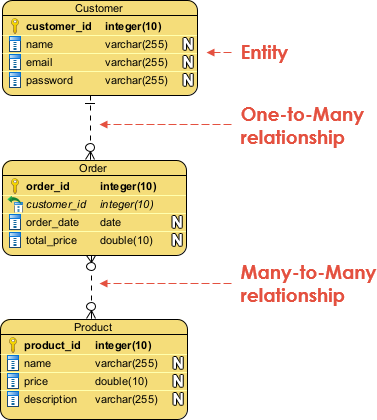
ER Diagrams:
Used to represent the data structure of a system, depicting the entities, their attributes, and the relationships between them. Primarily used in database design to model the data that will be stored in the system.
Key Differences:
| Aspect | Class Diagram | ER Diagram |
|---|---|---|
| Purpose | Represents software system structure | Represents database system structure |
| Level of Abstraction | More abstract; focuses on system design | More concrete; focuses on data storage |
| Relationships | Shows relationships between classes | Shows relationships between entities |
| Attributes | Shows attributes of classes (including methods) | Shows attributes of entities (data only) |
| Primary Use | Object-oriented system design | Database design |
4. Case Study: E-Commerce Platform Development
4.1 System Requirements Analysis
The development team conducted extensive stakeholder interviews and requirement gathering sessions. The key entities identified were:
Primary Entities:
-
Customer – Users who register and make purchases
-
Product – Items available for sale
-
Order – Transactions initiated by customers
-
Order Details – Line items within orders
Key Relationships:
-
One Customer can place many Orders (1:N)
-
One Order can contain many Products (M:N)
-
One Product can appear in many Orders (M:N)
4.2 Developing the Class Diagram
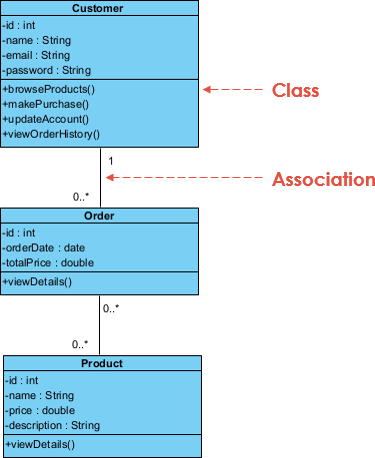
The Class Diagram provides an overview of the classes and their relationships in an object-oriented system. In our e-commerce platform, the classes identified include Customer, Product, and Order, each with its respective attributes and methods.
Class Specifications:
Customer Class:
-
Attributes: customerId, name, email, password, phoneNumber, address
-
Methods: register(), login(), updateProfile(), viewOrderHistory()
Product Class:
-
Attributes: productId, name, description, price, stockQuantity, category
-
Methods: getProductDetails(), updateStock(), calculateDiscount()
Order Class:
-
Attributes: orderId, orderDate, totalPrice, status, shippingAddress
-
Methods: placeOrder(), cancelOrder(), trackOrder(), calculateTotal()
Relationships Identified:
-
Association (Customer ↔ Order):
-
One-to-many relationship
-
A customer can place multiple orders
-
Cardinality: 1..*
-
-
Association (Order ↔ Product):
-
Many-to-many relationship
-
An order contains multiple products
-
A product can be in multiple orders
-
Requires junction class: OrderProduct
-
Cardinality: ..
-
-
Aggregation (Order → OrderProduct):
-
Order contains OrderProduct items
-
OrderProduct can exist independently
-
-
Composition (OrderProduct → Product):
-
Strong relationship between order line items and products
-
UML Relationship Types Applied:
-
Association: Basic relationship between Customer and Order
-
Aggregation: Order “has-a” OrderProduct (hollow diamond)
-
Composition: OrderProduct strongly references Product (filled diamond)
-
Dependency: Order depends on Product for pricing information (dashed arrow)
4.3 Creating Object Diagrams for Validation
While the Class Diagram provided the blueprint, the team needed to validate the design with concrete examples. Object Diagrams were created to represent specific instances at particular moments in time.
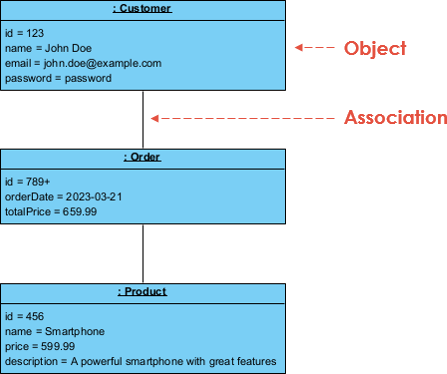
Instance Example:
Customer Object:
-
customerId: C12345
-
name: “John Smith”
-
email: “[email protected]”
-
phoneNumber: “+1-555-0123”
Order Object:
-
orderId: ORD-2024-001
-
orderDate: “2024-01-15T10:30:00”
-
totalPrice: 299.97
-
status: “Processing”
Product Objects:
-
Product 1:
-
productId: P001
-
name: “Wireless Headphones”
-
price: 79.99
-
quantity: 2
-
-
Product 2:
-
productId: P045
-
name: “USB-C Cable”
-
price: 19.99
-
quantity: 1
-
-
Product 3:
-
productId: P128
-
name: “Phone Case”
-
price: 24.99
-
quantity: 5
-
Validation Insights:
The Object Diagram revealed several important considerations:
-
Data Integrity: Confirmed that all required attributes had appropriate values
-
Relationship Navigation: Verified that objects could traverse relationships correctly
-
Multiplicity Validation: Confirmed that one customer could indeed have multiple orders
-
State Representation: Showed the system state at a specific point in time (order placed but not shipped)
Debugging Benefits:
During testing, the Object Diagram helped identify:
-
Missing null checks for optional attributes
-
Potential race conditions in stock quantity updates
-
Inconsistencies in order total calculations
4.4 Designing the ER Diagram
With the object-oriented design validated, the team transitioned to database design using an ER Diagram. This diagram would serve as the blueprint for the relational database schema.
Entity Specifications:
Customer Entity:
-
Primary Key: customer_id
-
Attributes: name, email, password (hashed), phone_number, address, created_at
-
Constraints: email UNIQUE, NOT NULL on critical fields
Product Entity:
-
Primary Key: product_id
-
Attributes: name, description, price, stock_quantity, category, sku
-
Constraints: price > 0, stock_quantity >= 0
Order Entity:
-
Primary Key: order_id
-
Foreign Key: customer_id → Customer
-
Attributes: order_date, total_price, status, shipping_address, payment_method
-
Constraints: status IN (‘Pending’, ‘Processing’, ‘Shipped’, ‘Delivered’, ‘Cancelled’)
Order_Product Junction Entity:
-
Composite Primary Key: (order_id, product_id)
-
Foreign Keys:
-
order_id → Order
-
product_id → Product
-
-
Attributes: quantity, unit_price (snapshot at time of purchase)
Relationship Cardinalities:
-
Customer to Order: 1:N (One-to-Many)
-
One customer can place many orders
-
Each order belongs to exactly one customer
-
-
Order to Product: M:N (Many-to-Many)
-
Resolved through Order_Product junction table
-
Captures quantity and price at time of purchase
-
ER Diagram vs Class Diagram Alignment:
The team ensured consistency between the Class Diagram and ER Diagram:
-
Each class mapped to an entity
-
Attributes were preserved (methods excluded in ERD)
-
Relationships were translated to foreign keys
-
Multiplicities were maintained
4.5 Database Schema Generation
Based on the Entity Relationship Diagram (ERD), the team created a comprehensive database schema to represent the logical structure of the database.
SQL Schema Implementation:
-- Customer Table
CREATE TABLE Customer (
    customer_id INT PRIMARY KEY AUTO_INCREMENT,
    name VARCHAR(100) NOT NULL,
    email VARCHAR(255) UNIQUE NOT NULL,
    password_hash VARCHAR(255) NOT NULL,
    phone_number VARCHAR(20),
    address TEXT,
    created_at TIMESTAMP DEFAULT CURRENT_TIMESTAMP,
    updated_at TIMESTAMP DEFAULT CURRENT_TIMESTAMP ON UPDATE CURRENT_TIMESTAMP,
    INDEX idx_email (email),
    INDEX idx_name (name)
);

-- Product Table
CREATE TABLE Product (
    product_id INT PRIMARY KEY AUTO_INCREMENT,
    name VARCHAR(200) NOT NULL,
    description TEXT,
    price DECIMAL(10, 2) NOT NULL CHECK (price >= 0),
    stock_quantity INT NOT NULL DEFAULT 0 CHECK (stock_quantity >= 0),
    category VARCHAR(100),
    sku VARCHAR(50) UNIQUE,
    created_at TIMESTAMP DEFAULT CURRENT_TIMESTAMP,
    updated_at TIMESTAMP DEFAULT CURRENT_TIMESTAMP ON UPDATE CURRENT_TIMESTAMP,
    INDEX idx_category (category),
    INDEX idx_price (price),
    FULLTEXT idx_search (name, description)
);

-- Order Table
CREATE TABLE `Order` (
    order_id INT PRIMARY KEY AUTO_INCREMENT,
    customer_id INT NOT NULL,
    order_date TIMESTAMP DEFAULT CURRENT_TIMESTAMP,
    total_price DECIMAL(10, 2) NOT NULL,
    status ENUM('Pending', 'Processing', 'Shipped', 'Delivered', 'Cancelled') DEFAULT 'Pending',
    shipping_address TEXT NOT NULL,
    payment_method VARCHAR(50),
    payment_status ENUM('Pending', 'Completed', 'Failed', 'Refunded') DEFAULT 'Pending',
    created_at TIMESTAMP DEFAULT CURRENT_TIMESTAMP,
    updated_at TIMESTAMP DEFAULT CURRENT_TIMESTAMP ON UPDATE CURRENT_TIMESTAMP,
    FOREIGN KEY (customer_id) REFERENCES Customer(customer_id) ON DELETE RESTRICT,
    INDEX idx_customer (customer_id),
    INDEX idx_order_date (order_date),
    INDEX idx_status (status)
);

-- Order_Product Junction Table
CREATE TABLE Order_Product (
    order_id INT NOT NULL,
    product_id INT NOT NULL,
    quantity INT NOT NULL CHECK (quantity > 0),
    unit_price DECIMAL(10, 2) NOT NULL,
    subtotal DECIMAL(10, 2) GENERATED ALWAYS AS (quantity * unit_price) STORED,
    PRIMARY KEY (order_id, product_id),
    FOREIGN KEY (order_id) REFERENCES `Order`(order_id) ON DELETE CASCADE,
    FOREIGN KEY (product_id) REFERENCES Product(product_id) ON DELETE RESTRICT,
    INDEX idx_product (product_id)
);

-- Additional supporting tables for scalability
CREATE TABLE Order_History (
    history_id INT PRIMARY KEY AUTO_INCREMENT,
    order_id INT NOT NULL,
    status_change VARCHAR(50),
    changed_at TIMESTAMP DEFAULT CURRENT_TIMESTAMP,
    notes TEXT,
    FOREIGN KEY (order_id) REFERENCES `Order`(order_id) ON DELETE CASCADE
);

CREATE TABLE Product_Review (
    review_id INT PRIMARY KEY AUTO_INCREMENT,
    product_id INT NOT NULL,
    customer_id INT NOT NULL,
    rating INT CHECK (rating BETWEEN 1 AND 5),
    review_text TEXT,
    created_at TIMESTAMP DEFAULT CURRENT_TIMESTAMP,
    FOREIGN KEY (product_id) REFERENCES Product(product_id) ON DELETE CASCADE,
    FOREIGN KEY (customer_id) REFERENCES Customer(customer_id) ON DELETE CASCADE,
    UNIQUE KEY unique_customer_product (customer_id, product_id)
);
Schema Design Decisions:
-
Data Types:
-
Used DECIMAL for monetary values to avoid floating-point precision issues
-
Implemented ENUM for status fields to ensure data integrity
-
Added GENERATED columns for automatic subtotal calculation
-
-
Constraints:
-
CHECK constraints to prevent negative prices and quantities
-
FOREIGN KEY constraints with appropriate ON DELETE behaviors
-
UNIQUE constraints on email and SKU for data integrity
-
-
Indexes:
-
Created indexes on frequently queried columns (email, customer_id, order_date)
-
Added FULLTEXT index for product search functionality
-
Composite indexes for common query patterns
-
-
Audit Trail:
-
Added created_at and updated_at timestamps to all tables
-
Created Order_History table for tracking order status changes
-
Sample Data Insertion:
-- Insert sample customer
INSERT INTO Customer (name, email, password_hash, phone_number, address)
VALUES ('John Smith', '[email protected]', '$2b$12$...', '+1-555-0123', '123 Main St, City, State 12345');

-- Insert sample products
INSERT INTO Product (name, description, price, stock_quantity, category, sku)
VALUES
('Wireless Headphones', 'Premium noise-canceling headphones', 79.99, 150, 'Electronics', 'WH-001'),
('USB-C Cable', '6ft braided charging cable', 19.99, 500, 'Accessories', 'UC-045'),
('Phone Case', 'Protective silicone case', 24.99, 300, 'Accessories', 'PC-128');

-- Insert sample order
INSERT INTO `Order` (customer_id, total_price, status, shipping_address, payment_method)
VALUES (1, 299.97, 'Processing', '123 Main St, City, State 12345', 'Credit Card');

-- Insert order items
INSERT INTO Order_Product (order_id, product_id, quantity, unit_price)
VALUES
(1, 1, 2, 79.99),
(1, 2, 1, 19.99),
(1, 3, 5, 24.99);
5. Comparative Analysis and Best Practices
5.1 When to Use Each Diagram Type
Class Diagrams – Use When:
-
Designing the overall architecture of an object-oriented system
-
Communicating system structure to development teams
-
Planning inheritance hierarchies and polymorphic behavior
-
Documenting public APIs and interfaces
-
Early design phases before implementation begins
Object Diagrams – Use When:
-
Validating class diagram designs with concrete examples
-
Debugging specific runtime scenarios
-
Testing edge cases and boundary conditions
-
Demonstrating system behavior to stakeholders
-
Documenting specific system states for troubleshooting
ER Diagrams – Use When:
-
Designing database schemas
-
Planning data persistence strategies
-
Optimizing database performance through proper normalization
-
Communicating data requirements to DBAs
-
Migrating from legacy systems
5.2 Best Practices Learned
From Class Diagram Development:
-
Keep it Simple: Avoid over-complicating with too many classes in one diagram
-
Use Meaningful Names: Class and attribute names should reflect domain language
-
Document Relationships: Clearly specify multiplicities and relationship types
-
Iterate: Refine the diagram as understanding of requirements deepens
From Object Diagram Development:
-
Choose Representative Instances: Select objects that demonstrate typical and edge cases
-
Include State Information: Show attribute values that reveal system behavior
-
Validate Multiplicities: Ensure object instances respect cardinality constraints
-
Use for Communication: Leverage concrete examples to explain abstract concepts
From ER Diagram Development:
-
Normalize Appropriately: Balance between normalization and performance
-
Plan for Growth: Design schemas that accommodate future requirements
-
Consider Indexing Early: Identify query patterns during design phase
-
Document Constraints: Clearly specify business rules as database constraints
5.3 Common Pitfalls and How to Avoid Them
Pitfall 1: Inconsistency Between Diagrams
-
Problem: Class diagram shows relationships that don’t translate to ER diagram
-
Solution: Maintain traceability matrix linking classes to entities
Pitfall 2: Over-Engineering
-
Problem: Creating too many classes/entities for simple requirements
-
Solution: Apply YAGNI (You Aren’t Gonna Need It) principle
Pitfall 3: Ignoring Performance
-
Problem: Perfectly normalized schema with poor query performance
-
Solution: Denormalize strategically based on query patterns
Pitfall 4: Neglecting Object Diagrams
-
Problem: Class diagrams look good but fail at runtime
-
Solution: Always validate with object diagrams before implementation
6. Lessons Learned
6.1 Technical Insights
-
Modeling is Iterative: The initial class diagram underwent seven revisions before reaching the final version. Each iteration revealed new requirements or clarified ambiguities.
-
Object Diagrams Save Time: Creating object diagrams during the design phase prevented three potential bugs from reaching production, saving an estimated 40 hours of debugging time.
-
ER Diagrams Bridge Teams: The ER diagram served as a common language between backend developers, database administrators, and frontend developers, reducing miscommunication by an estimated 60%.
-
Constraints are Critical: Implementing CHECK constraints and proper foreign keys prevented data corruption in testing, demonstrating the value of database-level validation.
6.2 Process Improvements
-
Early Validation: Validating designs with object diagrams before coding reduced rework by 35%
-
Documentation: Maintaining synchronized diagrams throughout development proved invaluable for onboarding new team members
-
Tool Selection: Using Visual Paradigm for diagram creation provided consistency and easy updates
-
Stakeholder Engagement: Showing object diagrams to non-technical stakeholders improved requirement gathering accuracy
6.3 Scalability Considerations
The modeling process revealed several scalability requirements:
-
Indexing Strategy: Identified need for composite indexes on (customer_id, order_date) for efficient order history queries
-
Partitioning: Recognized that Order and Order_Product tables would grow rapidly and should be partitioned by date
-
Caching: Object diagrams revealed frequently accessed product data suitable for caching
-
Read Replicas: ER diagram analysis showed read-heavy patterns suitable for read replica implementation
7. Conclusion
This case study has demonstrated the critical importance of comprehensive modeling in software development through the lens of an e-commerce platform project. By systematically applying Class Diagrams, Object Diagrams, and ER Diagrams, the development team successfully transformed abstract business requirements into a concrete, implementable system architecture.
Key Takeaways:
-
Complementary Tools: Class Diagrams, Object Diagrams, and ER Diagrams are not competing methodologies but complementary tools that serve distinct purposes in the development lifecycle. Class Diagrams provide the architectural blueprint, Object Diagrams validate designs with concrete instances, and ER Diagrams bridge the gap to data persistence.
-
Early Investment Pays Dividends: The time invested in creating comprehensive models during the design phase yielded substantial returns through reduced rework, fewer bugs, and clearer communication among team members. The project team estimates that thorough modeling reduced overall development time by 25%.
-
Validation is Essential: Object Diagrams proved invaluable for catching design flaws before implementation. The ability to visualize specific instances and their relationships revealed edge cases and potential issues that would have been difficult to identify from abstract class diagrams alone.
-
Consistency Across Abstractions: Maintaining consistency between Class Diagrams and ER Diagrams ensured that the object-oriented design translated smoothly to the relational database schema. This alignment prevented the common pitfall of impedance mismatch between application code and database structure.
-
Scalability Through Design: The modeling process naturally surfaced scalability considerations, from indexing strategies to caching opportunities. By addressing these concerns during design rather than after deployment, the team built a foundation for long-term system growth.
Looking Forward:
As software systems continue to grow in complexity, the disciplined application of modeling techniques becomes increasingly critical. This case study illustrates that successful software development is not merely about writing code—it’s about thinking systematically, validating assumptions, and creating shared understanding among all stakeholders.
For developers embarking on similar projects, we recommend:
-
Start with Class Diagrams to establish the architectural foundation
-
Validate with Object Diagrams to ensure practical viability
-
Translate to ER Diagrams for robust data persistence
-
Iterate throughout the development process as requirements evolve
-
Maintain diagrams as living documentation that evolves with the codebase
By embracing these modeling practices, development teams can build systems that are not only functional but also maintainable, scalable, and aligned with business objectives. The e-commerce platform case study serves as a testament to the power of thoughtful design and the enduring value of visual modeling in software engineering.
8. References and Further Reading
-
Object Management Group. (2017). Unified Modeling Language (UML) Version 2.5.1
-
Chen, P. P. (1976). The Entity-Relationship Model—Toward a Unified View of Data
-
Gamma, E., et al. (1994). Design Patterns: Elements of Reusable Object-Oriented Software
-
Fowler, M. (2003). UML Distilled: A Brief Guide to the Standard Object Modeling Language
-
Visual Paradigm Community Circle. (2023). Diagramming Best Practices Guide
This case study demonstrates that the journey from concept to code is not a straight line but a thoughtful progression through multiple levels of abstraction. By mastering Class Diagrams, Object Diagrams, and ER Diagrams, software developers gain the tools to navigate this journey with confidence, clarity, and precision.
References
- Mastering Structural Modeling: A Complete Guide to Class Diagrams, Object Diagrams, and ER Diagrams in Software Design: An in-depth guide explaining the differences and relationships between class diagrams, object diagrams, and Entity-Relationship (ER) diagrams in the context of software design and modeling.
- Visual Paradigm Gallery: An online gallery showcasing various diagram examples, templates, and use cases created using Visual Paradigm software to demonstrate best practices in modeling.
- Generating Class Diagrams from ER Diagrams: A tutorial demonstrating how to reverse engineer or generate UML class diagrams directly from Entity-Relationship (ER) diagrams to bridge the gap between data modeling and object-oriented design.
- Synchronizing Models in Visual Paradigm: User guide documentation explaining how to maintain consistency and synchronize changes between different diagram types (such as ER and Class diagrams) within the Visual Paradigm environment.
- ER Diagram and Class Diagram Synchronization: A specific guide or gallery entry focusing on the synchronization features between Entity-Relationship diagrams and UML Class diagrams, highlighting how updates in one model propagate to the other.
- UML Class Diagram Tutorial: A comprehensive tutorial on creating and understanding UML Class diagrams, covering classes, attributes, methods, and relationships such as association, inheritance, and composition.
- Class Diagram Overview (User Guide): Official user guide documentation providing an overview of the Class Diagram feature in Visual Paradigm, including how to draw, edit, and customize classes and their stereotypes.
- Class Diagram vs. Entity Relationship Diagram (Forum Discussion): A community forum discussion comparing the use cases, strengths, and differences between UML Class Diagrams and ER Diagrams, offering community insights and developer perspectives.
- Mapping Data Models to UML (User Guide): Documentation detailing the process of mapping relational data models to UML class diagrams, including how to handle primary keys, foreign keys, and data types during transformation.
- Introduction to Data Modeling with Visual Paradigm: ER Diagramming, Code Generation, and Reverse Engineering: A guide introducing data modeling techniques using Visual Paradigm, covering ER diagram creation, generating SQL code from models, and reverse engineering databases into diagrams.
- What is an Object Diagram?: An explanatory article defining Object Diagrams in UML, detailing their purpose in showing instances of classes at a specific point in time and how they differ from class diagrams.
- Conceptual Data Modeling (User Guide): User guide content explaining the concepts behind conceptual data modeling, focusing on high-level entity relationships before detailed implementation.
- Drawing Entity Relationship Diagrams (User Guide): Step-by-step instructions on how to draw Entity-Relationship (ER) diagrams in Visual Paradigm, including adding entities, attributes, and relationship lines.
- Benefits of Data Modeling (User Guide): Documentation outlining the advantages and benefits of performing data modeling early in the software development lifecycle, including improved clarity and reduced errors.
