


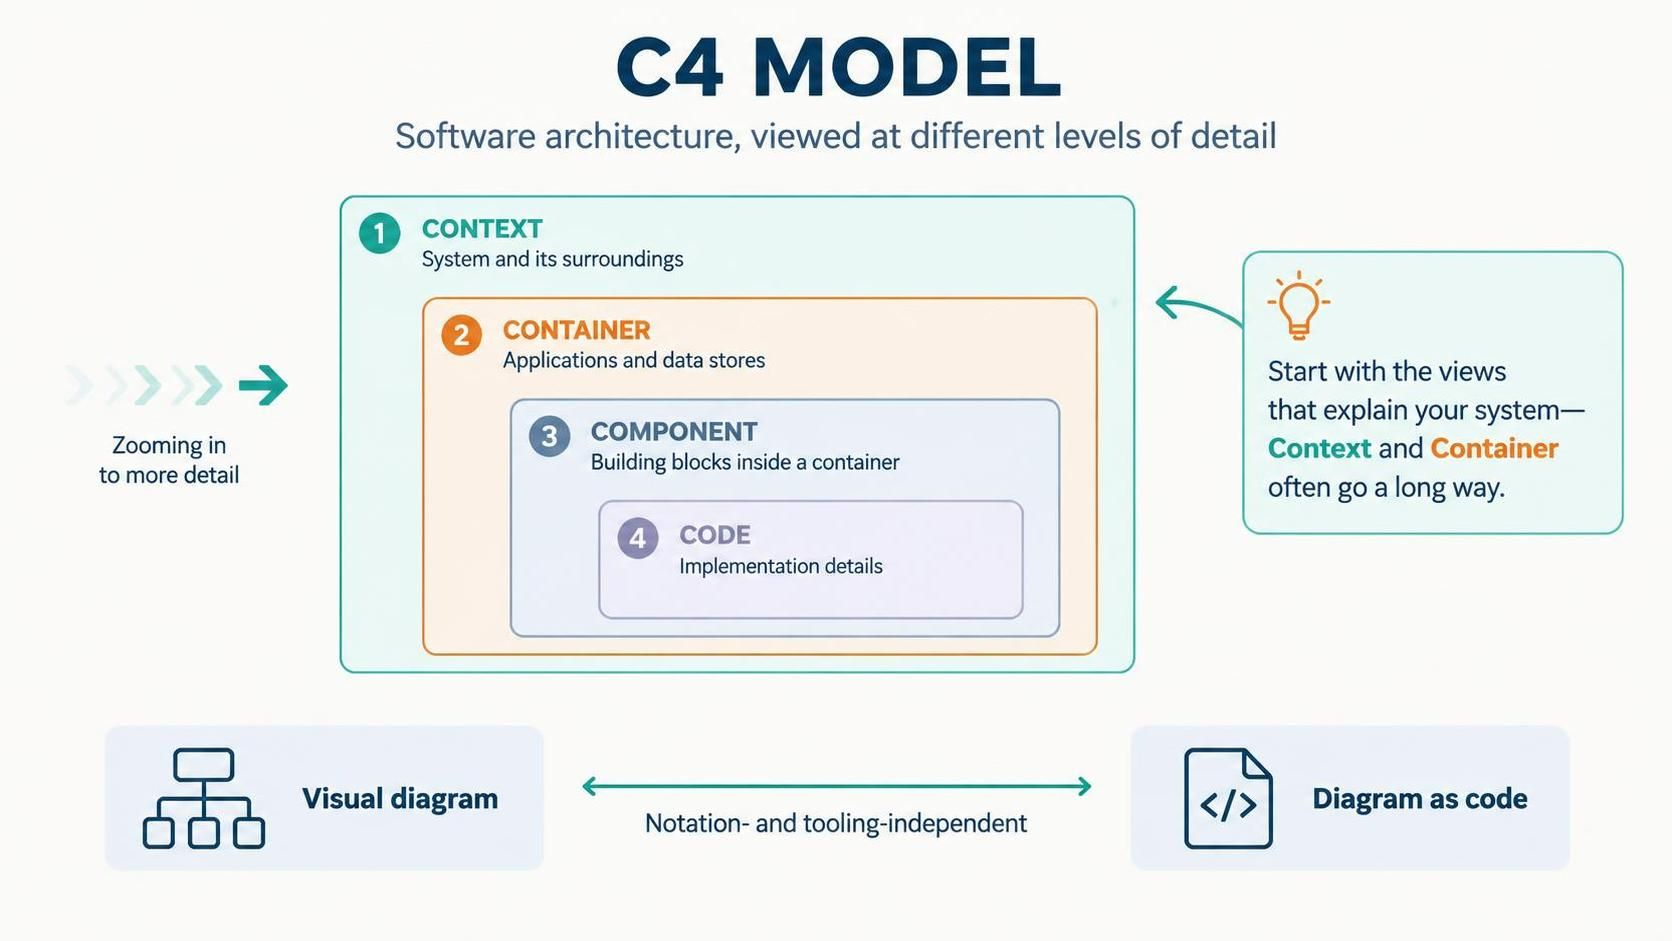
The C4 model is a way to describe software architecture through a set of views at different levels of detail. Its four core levels are Context, Container, Component, and Code. You can use only the views that help explain the system; many teams get most of the value from Context and Container diagrams. C4 is notation- and tooling-independent, so you can draw it with a visual editor or describe it as code.
What is a Context Diagram?
A System Context Diagram is the broad, “zoomed-out” view of one software system. It puts the system being documented in focus and shows the people and other software systems that directly interact with it. It is intended for both technical and non-technical readers.
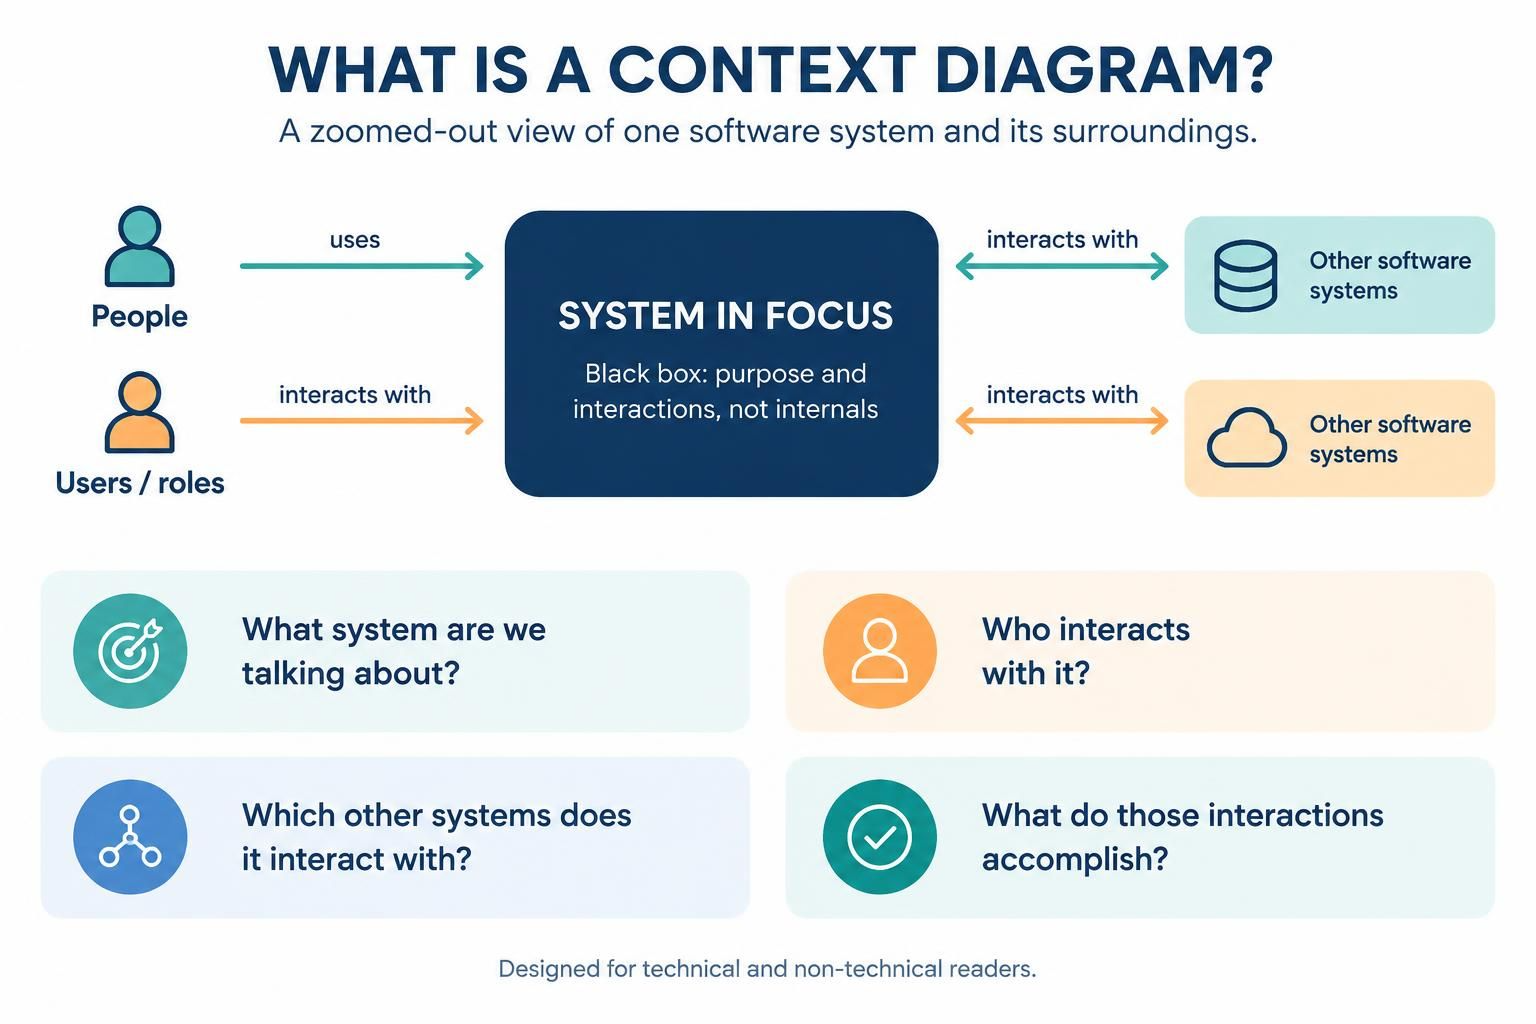
Think of it as answering:
-
What system are we talking about?
-
Who uses or interacts with it?
-
Which other systems does it interact with?
-
What do those interactions accomplish?
The system in focus is shown as a black box: the diagram explains its surroundings, not its internal construction.
Key concepts
-
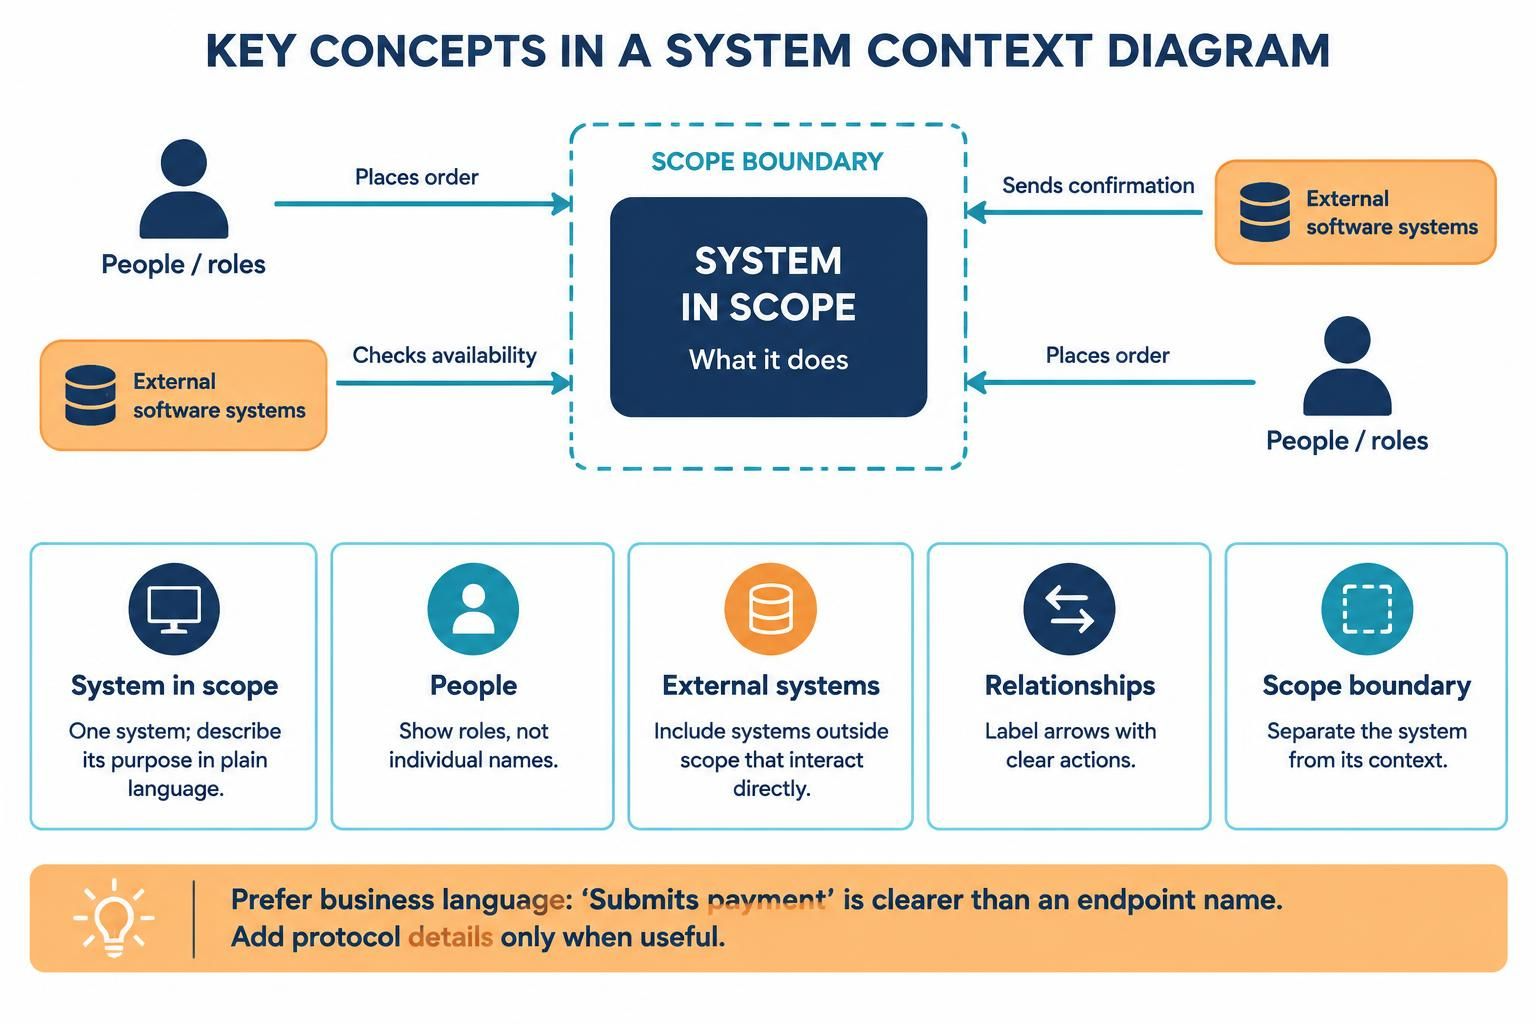
System in scope: The one software system whose context you are describing. State its purpose in a short, plain-language description.
-
People: Users, roles, or other human actors that interact with the system—such as Customer, Support Agent, or Administrator. Use roles rather than individual names.
-
External software systems: Systems outside your system’s scope that directly interact with it. These might be partner services, corporate systems, or legacy applications.
-
Relationships: Lines or arrows showing who interacts with whom. Label them with a clear action, such as “Places order,” “Checks availability,” or “Sends confirmation.”
-
Scope boundary: A clear distinction between the system you own or are describing and the surrounding actors and systems. The context diagram’s central system is in scope; its neighbors are context.
Relationship labels should describe the business interaction, not just the implementation detail. Add a technology or protocol only when it helps the intended audience—for example, “Submits payment” is usually more useful at this level than an endpoint name. More technical details can appear in lower-level views.
Purpose and value
A context diagram gives people a shared picture of the system’s purpose, users, dependencies, and boundaries. It is useful for aligning stakeholders, explaining scope, onboarding teammates, and identifying external dependencies that may matter for architecture reviews or risk discussions. C4 recommends it as a starting point for documenting a system.
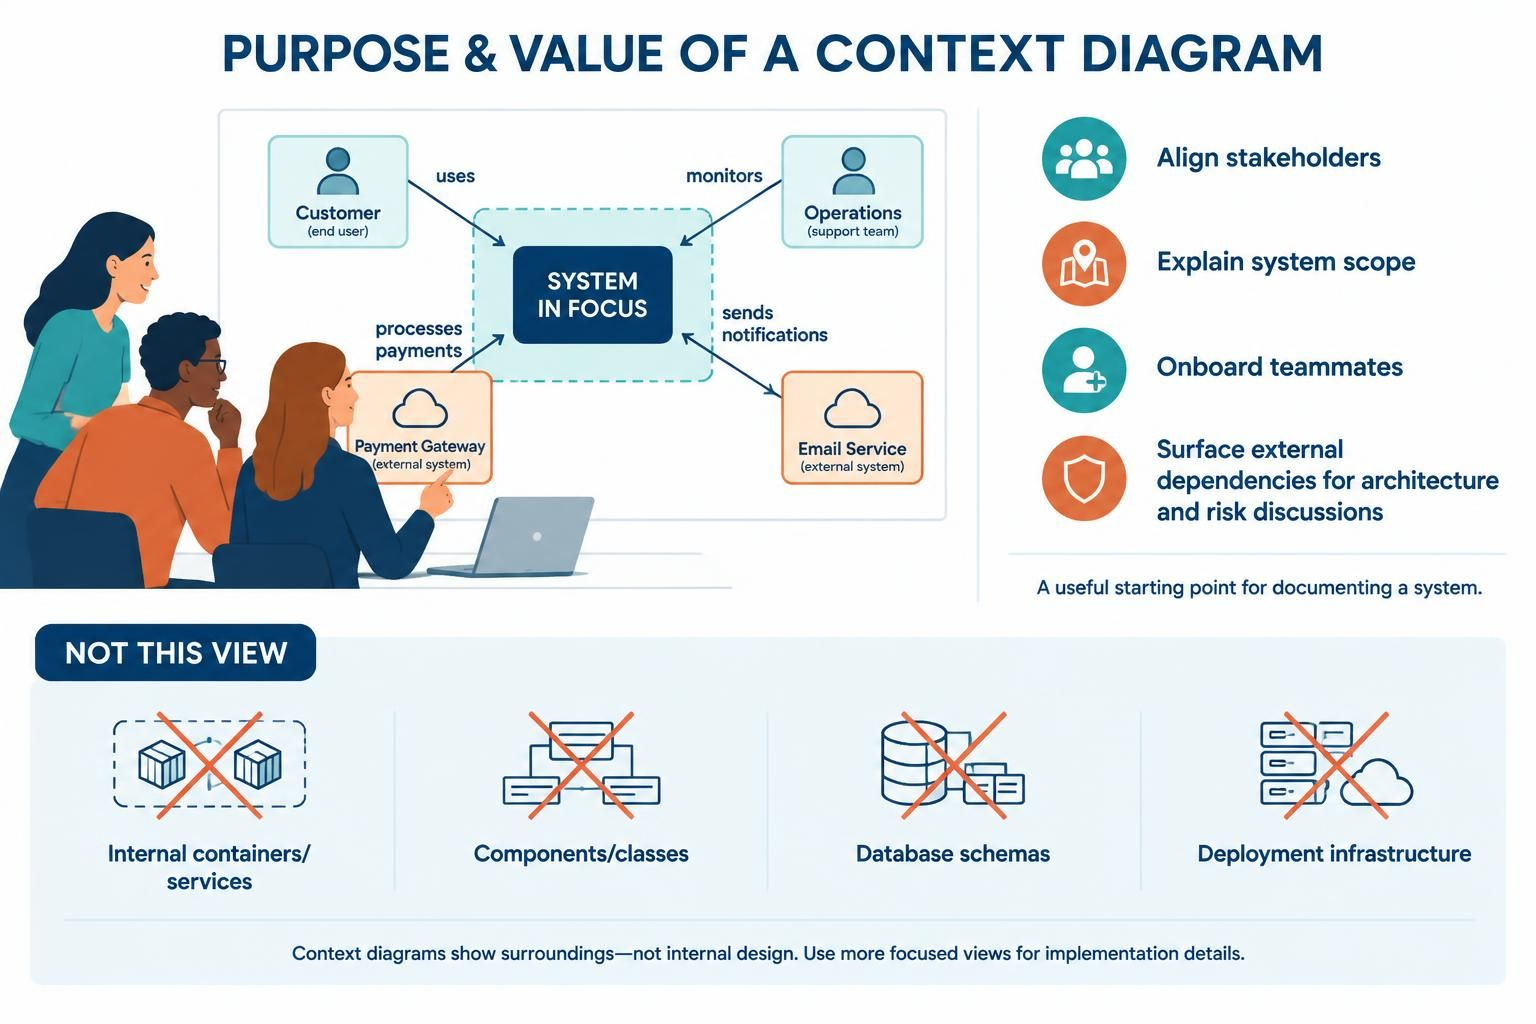
It is not intended to explain internal design. Avoid putting containers, internal services, components, classes, database schemas, or deployment infrastructure into this view. Those details make the diagram harder to understand and belong in more focused views.
How it relates to the other C4 levels
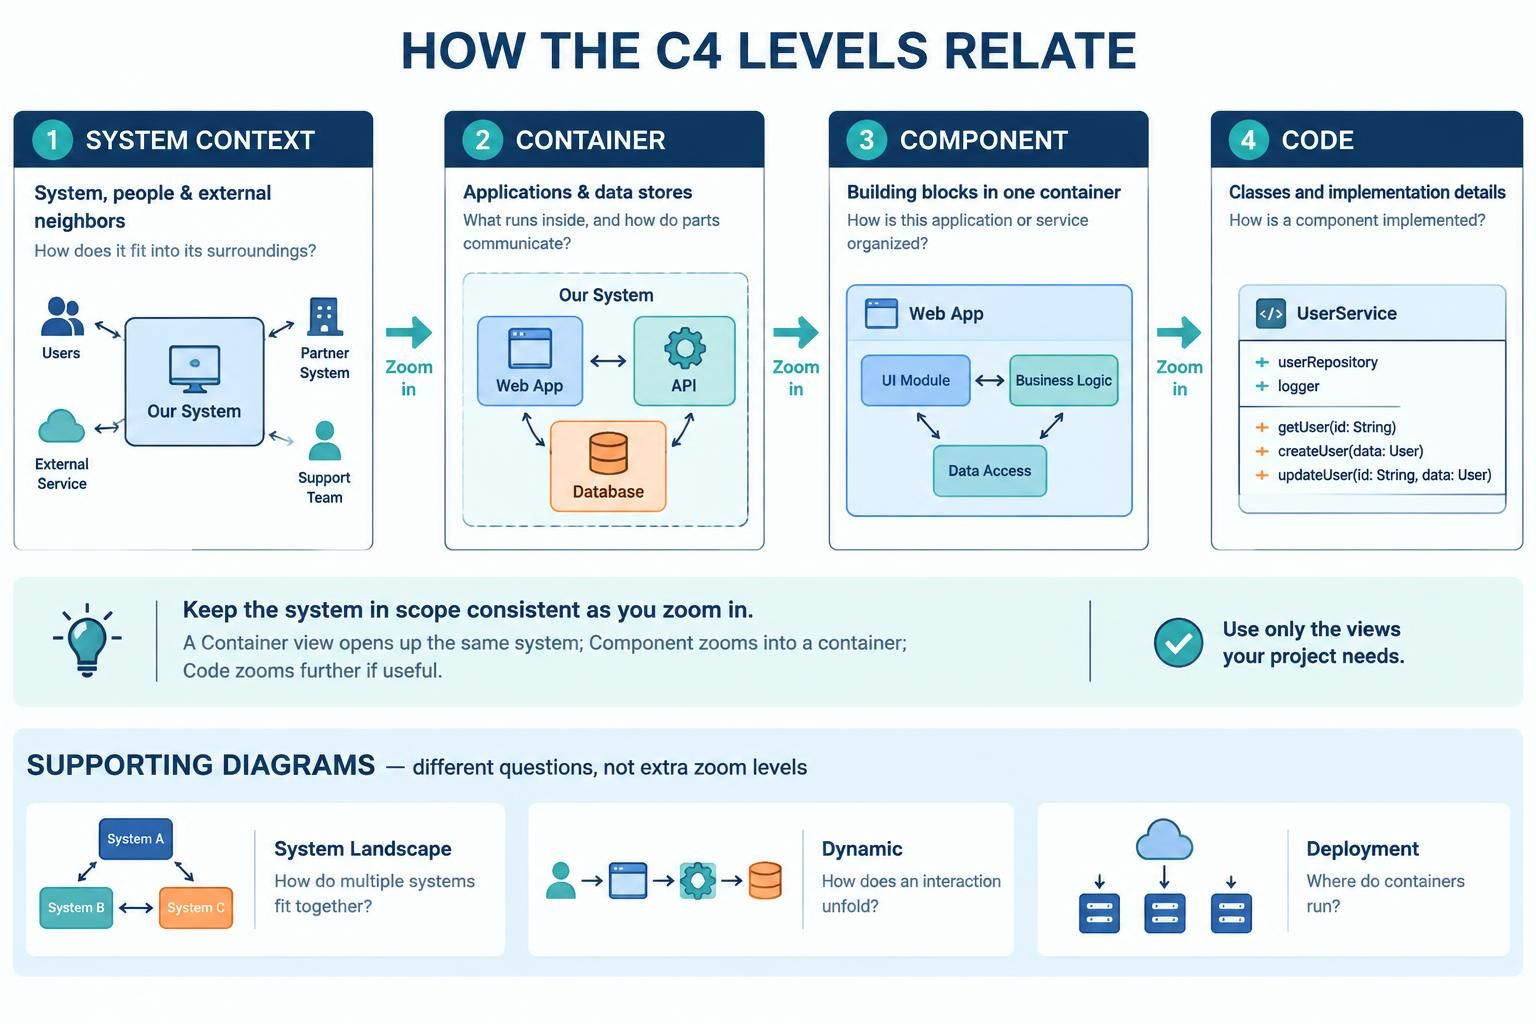
The levels are connected by zooming in on the same system:
| View | What it focuses on | Typical question |
|---|---|---|
| System Context | One system, its people, and its external software neighbors | What is this system, and how does it fit into its surroundings? |
| Container | The applications and data stores that make up the system, and how they communicate | What are the main runnable or data-holding parts inside the system? |
| Component | The major building blocks inside a selected container | How is this application or service internally organized? |
| Code | Code-level structures, such as classes or other implementation details | How is a particular component implemented? |
A Container diagram should remain consistent with the Context diagram: the system in scope is the same, but it is opened up to show its containers. A Component diagram then zooms into a selected container; a Code view can zoom in further if that detail is useful. Not every project needs all four views.
C4 also has supporting diagrams, including System Landscape, Dynamic, and Deployment diagrams. These are not additional zoom levels in the core four-level hierarchy: they answer different questions, such as how multiple systems fit together, how interactions unfold, or where containers run.
Example: Online Shop Context Diagram
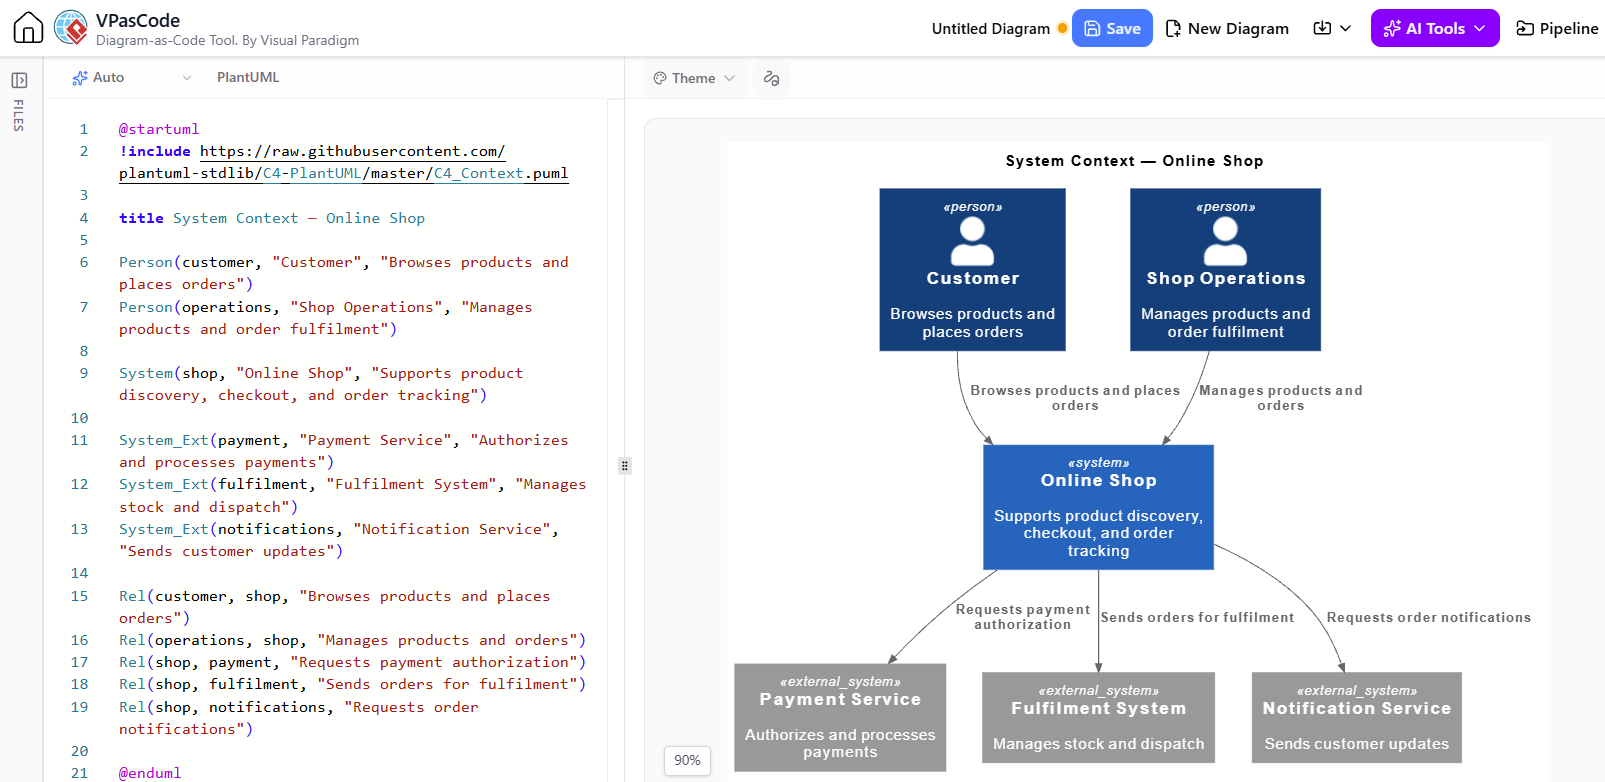
This example models an online shop, its two user roles, and three external systems. The names and relationships are illustrative—replace them with the actual scope and interactions of your system.
Rendered by VPasCode Tool for C4 – Context Diagram:
@startuml
!include https://raw.githubusercontent.com/plantuml-stdlib/C4-PlantUML/master/C4_Context.puml

title System Context — Online Shop

Person(customer, "Customer", "Browses products and places orders")
Person(operations, "Shop Operations", "Manages products and order fulfilment")

System(shop, "Online Shop", "Supports product discovery, checkout, and order tracking")

System_Ext(payment, "Payment Service", "Authorizes and processes payments")
System_Ext(fulfilment, "Fulfilment System", "Manages stock and dispatch")
System_Ext(notifications, "Notification Service", "Sends customer updates")

Rel(customer, shop, "Browses products and places orders")
Rel(operations, shop, "Manages products and orders")
Rel(shop, payment, "Requests payment authorization")
Rel(shop, fulfilment, "Sends orders for fulfilment")
Rel(shop, notifications, "Requests order notifications")

@enduml
The C4-PlantUML library provides the Person, System, System_Ext, and Rel macros used here. Its documentation describes C4_Context.puml as the include for Context diagrams.
How to read it: The Online Shop is the system in scope. Customers and Shop Operations are people who interact with it. The Payment Service, Fulfilment System, and Notification Service are external systems. Each relationship label summarizes the interaction without exposing internal implementation.
A practical way to create one
-
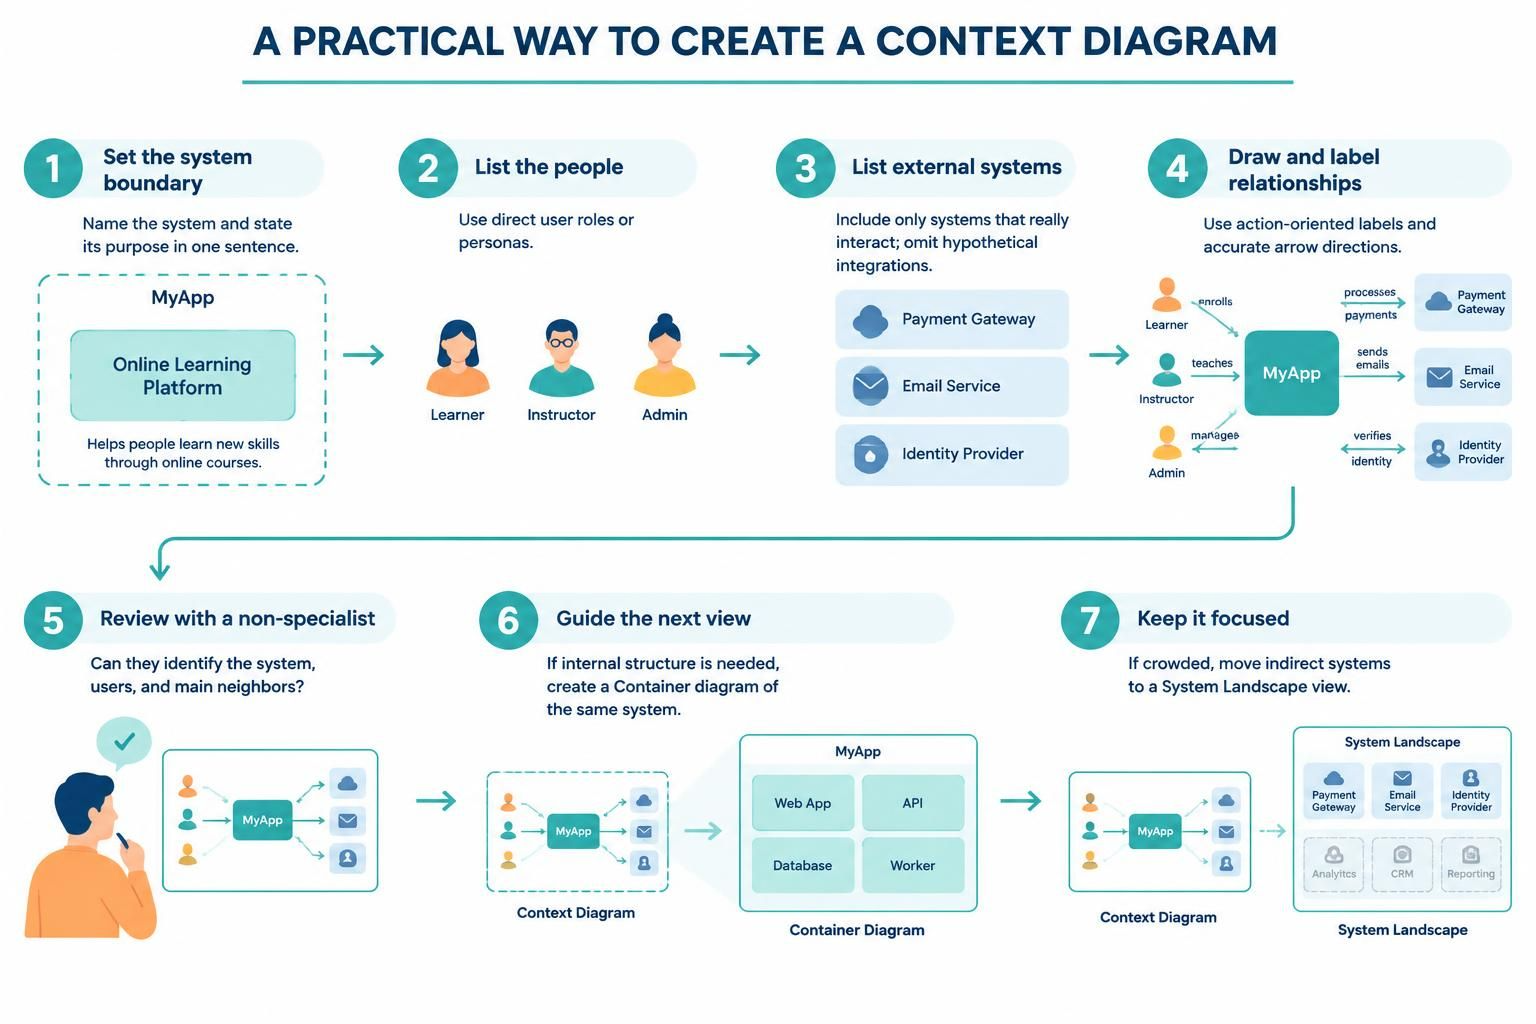
Choose the system boundary. Write the system’s name and purpose in one sentence. If the scope is unclear, resolve that before drawing.
-
List direct human users. Use meaningful roles or personas, not a long list of individual people.
-
List direct external-system interactions. Include systems that actually communicate with the system in scope; leave hypothetical integrations out.
-
Draw and label the relationships. Use short, action-oriented descriptions. Show the direction of interaction accurately.
-
Review it with a non-specialist. They should be able to identify the system, its users, and its main neighbors without needing to decode technical jargon.
-
Use it to guide the next view. If readers need to know what is inside the system, create a Container diagram that opens up the same system—not a more detailed Context diagram.
Keep the diagram focused and readable. If it becomes crowded, consider whether some elements are indirect or belong in a separate System Landscape view.
Tooling: Visual Paradigm, AI assistance, VPasCode, and OpenDocs
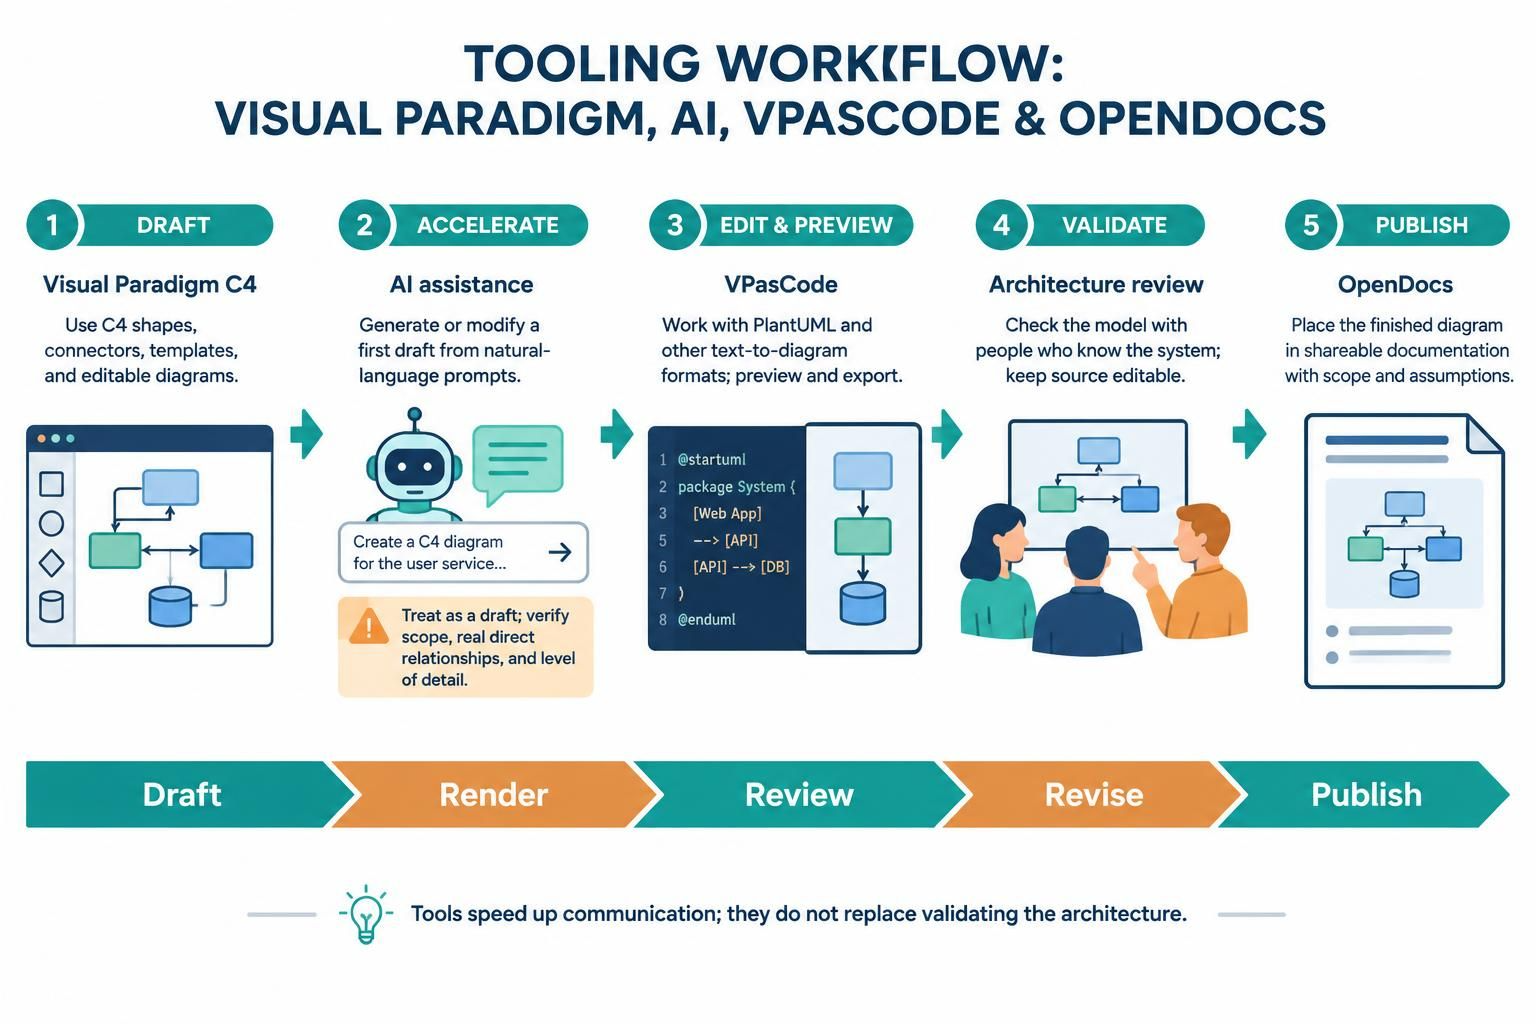
These tools can support different parts of the workflow:
-
Visual Paradigm C4: Visual Paradigm Online advertises C4 symbols, connectors, templates, and editable C4 diagrams, including System Context examples. A visual editor is useful for collaborative modeling, manual layout, and working with a template.
-
AI-assisted modeling: Visual Paradigm describes AI tools that generate and modify diagram code from natural-language instructions; it also documents an AI Diagram Generator for C4 views in Visual Paradigm Desktop. Treat generated diagrams as drafts: check the system boundary, whether relationships are real and direct, and whether the output has accidentally included lower-level detail.
-
VPasCode: VPasCode is a text-to-diagram workspace that supports PlantUML and other formats with a live preview. You can start from the sample code above, edit the labels and relationships, then render and export the result.
-
OpenDocs: Visual Paradigm describes sending finished diagrams from VPasCode to OpenDocs to place them in shareable documentation. Include a short explanation alongside the diagram so readers know its scope and any important assumptions.
A sensible loop is draft → render → review → revise → publish: use AI or a template to accelerate the first draft, validate the architecture with people who know the system, keep the source diagram editable, and publish the reviewed version with its context. The visual should communicate the model; it should not replace checking that the model is correct.

 English
 Arabic
 Chinese (Simplified)
 Dutch
 French
 German
 Italian
 Japanese
 Korean
 Portuguese
 Russian
 Spanish