


A comprehensive analysis of Visual Paradigm’s browser-based Diagram-as-Code platform and its impact on modern development workflows
Introduction: The Documentation Dilemma in Modern Software Development

📋 Executive Summary
VPasCode represents a paradigm shift in architectural documentation, combining the precision of code-driven development with the clarity of visual diagrams. Built on the foundation of Visual Paradigm’s two decades of expertise in enterprise architecture and UML modeling, this platform delivers a browser-based solution that requires zero installation while providing enterprise-grade diagramming capabilities.
Key Metrics:
| Metric | Impact |
|---|---|
| Setup Time | Zero – browser-based, no installation |
| Learning Curve | Minimal for developers familiar with code |
| Collaboration Speed | Instant sharing via URL links |
| Documentation Accuracy | Real-time rendering ensures visual consistency |
| Cost | Free to use and export |
🌟 New Introduction: Bridging the Documentation Gap
In today’s fast-paced software development landscape, the gap between code creation and visual documentation has long been a persistent challenge. Development teams spend countless hours manually creating and maintaining system architecture diagrams, often using drag-and-drop tools that are time-consuming, difficult to standardize, and challenging to keep visually consistent across teams.
Enter VPasCode – a groundbreaking Diagram-as-Code (DaC) platform that bridges this divide by enabling developers to create professional, precise, and easily shareable system architecture diagrams using nothing but code. By supporting industry-standard diagramming languages like Mermaid, PlantUML, and Graphviz, VPasCode transforms how teams visualize, communicate, and document complex system architectures.
“Think of it as ‘Markdown for architecture diagrams.’ You write declarative text, and VPasCode instantly renders beautiful, professional, vector-based diagrams in real time.”
This case study explores how VPasCode is reshaping the documentation workflow for modern development teams, offering a comprehensive look at its capabilities, advantages, and real-world applications.
🖼️ Platform Overview: The VPasCode Interface
The platform features an intuitive, developer-friendly interface designed for maximum productivity:
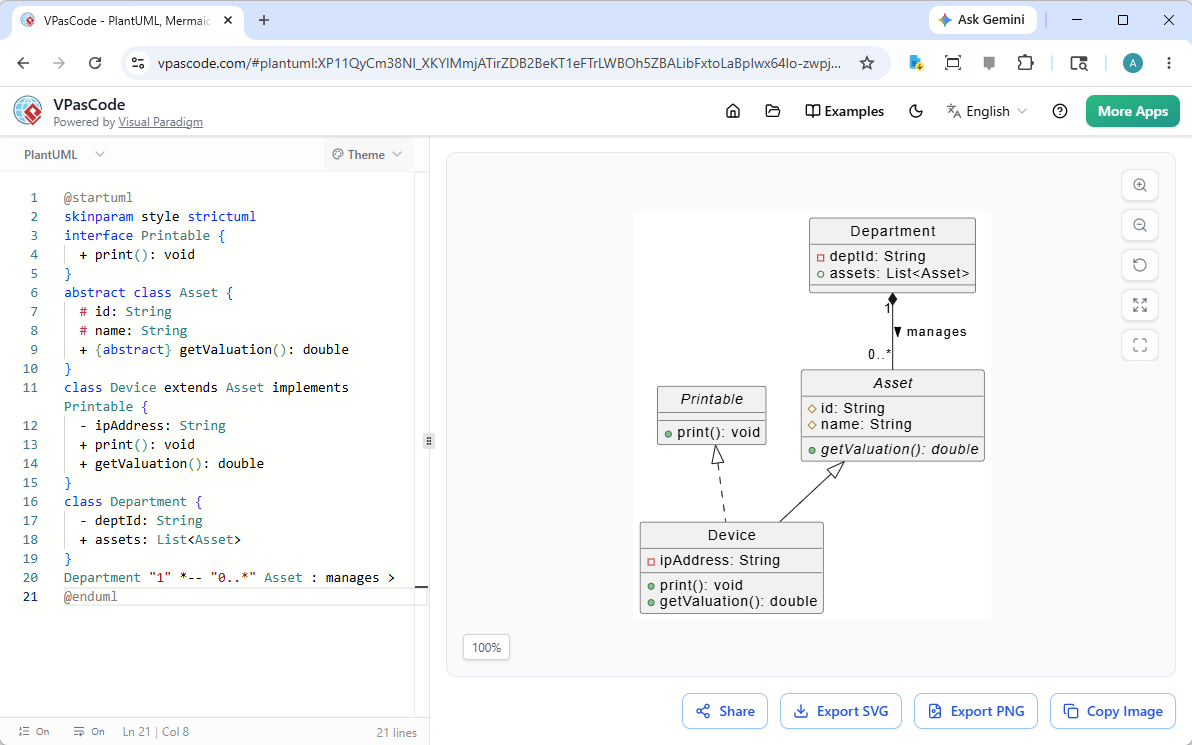
Figure 1: VPasCode’s dual-panel interface showing code editor (left) and real-time preview (right). Source: vpascode.com
Core Workflow: Write diagram code → See instant preview → Export or share.
🔧 The Challenge: Why Traditional Diagramming Falls Short
Before VPasCode, teams faced several critical challenges that hindered effective documentation:
| Pain Point | Traditional Tool Limitation | Business Impact |
|---|---|---|
| Manual Creation | Drag-and-drop requires pixel-perfect positioning | 5-10 hours/diagram maintenance |
| Visual Consistency | Styling varies by user skill and preference | Inconsistent documentation quality |
| Synchronization | Diagrams become outdated as systems evolve | Misaligned documentation |
| Collaboration | Sharing requires file transfers or accounts | Slow review cycles |
| Setup Complexity | Installation, plugins, dependencies | Delayed onboarding |
These limitations created documentation friction that accumulated over time, ultimately reducing team efficiency and increasing architectural misunderstandings.
🚀 The VPasCode Solution: Diagram-as-Code Philosophy
Core Principle: Write Logic, Not Pixels
VPasCode eliminates the need for manual node dragging and pixel-perfect positioning. Instead, developers write code that describes their system architecture, and the platform instantly renders professional diagrams.
Key Benefit: Teams focus on architectural logic rather than visual formatting, dramatically reducing documentation time while improving clarity and consistency.
Comprehensive Engine Support
VPasCode supports three industry-leading diagramming engines, providing teams with the flexibility to use their preferred syntax and diagram types.
1️⃣ PlantUML Integration – Enterprise-Grade UML
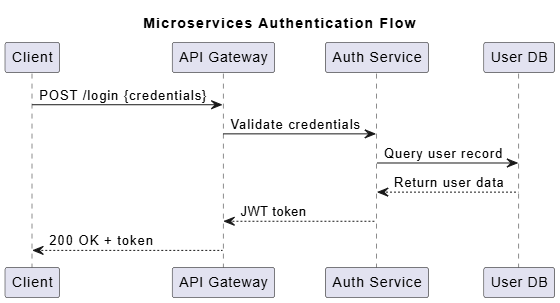
Figure 2: Example PlantUML sequence diagram rendered in VPasCode. Source: plantuml.com
Supported Diagram Types:
-
ArchiMate: Enterprise architecture modeling
-
Sequence Diagrams: Interaction flows between components
-
Class Diagrams: Object-oriented structure visualization
-
Activity Diagrams: Workflow and process modeling
-
Deployment Diagrams: Infrastructure and system topology
-
C4 Architecture: Modern software architecture visualization
-
ERD (Entity Relationship Diagrams): Database schema design
Sample PlantUML Code:
@startuml
title Microservices Authentication Flow
participant "Client" as C
participant "API Gateway" as G
participant "Auth Service" as A
participant "User DB" as D

C -> G: POST /login {credentials}
G -> A: Validate credentials
A -> D: Query user record
D --> A: Return user data
A --> G: JWT token
G --> C: 200 OK + token
@enduml
2️⃣ Mermaid.js Integration – Modern & Readable
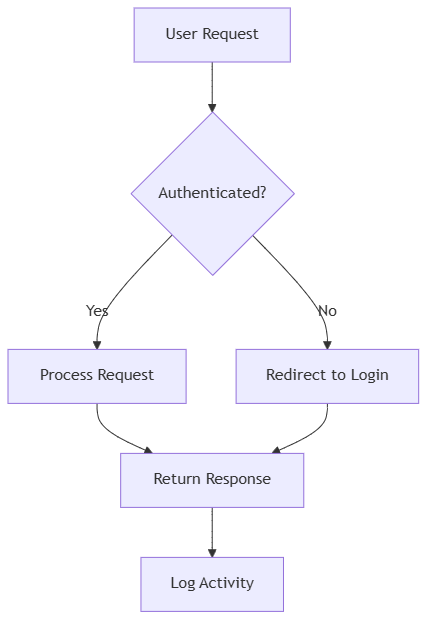
Figure 3: Mermaid flowchart demonstrating decision logic. Source: mermaid.live
Supported Diagram Types:
-
Flowcharts: Process and decision flow visualization
-
Sequence Diagrams: Component interaction sequences
-
Gantt Charts: Project timeline visualization
-
Mind Maps: Brainstorming and idea organization
-
C4 Model: Software architecture documentation
-
Timeline: Chronological event visualization
Sample Mermaid Code:
graph TD
    A[User Request] --> B{Authenticated?}
    B -->|Yes| C[Process Request]
    B -->|No| D[Redirect to Login]
    C --> E[Return Response]
    D --> E
    E --> F[Log Activity]
3️⃣ Graphviz (DOT) Integration – Complex Graph Visualization
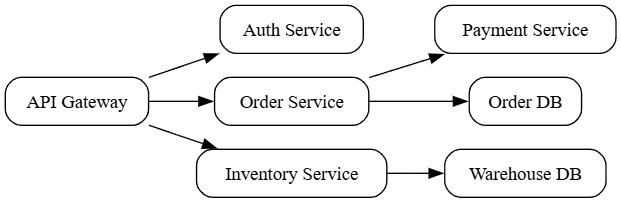
Figure 4: Graphviz DOT diagram showing network topology. Source: graphviz.org
Supported Diagram Types:
-
Digraph: Directed graph visualization
-
Cluster: Grouped node visualization
-
Org Chart: Organizational hierarchy
-
Data Flow: Information flow mapping
Sample Graphviz Code:
digraph Microservices {
    rankdir=LR;
    node [shape=box, style=rounded];

    "API Gateway" -> "Auth Service";
    "API Gateway" -> "Order Service";
    "API Gateway" -> "Inventory Service";
    "Order Service" -> "Payment Service";
    "Inventory Service" -> "Warehouse DB";
    "Order Service" -> "Order DB";
}
⚡ Key Features That Drive Adoption
Real-Time Rendering: Instant Visual Feedback
Impact:
-
Immediate validation of diagram syntax
-
Rapid iteration and refinement cycles
-
Enhanced learning through experimentation
-
Reduced context-switching between tools
Zero Setup Required: Browser-Based Accessibility
✅ No installation
✅ No account required
✅ No plugin configuration
✅ Works on any OS with a modern browser
✅ Instant onboarding for new team members
Benefits: Eliminates IT overhead, removes compatibility issues, and enables immediate productivity.
Easily Shareable: Collaborative URLs
Generate persistent, shareable links for instant feedback and team alignment:
🔗 https://www.vpascode.com/share/abc123xyz
   ├── View-only access for stakeholders
   ├── No login required for viewers
   ├── Embeddable in Confluence, Notion, documentation sites
   └── Perfect for presentations and client demos
Use Cases:
-
Architecture decision records (ADRs)
-
Stakeholder presentations
-
Remote team collaboration
-
Client demonstrations
-
Technical documentation embedding
Professional Vector Export Capabilities
Export Formats:
| Format | Best For | Quality |
|---|---|---|
| SVG | Web docs, responsive designs | Resolution-independent vector |
| PNG | Presentations, documentation | High-resolution raster |
| Print documentation, reports | Print-ready vector | |
| Copy Code | Documentation, knowledge bases | Source for easy reuse |
Quality Assurance: Vector-based exports maintain perfect quality at any size, from mobile screens to large-format prints.
🏢 Enterprise Provenance: Backed by Visual Paradigm
Two Decades of Modeling Excellence
VPasCode isn’t just another diagramming tool—it’s built on the solid foundation of Visual Paradigm’s 20+ years of leadership in:
-
Enterprise architecture modeling
-
UML standards compliance
-
Business process management (BPMN)
-
Software development lifecycle tools
Industry Wisdom Meets Modern Development: VPasCode combines Visual Paradigm’s profound industry expertise with modern code-driven workflows, delivering professional-grade output with developer-friendly interfaces.
Trust Metrics
🔹 20+ Years of modeling heritage
🔹 Free to Use & Export – No hidden costs
🔹 Enterprise-Ready – Professional output for business documentation
🔹 Developer-Centric – Code-driven execution speeds
🔹 Privacy-Focused – No mandatory account creation
🎯 Implementation Scenarios: Real-World Applications
Scenario 1: Agile Development Teams
Challenge: Rapidly evolving architecture needs clear, up-to-date visual documentation.
VPasCode Solution:
Workflow:
  1. Create diagram code that describes current architecture
  2. Update code as system components change
  3. Export updated diagrams for documentation
  4. Share live links for team alignment
Outcome: Faster documentation updates with consistent visual quality; diagrams stay aligned with implementation through simple code edits.
Scenario 2: Enterprise Architecture
Challenge: Complex multi-system architectures require clear visualization for stakeholders.
VPasCode Solution:
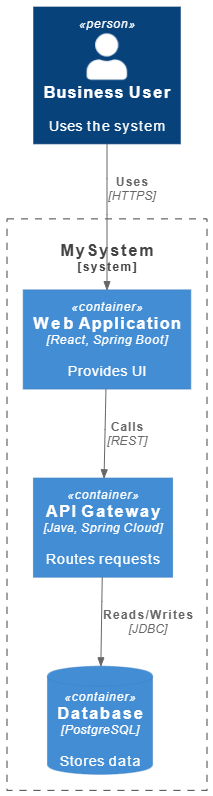
@startuml
!include https://raw.githubusercontent.com/plantuml-stdlib/C4-PlantUML/master/C4_Container.puml

Person(user, "Business User", "Uses the system")
System_Boundary(c1, "MySystem") {
    Container(web_app, "Web Application", "React, Spring Boot", "Provides UI")
    Container(api, "API Gateway", "Java, Spring Cloud", "Routes requests")
    ContainerDb(db, "Database", "PostgreSQL", "Stores data")
}

Rel(user, web_app, "Uses", "HTTPS")
Rel(web_app, api, "Calls", "REST")
Rel(api, db, "Reads/Writes", "JDBC")
@enduml
Outcome: Improved stakeholder understanding and faster architectural decision-making through clear, professional visuals.
Scenario 3: DevOps and Infrastructure
Challenge: Infrastructure configurations need visual representation for team alignment.
VPasCode Solution:
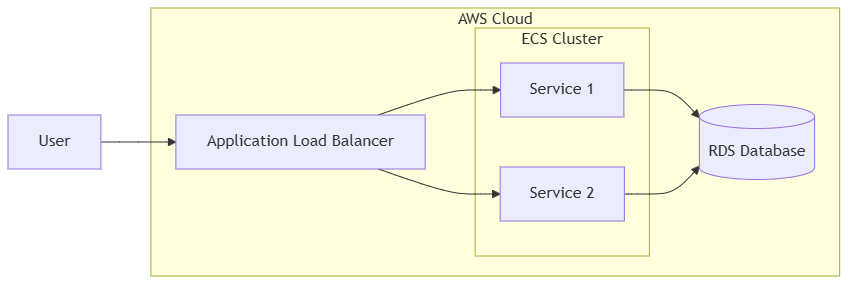
graph LR
    subgraph AWS["AWS Cloud"]
        ALB[Application Load Balancer]
        subgraph ECS["ECS Cluster"]
            S1[Service 1]
            S2[Service 2]
        end
        RDS[(RDS Database)]
    end

    User --> ALB
    ALB --> S1
    ALB --> S2
    S1 --> RDS
    S2 --> RDS
Outcome: Enhanced infrastructure visibility and reduced deployment errors through clear visual documentation that’s easy to update.
Scenario 4: Database Design & ER Modeling
Challenge: Complex database schemas require clear, maintainable documentation.
VPasCode Solution:
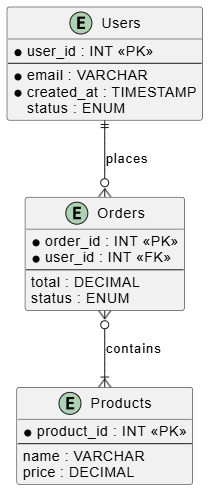
@startuml
entity "Users" as U {
    *user_id : INT <<PK>>
    --
    *email : VARCHAR
    *created_at : TIMESTAMP
    status : ENUM
}

entity "Orders" as O {
    *order_id : INT <<PK>>
    *user_id : INT <<FK>>
    --
    total : DECIMAL
    status : ENUM
}

entity "Products" as P {
    *product_id : INT <<PK>>
    --
    name : VARCHAR
    price : DECIMAL
}

U ||--o{ O : places
O }o--|{ P : contains
@enduml
Outcome: Improved database design clarity, easier onboarding for new engineers, and clearer data relationship documentation.
🔐 Technical Advantages: Why Code-Based Diagrams Win
Text-Based Clarity and Precision
Unlike traditional diagramming tools that rely on visual positioning, VPasCode generates text-based diagrams that:
✅ Are easy to read and understand at a glance
✅ Enable quick copying and pasting between documents
✅ Support consistent formatting through reusable templates
✅ Allow precise control over diagram structure and styling
Benefits:
-
Clear, readable syntax that documents intent
-
Easy to share code snippets in chats, emails, or docs
-
Consistent output through standardized templates
-
Reduced ambiguity in architectural communication
Automation & Documentation Integration
Diagram-as-Code enables powerful documentation capabilities:
# Documentation workflow example
Documentation_Pipeline:
  - Write diagram code in plain text
  - Preview instantly in browser
  - Export as SVG/PNG for documentation
  - Embed in Confluence, Notion, or static sites
  - Update by editing code – no re-drawing needed
Capabilities Enabled:
-
Streamlined documentation creation workflows
-
Consistent diagram styling across all team outputs
-
Easy updates by modifying text, not visuals
-
API-ready code snippets for dynamic documentation
Consistency and Standards Enforcement
// Example: Team style guide enforced via code templates
const diagramTemplate = {
  theme: "corporate-blue",
  fontFamily: "Inter, sans-serif",
  nodeStyle: {
    border: "2px solid #2563eb",
    borderRadius: "8px",
    padding: "12px"
  },
  arrowStyle: {
    color: "#64748b",
    strokeWidth: "2px"
  }
};
Benefits:
-
Enforce architectural standards through reusable code templates
-
Maintain consistent styling across all team diagrams
-
Reduce human error in diagram creation
-
Ensure compliance with organizational branding guidelines
📊 Cost-Benefit Analysis: The ROI of Diagram-as-Code
Traditional Approach Costs (Annual Estimate)
| Cost Category | Estimated Cost | Notes |
|---|---|---|
| Software Licenses | $100-500/user/year | Visio, Lucidchart, Enterprise tools |
| Training Time | 20-40 hours/user | Learning complex GUI tools |
| Maintenance Effort | 5-10 hours/month/diagram | Manual updates, repositioning |
| Collaboration Overhead | Significant | File sharing, access management |
| Total (10-person team) | ~$15,000-40,000/year | Plus opportunity cost |
VPasCode Approach
💰 Cost: Free to use and export – no licensing fees
🎓 Training: Minimal (familiar syntax for developers)
🔧 Maintenance: Simple text edits keep diagrams current
🤝 Collaboration: Instant via shareable URLs
🔄 Updates: Diagrams evolve with simple code changes
ROI Metrics
| Metric | Improvement | Business Impact |
|---|---|---|
| Time Savings | 60-80% reduction in diagram creation | Faster documentation cycles |
| Accuracy | Real-time preview ensures visual correctness | Reduced rework and confusion |
| Collaboration | Instant sharing accelerates feedback | Faster decision-making |
| Scalability | Unlimited diagrams at zero marginal cost | Enterprise-wide adoption feasible |
| Onboarding | New engineers productive in hours, not days | Reduced ramp-up time |
🛡️ Security, Compliance & Governance
Data Protection Principles
-
Browser-Based Processing: Minimizes data transmission; diagrams render client-side
-
No Mandatory Accounts: Basic usage requires no personal data collection
-
Secure Sharing: Controlled access via unique, non-guessable URLs
-
Privacy by Design: Aligns with GDPR, CCPA, and enterprise security policies
Compliance Support
VPasCode facilitates regulatory compliance documentation:
✅ Clear audit trails through documented diagram code
✅ Documentation standards enforcement via templates
✅ Regulatory diagramming support (GDPR data flows, HIPAA architectures, SOC2 controls)
✅ Exportable artifacts for compliance audits
🌐 Community, Support & Ecosystem
Growing Ecosystem
-
Active User Community: Share templates, patterns, and best practices
-
Extensive Documentation Library: Syntax guides, examples, troubleshooting
-
Regular Feature Updates: Continuous improvement based on user feedback
-
Responsive Support Channels: Community forums and Visual Paradigm support
Integration Ecosystem
🔗 IDEs: VS Code, IntelliJ, Vim (via extensions)
🔗 Documentation: Confluence, Notion, MkDocs, Docusaurus
🔗 Formats: Markdown, AsciiDoc, HTML, PDF
🔗 Collaboration: Slack, Teams, email (via code snippets)
VS Code Integration Example:
// settings.json for PlantUML preview
{
  "plantuml.render": "PlantUMLServer",
  "plantuml.server": "https://www.plantuml.com/plantuml",
  "markdown-preview-enhanced.plantumlServer": "https://www.plantuml.com/plantuml"
}
🔮 Future Roadmap
VPasCode continues to evolve with community-driven development:
🚀 Planned Enhancements:
├── Enhanced real-time collaboration (multi-user editing)
├── Additional diagram types (BPMN, SysML, ArchiMate 3.2)
├── Advanced customization (custom themes, plugin architecture)
├── Enterprise features (SSO, access controls, audit logs)
├── API access for programmatic diagram generation
└── AI-assisted diagram suggestions from code comments
🎯 New Conclusion: Engineering Documentation for the Future
VPasCode represents more than just a diagramming tool—it embodies a fundamental shift in how development teams approach architectural documentation. By treating diagrams as code, organizations can finally achieve clear, consistent, and maintainable visual documentation that evolves seamlessly with their systems, all while reducing the time and effort required to create professional-quality diagrams.
The platform’s support for industry-standard engines like PlantUML, Mermaid, and Graphviz ensures that teams can leverage existing knowledge and syntax while benefiting from modern, browser-based accessibility. The zero-setup requirement, combined with real-time rendering and easy sharing capabilities, removes traditional barriers to effective documentation.
Most importantly, VPasCode’s foundation in Visual Paradigm’s two decades of enterprise architecture expertise provides confidence that the diagrams produced meet professional standards suitable for business-critical documentation. The fact that this enterprise-grade capability is available free of charge democratizes access to high-quality architectural visualization, enabling teams of all sizes to improve their documentation practices.
The Bottom Line: In an era where software complexity continues to accelerate, the ability to maintain clear, accurate, and maintainable documentation is not a luxury—it’s a competitive necessity. VPasCode’s Diagram-as-Code approach provides a sustainable, scalable, and developer-aligned solution that turns documentation from a burden into an asset.
Key Takeaways for Decision-Makers
-
✅ Diagram-as-Code eliminates visual inconsistency through text-based, template-driven workflows
-
✅ VPasCode supports three major diagramming engines with zero setup required, maximizing team flexibility
-
✅ Real-time rendering and easy sharing accelerate collaboration, reducing review cycles and improving clarity
-
✅ Enterprise-grade output is now accessible at no cost, democratizing professional documentation
-
✅ Text-based diagrams are easy to update, share, and embed, supporting agile documentation practices
Getting Started: Your First Diagram in 10 Minutes
1️⃣ Visit: https://www.vpascode.com/
2️⃣ Select: PlantUML (recommended for architecture)
3️⃣ Load: "C4 Context" template from examples
4️⃣ Edit: Replace placeholder names with your system components
5️⃣ Preview: Watch your architecture render instantly
6️⃣ Share: Copy the URL or export as SVG for your docs
7️⃣ Reuse: Save the code snippet for future updates
Ready to transform your documentation workflow? Experience the future of Diagram-as-Code today at VPasCode.
Target Audience: Software developers, system architects, DevOps engineers, technical leads, enterprise architects, and development teams seeking to modernize their documentation practices.
Recommended Next Steps:
Pilot VPasCode with one high-impact diagram (e.g., C4 Context diagram)
Establish team standards for diagram syntax and styling
Integrate diagram exports into your documentation workflow
Document your “Diagram-as-Code” workflow for onboarding
Conclusion: Clarity Through Code—The Future of Technical Documentation
- Collaboration improves because anyone can read, understand, and contribute to diagram definitions using familiar syntax
- Onboarding accelerates because new team members can explore system architecture through executable, self-documenting code
- Stakeholder alignment strengthens because professional-quality visuals can be generated and shared instantly, without specialized tooling
- Documentation debt shrinks because updating a diagram is as simple as editing a few lines of text
The ultimate takeaway: In a world where software complexity is the only constant, the ability to communicate architecture clearly isn’t just helpful—it’s essential. VPasCode’s code-driven approach transforms documentation from a maintenance burden into a strategic asset, ensuring that your team’s understanding of the system evolves in lockstep with the system itself.
