


Introduction
As a Product Manager with over seven years of experience bridging the gap between technical teams and business stakeholders, I’ve seen my fair share of process modeling tools. Some are too rigid, others too simplistic, and many fail to communicate effectively with non-technical audiences. When I recently evaluated Visual Paradigm for our workflow optimization initiatives at Acme Cloud, I was looking for more than just a diagramming tool—I needed a comprehensive platform that could handle complex BPMN 2.0 standards while remaining accessible to business analysts and developers alike.
What I found was a robust ecosystem that blends precise diagramming with advanced automation, collaborative management, and simulation capabilities. This review shares my hands-on experience with Visual Paradigm, focusing on how its core features, data element handling, and strategic tools can transform operational workflows from abstract concepts into actionable, optimized processes.
Core Diagramming Features: Precision Meets Intelligence
Visual Paradigm’s approach to BPMN 2.0 modeling is both comprehensive and intuitive. The platform supports the full spectrum of BPMN notations, ensuring that every event, gateway, and task type is represented accurately. But what sets it apart is how it enhances traditional diagramming with smart automation.
Full BPMN 2.0 Notations
The tool provides complete support for all standard elements, including:
-
Events: Start, intermediate, and end events with various triggers.
-
Specialized Task Types: Service, User, Manual, and Script tasks are clearly differentiated, helping teams understand who or what is responsible for each action.
-
Gateways: Exclusive, parallel, and inclusive gateways allow for complex decision logic.
-
Data Objects and Artifacts: These elements help visualize information flow alongside control flow.
AI BPMN Diagram Generator
One of the standout features is the AI BPMN Diagram Generator. As someone who often receives process narratives in plain English from stakeholders, this feature is a game-changer. It automatically translates textual descriptions into fully interactive, standard-compliant BPMN 2.0 layouts. This not only saves hours of manual diagramming but also ensures consistency and adherence to best practices.
Resource-Centric Modeling
Unlike tools that treat diagram elements as static shapes, Visual Paradigm creates them as reusable model components. This resource-centric approach means that if you update a task definition in one place, it reflects across all diagrams where that task is used. This is invaluable for maintaining consistency in large-scale enterprise processes.
Smart Connection Rules
The platform dynamically validates flow structures, preventing invalid sequence or message paths. This real-time feedback reduces errors and ensures that your diagrams are not just visually appealing but logically sound.
Flexible Swimlane Editing
Partitioning processes into pools and lanes is simplified with interactive horizontal or vertical editing. This makes it easy to assign responsibilities to different departments or roles, clarifying accountability within cross-functional workflows.
Process Drill-Down
For complex processes, the Process Drill-Down feature allows sub-processes to collapse or expand. This keeps master views clean and readable while enabling users to nest detailed diagrams inside higher-level workflows. It’s like having a zoomable map of your business operations.
Understanding BPMN Data Elements: The Information Flow
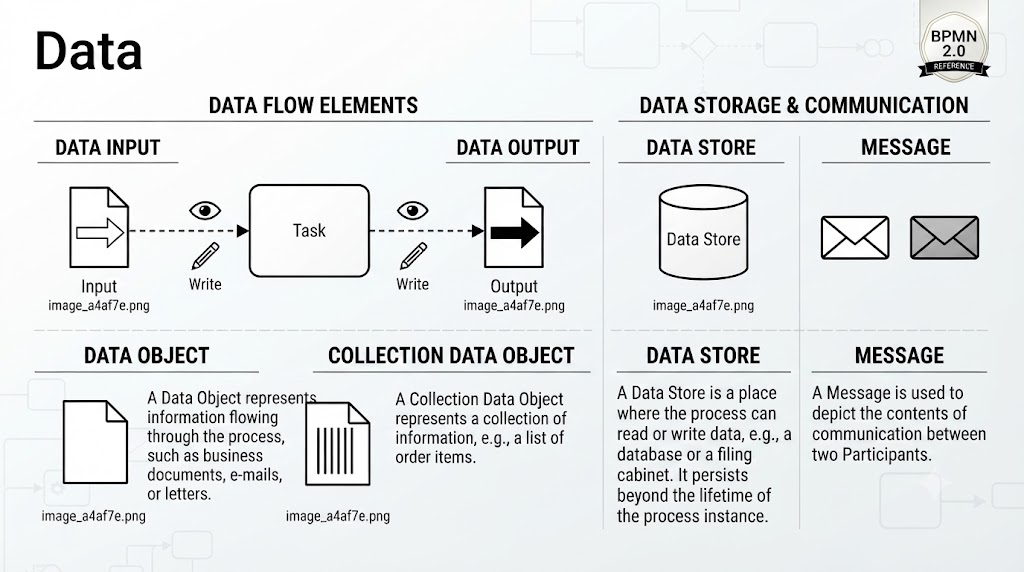
While control flow shows what happens and when, data elements reveal what information is involved. Visual Paradigm excels in visualizing these critical components, ensuring that stakeholders understand how data moves through, is stored in, and is transformed by business processes.
1. Data Input & Data Output
These elements define the boundaries of the process regarding external information.
-
Data Input: Represents an external input required by the process. It acts as a trigger or dependency. For example, in an order fulfillment process, the “Customer Order” is the Data Input.
-
Data Output: Represents the final result of the process instance. In the same example, the “Shipping Notification” might be the Data Output.
2. Data Object
The Data Object is the most generic container for information.
-
Definition: It represents a document, file, or piece of information moving through the process.
-
Key Concept: Unlike Data Stores, a Data Object represents the state of a document at a specific point in time. Think of an invoice or a signed contract being passed between departments.
3. Collection Data Object
The Collection Data Object is a specialized version of the Data Object.
-
Definition: It represents a set of information rather than a single item.
-
Usage Case: Use this for lists, such as a “Line Item List” for an order or a “List of Candidates” for recruitment.
4. Data Store
The Data Store provides a place for the process to read and write information.
-
Persistence: Crucially, data held in a Data Store persists beyond the lifetime of the process instance.
-
Usage Case: Use this to represent databases, ERP systems (like SAP), Excel spreadsheets, or physical filing cabinets where data is archived.
5. Message
The Message element visualizes communication between two distinct participants.
-
Definition: It depicts the content of the communication.
-
Usage Case: Used when a process sends an “Order Confirmation” to a customer or receives a “Delivery Update” from a logistics partner.
Summary Table: Data Element Reference
| Element | Icon Shape | Key Characteristic |
|---|---|---|
| Data Input | Document with right arrow | External input to process |
| Data Output | Document with solid black arrow | Result of the process |
| Data Object | Simple document icon | Information flowing through process |
| Collection | Document with vertical lines | Represents a set or list |
| Data Store | Cylinder icon | Persistent storage (Database/Files) |
| Message | Envelope icon | External communication |
Analysis and Simulation Tools: From Theory to Practice
Visual Paradigm doesn’t just help you draw processes; it helps you analyze and optimize them.
Process Simulation
The Process Simulation feature evaluates workflow paths to calculate operating costs, identify resource bottlenecks, and determine total cycle times. This quantitative insight is crucial for making data-driven decisions about process improvements.
Process Animation
For non-technical stakeholders, Process Animation is invaluable. It visually replays alternative process choices and token paths, showing the logic in action. This makes it easier to gain buy-in from executives or clients who may not be familiar with BPMN notation.
As-Is and To-Be Gap Analysis
The platform explicitly maps current business baselines (As-Is) against prospective future-state workflows (To-Be). This side-by-side comparison guides improvements and helps teams visualize the impact of proposed changes.
Matrix Transformation
Visual Paradigm can automatically convert functional BPMN data structures into actionable RACI (Responsible, Accountable, Consulted, Informed) or CRUD (Create, Read, Update, Delete) matrices. This bridges the gap between process modeling and role assignment, ensuring clarity in responsibilities.
Collaboration and Framework Alignment: Working Together
In today’s distributed work environments, collaboration features are non-negotiable.
Version Comparison (Visual-Diff)
The Version Comparison tool tracks operational revisions by visually comparing different versions of a workflow side by side. This makes it easy to see what changed, who changed it, and why.
Team Co-Editing
Multiple team members can work on the same diagram simultaneously, with live updates and revision synchronization. This eliminates the chaos of emailing multiple versions back and forth.
Agile Integration
Visual Paradigm synchronizes specific workflow components straight into user stories and agile software development backlogs. This ensures that process models are not isolated artifacts but integral parts of the development lifecycle.
Strategic Implementation Tips
Based on my experience, here are three key tips for using Visual Paradigm effectively:
-
Keep it Focused: Only model data that is critical for understanding the business outcome. Over-modeling every single data piece can clutter diagrams and reduce clarity.
-
Differentiate Flow: Always use the dashed line (association) to link Tasks to Data Objects. This distinguishes data flow from the solid lines used for sequence flow, maintaining diagram readability.
-
Define the Store: If a task requires looking up a customer record in your CRM, ensure you use a Data Store to indicate that the information is being pulled from a persistent system rather than just being passed along as a document.
Conclusion
Visual Paradigm has proven to be an indispensable tool in my product management toolkit. Its comprehensive support for BPMN 2.0 standards, combined with intelligent automation and robust collaboration features, makes it suitable for both business analysts and developers. The ability to simulate processes, animate workflows, and integrate with agile frameworks ensures that process modeling is not just a documentation exercise but a strategic asset.
For organizations looking to optimize operational workflows, reduce ambiguity, and improve cross-functional alignment, Visual Paradigm offers a powerful, standards-compliant solution. Whether you’re mapping out a simple approval process or designing a complex enterprise-wide workflow, this platform provides the precision, flexibility, and insight needed to turn process chaos into clarity.
References
- Visual Paradigm Features: Visual Paradigm provides a fully comprehensive, standards-compliant BPMN 2.0 modeling platform tailored for business analysts and developers alike, blending traditional diagramming with advanced automation and simulation.
- BP Modeling Solution: Offers smart connection rules, flexible swimlane editing, and resource-centric modeling to optimize operational workflows and prevent invalid sequence paths.
- AI BPMN Generator Guide: Explains how the AI BPMN Diagram Generator automatically translates plain-English process narratives into fully interactive, standard-compliant BPMN 2.0 layouts.
- BPMN Made Easy: Highlights tools for simplifying BPMN modeling, including process animation and gap analysis for non-technical stakeholders.
- BPMN Tutorial 1: Provides foundational tutorials on BPMN notations, including events, specialized task types, gateways, and data objects.
- BPMN Tutorial PDF: A downloadable PDF version of the foundational BPMN tutorial for offline reference.
- BPMN Activity Types Explained: Detailed guide on different BPMN activity types, helping users choose between Service, User, Manual, and Script tasks.
- Visual Paradigm YouTube Demo: Video demonstration of Visual Paradigm’s features, including swimlane editing and process drill-down capabilities.
- SysML Modeling Guide: Discusses resource-centric modeling where elements are created as reusable model components rather than static shapes.
- BPMN Swimlanes Tutorial: Focuses on partitioning processes using interactive horizontal or vertical pools and lanes.
- BPMN Diagram Tools Overview: Reiterates the comprehensive feature set for BPMN diagramming, including full notation support and AI integration.
- Visual Paradigm Blog: Discusses Visual Paradigm as an all-in-one software solution, emphasizing its role in software development and process modeling.
- Business Process Modeling Guide: Covers best practices for business process modeling, including As-Is and To-Be gap analysis.
- BPMN Features List: Lists key features such as process simulation, animation, and matrix transformation for RACI/CRUD outputs.
Related posts:
 Visual Paradigm Online PowerPoint Web Viewer: Convert PPT to HTML5 with Animations & Transitions
 Complete Guide to Visual Paradigm Online Office Suite
 VPasCode Feature Review Guide: The Ultimate Diagram-as-Code Solution for Modern Teams
Mastering Business Process Modeling: A Practical Guide to BPMN 2.0
VPasCode Feature Review Guide: The Ultimate Diagram-as-Code Solution for Modern Teams
Mastering Business Process Modeling: A Practical Guide to BPMN 2.0

 English
 Arabic
 Chinese (Simplified)
 Dutch
Dutch French
 German
 Italian
 Japanese
 Korean
 Portuguese
 Russian
 Spanish