


In the realm of Business Process Model and Notation (BPMN), a process is more than just a sequence of actions. It is a flow of information. To truly understand how a business operates, you must visualize not only who is doing what, but what they are doing with. This tutorial explores the critical concept of Data Objects, using the specific example of an invoice generation process to demonstrate how to model information flow effectively.
Understanding the Anatomy of a Data Object
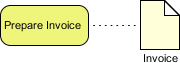
The image provided illustrates a fundamental relationship in BPMN modeling: the interaction between a Process Activity and a Data Object. Let’s break down the visual elements:
- The Process Activity: Represented by the yellow rounded rectangle labeled “Prepare Invoice.” In BPMN, this is a task or a specific step within a larger workflow where work is performed.
- The Data Object: Represented by the document icon (a rectangle with a folded top-right corner) labeled “Invoice.” This symbolizes a specific piece of information, such as a document, a record, or a data structure, that exists within the business context.
- The Association: The dotted line connecting the two represents a logical relationship. It indicates that the “Prepare Invoice” task consumes, creates, updates, or utilizes the “Invoice” data object.
When you model this connection, you are telling the story of the data lifecycle. The process doesn’t just exist in a vacuum; it acts upon the data.
Modeling the Data Lifecycle
BPMN is powerful because it supports tracking the state of data objects throughout the execution of a process. When you associate a data object with a task, you are implicitly defining the state transition of that data. As noted in industry standards, data states typically include:
- Created: The data object comes into existence (e.g., a draft invoice is generated).
- Updated: The data object is modified (e.g., quantities or prices are adjusted).
- Archived: The data object is finalized and stored for record-keeping.
In our example, the “Prepare Invoice” task likely triggers the creation of the invoice data object or updates its status from “Draft” to “Ready to Send.” This level of detail is essential for auditability and compliance, as it provides a clear trail of how business records are handled.
Implementation with Visual Paradigm
To implement these concepts in a professional modeling environment, we utilize specific tooling. Visual Paradigm offers a robust suite of features for BPMN modeling that allows users to define these relationships intuitively.
Using Visual Paradigm, you can create a Data Object by selecting the Data Object shape from the palette and placing it next to your task. You then use the Association tool to draw the connecting line. Visual Paradigm allows you to further refine this model by specifying the data type or linking it to an underlying data structure definition, ensuring that the “Invoice” object is not just a graphic, but a defined entity within your system architecture.
Why This Matters for System Architecture
For technical architects and business analysts, visualizing the “Prepare Invoice” task and its associated “Invoice” object is a crucial step in bridging the gap between business requirements and system design. It answers critical questions:
- What data is required? Before the task can start, the system must provide the customer details and line items.
- What data is produced? After the task completes, the system must store the generated invoice.
- Where does the data live? This association helps identify which database tables or external systems need to be integrated.
By mastering these visual cues, you ensure that your process models are not just diagrams, but functional specifications that drive system architecture.

 English
 Arabic
 Chinese (Simplified)
 Dutch
Dutch French
 German
 Italian
 Japanese
 Korean
 Portuguese
 Russian
 Spanish