


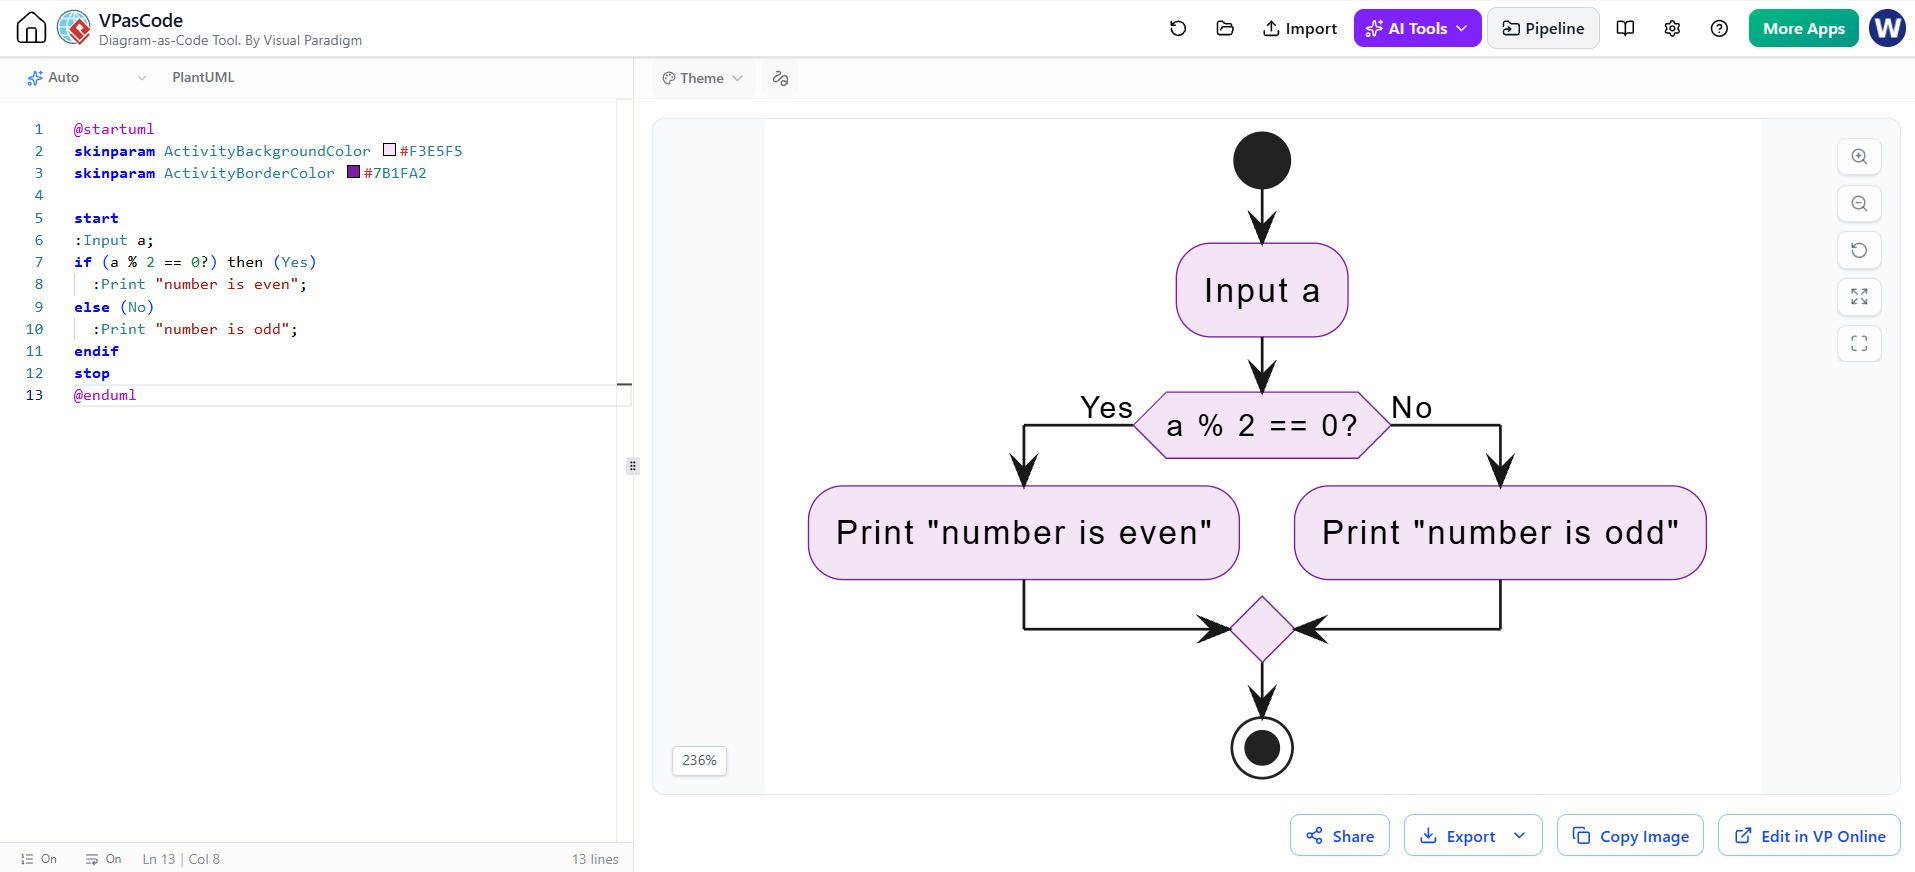
In the world of software engineering, translating abstract algorithmic logic into visual representations is a critical skill. Whether you are designing a simple homework assignment or architecting a complex banking transaction system, the ability to visualize flow is paramount. Today, we will explore a classic introductory programming concept—determining if a number is odd or even—and see how it is elegantly modeled using VPasCode and PlantUML within the Visual Paradigm environment.
This tutorial moves beyond simple code snippets. We will focus on the system modeling aspect, examining how control flow, conditional branching, and visual styling parameters (skinparams) work together to create a coherent and readable activity diagram.
Understanding the Core Algorithm
Before diving into the diagram syntax, we must understand the underlying logic. The algorithm relies on the concept of modular arithmetic. The “modulo” operator (denoted by the % symbol) calculates the remainder of a division.
- The Input: We start with an integer variable, let’s call it
a. - The Condition: We check if
ais divisible by 2. Mathematically, this isa % 2 == 0. - The Branching:
- If the result is 0, the number is Even.
- If the result is non-zero (usually 1), the number is Odd.
Visualizing Logic with PlantUML
Visual Paradigm’s VPasCode tool allows you to write code that automatically renders into a visual diagram. This “Diagram-as-Code” approach ensures that your documentation stays in sync with your logic.
Here is the raw PlantUML code used to generate the logic flow for this specific example:
@startuml
skinparam ActivityBackgroundColor #F3E5F5
skinparam ActivityBorderColor #7B1FA2

start
:Input a;
if (a % 2 == 0?) then (Yes)
  :Print "number is even";
else (No)
  :Print "number is odd";
endif
stop
@enduml
Breaking Down the Syntax
The code above is deceptively simple. Let’s dissect the key components that drive the visual output:
- Global Styling (Skinparams):
The first two lines,
@startumlandskinparam, set the theme for the entire diagram.ActivityBackgroundColor #F3E5F5: This defines a soft, light purple background for all process nodes, providing a modern, clean aesthetic.ActivityBorderColor #7B1FA2: This sets a deep purple border, creating a high-contrast, professional look that distinguishes the process steps from the background.
- Control Flow (Start/Stop):
The
startandstopkeywords are the anchors of your diagram. In PlantUML, these correspond to the solid black circle (start) and the black circle with a white ring (stop) seen in the rendered view. - Conditional Logic (If/Else):
The
if (a % 2 == 0?)statement is the engine of the diagram. It creates a decision diamond. The keywordsthen (Yes)andelse (No)explicitly define the paths the flow takes based on the boolean result. Note that the?is a PlantUML convention often used to denote a decision point within the condition string.
From Code to Canvas: The Rendering Process
When you execute this code in Visual Paradigm, the engine interprets the linear text and transforms it into a spatial graph:
- Input Node: The
:Input a;line becomes a rounded rectangle activity node. It represents the entry point for data into the system. - Decision Node: The
ifstatement triggers the creation of a diamond shape. This is the critical junction where the system’s path diverges. The labela % 2 == 0?is the condition evaluated here. - Action Nodes: The lines following
thenandelsebecome the leaf nodes of the tree.- The “Yes” branch leads to
:Print "number is even";. - The “No” branch leads to
:Print "number is odd";.
- The “Yes” branch leads to
- Merge Point: Although not explicitly coded as a merge command, PlantUML automatically recognizes that the two branches of an
if/elseblock must eventually converge before thestopcommand. This creates a merge diamond (a diamond with multiple inputs and one output) at the bottom of the diagram.
Best Practices for Flowchart Modeling
As you progress from simple examples like this to complex system architectures, keep these modeling principles in mind:
- Single Entry, Single Exit: Ensure your activity diagrams follow structured programming principles. Every loop and decision should ideally have one entry and one exit point to maintain readability.
- Descriptive Labels: While code is compact, diagrams should be self-explanatory. Use clear labels for decision nodes (e.g., “a % 2 == 0?”) rather than vague references.
- Consistent Theming: Use
skinparamearly in your code to define a corporate or project standard style. Changing the colors in the code updates every single node in the diagram instantly.
Conclusion
This example demonstrates that even the simplest algorithms benefit from formal modeling. By using VPasCode, you bridge the gap between the logic of the code and the visual communication of the diagram. You aren’t just writing “if-else” statements; you are architecting a flow of data that can be understood by stakeholders, developers, and testers alike.

 English
 Arabic
 Chinese (Simplified)
 Dutch
 French
 German
 Italian
 Japanese
 Korean
 Portuguese
 Russian
 Spanish