


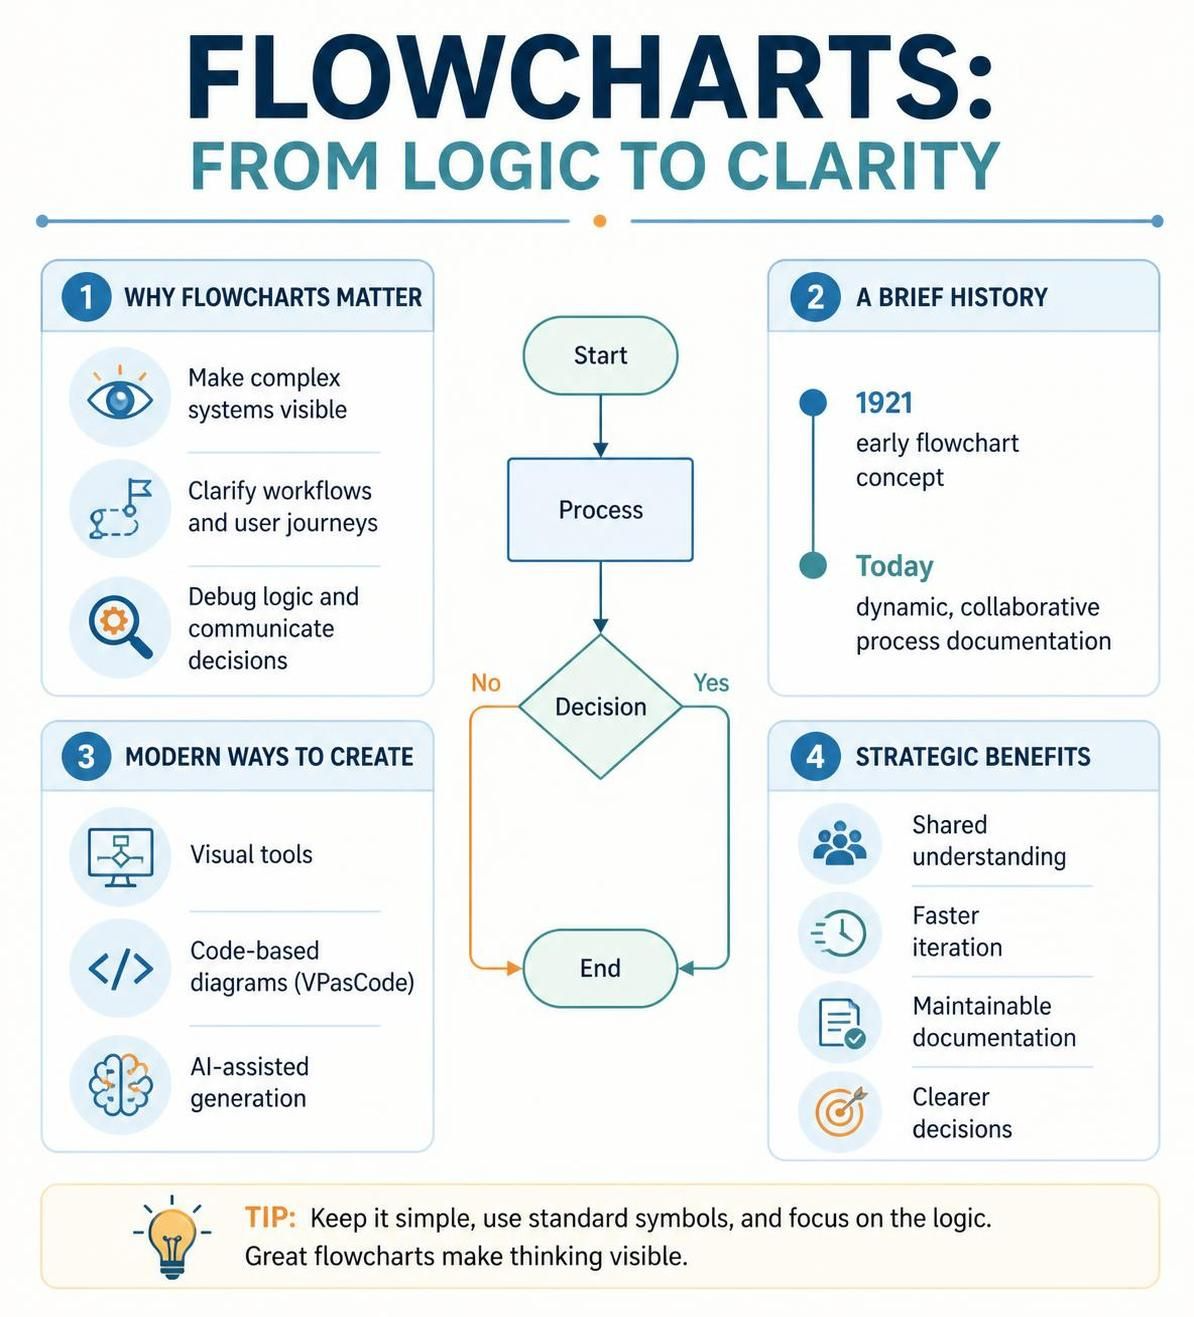
In an era defined by complex systems, agile workflows, and rapid digital transformation, clarity is the ultimate currency. Whether you are a product manager mapping out a user journey, a developer debugging an algorithm, or an engineer designing a system architecture, the ability to visualize logic is indispensable. Enter the flowchart: a timeless yet evolving tool that transforms abstract processes into clear, actionable visual maps.
While the concept of the flowchart dates back to 1921, its application has never been more critical. Today, we are not just drawing boxes and arrows; we are leveraging AI-driven generation and code-based diagramming to create dynamic, maintainable, and collaborative process documentation. This guide explores the fundamentals of flowcharts, their strategic benefits, and how modern tools like Visual Paradigm, VPasCode, and Generative AI are revolutionizing how we design and document workflows.
1. Why Flowcharts Matter: The Pillars of Clarity
At their core, flowcharts serve as the universal language of logic. They bridge the gap between abstract thinking and concrete implementation. Their value lies in three primary areas:
- Make Complex Systems Visible: Large-scale software architectures or business processes can be overwhelming. Flowcharts decompose these monoliths into manageable, sequential steps, allowing stakeholders to see the “forest” without getting lost in the “trees.”
- Clarify Workflows and User Journeys: For product managers, visualizing the path a user takes through an application is vital for identifying friction points and optimizing the experience.
- Debug Logic and Communicate Decisions: Before writing a single line of code, a flowchart acts as a blueprint. It exposes logical fallacies and edge cases (like infinite loops or missing conditions) early in the design phase, saving significant development time.
2. A Brief History: From 1921 to the AI Era
The evolution of the flowchart is a testament to the enduring need for structured communication.
The Early Concept (1921)
The roots of flowcharting trace back to the early 20th century, with the concept formally introduced around 1921. Back then, they were primarily used in manufacturing and engineering to document mechanical processes. The symbols were rigid, and the tools were physical—pens on paper.
Today: Dynamic and Collaborative
Fast forward to the present day, and the flowchart has undergone a radical transformation. We are no longer bound by static paper. Modern flowcharts are:
- Dynamic: They can be updated instantly and reflect real-time data.
- Collaborative: Teams across the globe can edit and view the diagram simultaneously.
- Code-Integrated: Tools like VPasCode allow developers to write logic in code that compiles directly into diagrams, ensuring the documentation is never out of sync with the code.
3. Modern Ways to Create: Visual vs. Code-Based
The infographic highlights three distinct approaches to creating flowcharts today. Understanding the difference is key to choosing the right tool for the job.
A. Visual Tools
Traditional drag-and-drop interfaces (like the basic Visual Paradigm interface) are excellent for brainstorming. They offer a low barrier to entry and allow non-technical stakeholders to contribute to the design process intuitively.
B. Code-Based Diagrams (VPasCode)
For developers, “drawing” diagrams can be a distraction from the actual code. This is where VPasCode shines. By using a syntax-based approach (similar to writing Markdown or LaTeX), developers can define the logic in text, and the tool renders the visual map. This approach ensures version control compatibility and keeps documentation in the same repository as the source code.
C. AI-Assisted Generation
The newest frontier is Generative AI. You can now provide a prompt or a snippet of code, and AI models can generate a complete flowchart structure, suggesting standard symbols and logical connectors automatically. This reduces the manual effort of drawing lines and shapes, allowing you to focus purely on the system’s logic.
4. Strategic Benefits: The ROI of Visualization
Why invest time in modeling? The return on investment (ROI) is tangible:
- Shared Understanding: A visual flowchart eliminates ambiguity. When a developer and a stakeholder look at the same “Decision” diamond, they are looking at the same problem.
- Faster Iteration: Changing a visual flow is often faster than refactoring code. It allows for “what-if” scenarios to be tested quickly.
- Maintainable Documentation: As processes evolve, the documentation must evolve with them. Modern tools ensure that your diagrams are living documents, not static artifacts left behind after a project launch.
- Clearer Decisions: Visualizing the “Yes” and “No” paths forces you to think through edge cases, leading to more robust system designs.
Conclusion: Keep it Simple
As the infographic suggests, the best flowcharts are those that make thinking visible without overwhelming the viewer. Whether you are using a drag-and-drop tool or coding your diagrams with VPasCode, the golden rule remains: Use standard symbols, focus on the logic, and keep it simple.

 English
 Arabic
 Chinese (Simplified)
 Dutch
 French
 German
 Italian
 Japanese
 Korean
 Portuguese
 Russian
 Spanish