


Introduction
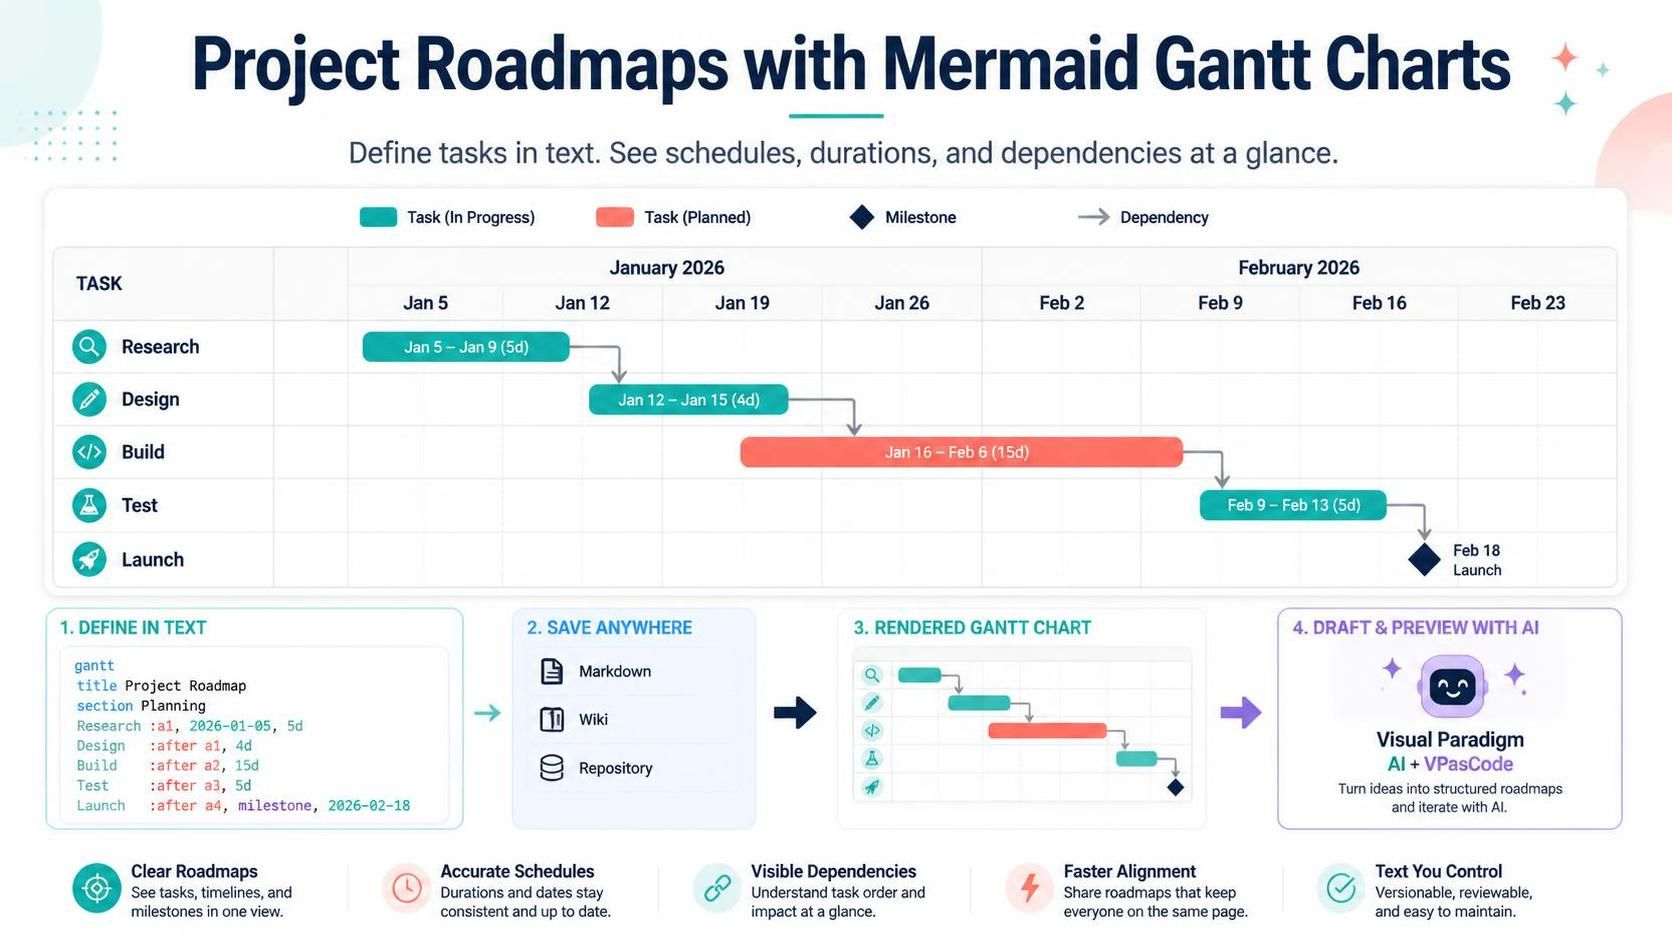
In the fast-paced world of project management, clarity is king. Whether you’re coordinating a cloud migration, launching a new product feature, or managing infrastructure updates, stakeholders need to understand not just what needs to be done, but when and in what order. Enter the Gantt Chart—a timeless visualization tool that maps project schedules, task durations, and dependencies along a horizontal timeline.
While traditional Gantt charts require specialized software, Mermaid.js brings this powerful visualization into your documentation workflow. By using a declarative, text-based syntax, you can generate professional project roadmaps directly inside Markdown files, wikis, or code repositories. This guide will walk you through the core syntax, best practices, and real-world examples to help you create dynamic, maintainable Gantt charts using Visual Paradigm AI and the VPasCode Tool.
What is a Gantt Chart?
A Gantt Chart is a project management visualization tool used to map project schedules, task durations, and critical path milestones along a horizontal timeline. By representing work packages as bars and structural dependencies as sequential flows, it allows teams to track progress, identify potential bottlenecks, and communicate deadlines effectively.
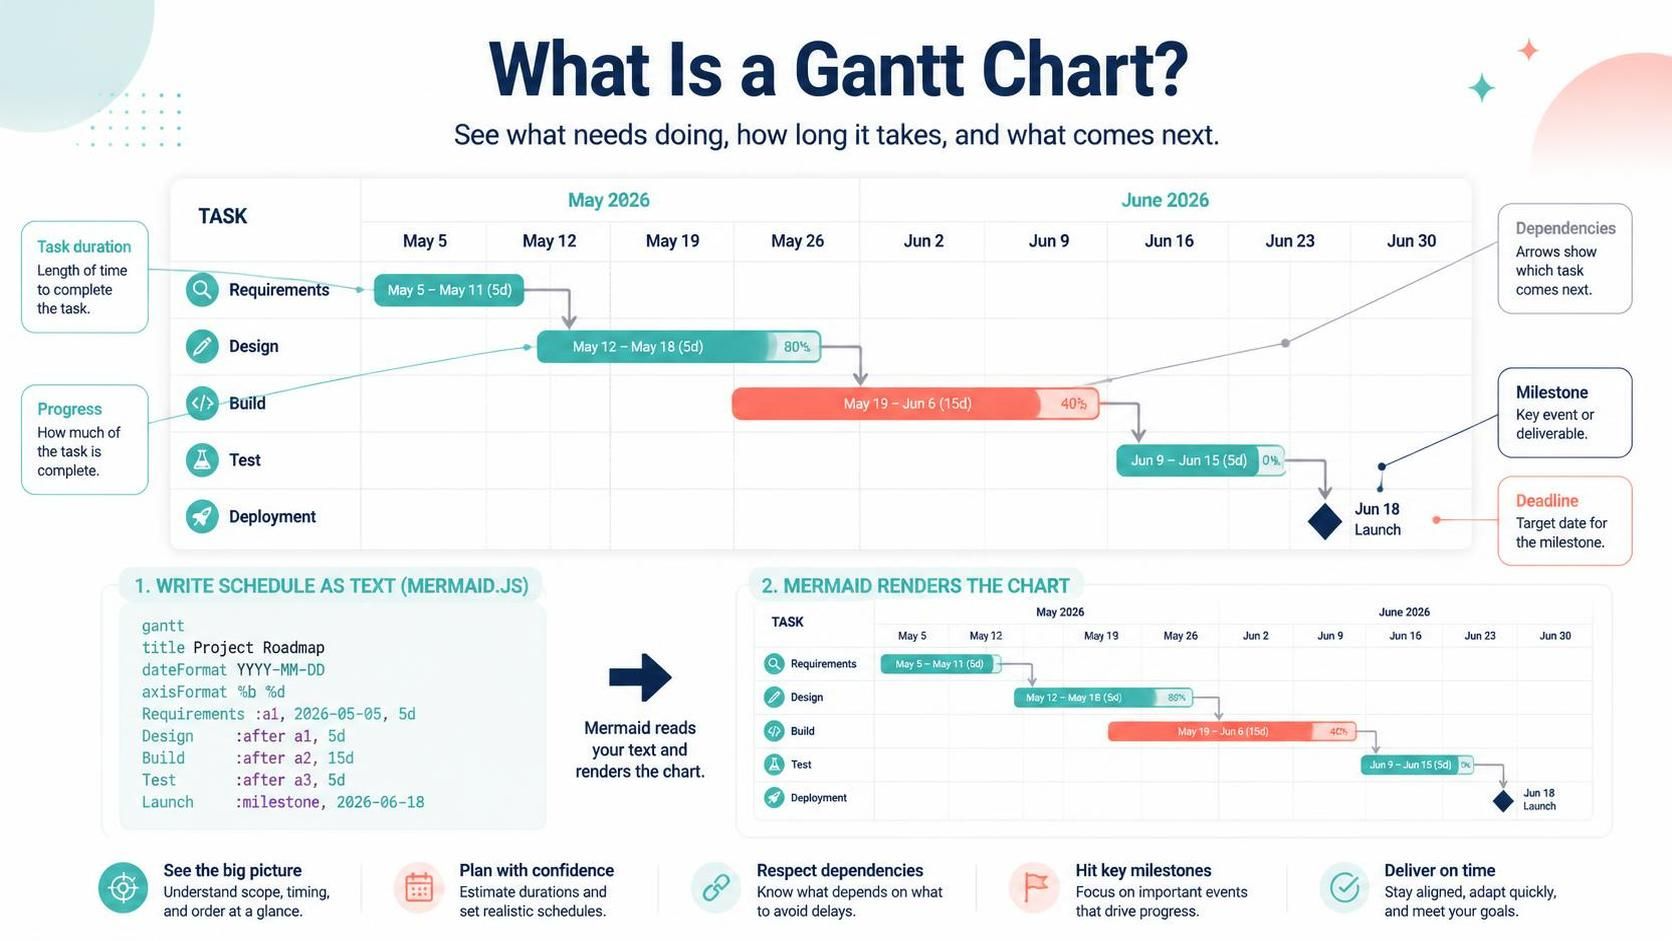
With Mermaid.js, you define your project schedule using simple text commands. The engine automatically calculates relative bar offsets, handles date-based grid axis scaling, and renders completion percentages. This means you can generate professional project roadmaps directly inside your documentation without leaving your editor.
Core Syntax Guide: Elements and Constructs
To design a valid, fully runnable project schedule in Mermaid, you must master four key components: timeline configuration, task declarations, section grouping, and milestone markers.
1. Initializing the Gantt Timeline
Every Gantt chart begins with the gantt keyword. You must define a title, a date format, and optionally, an axis format and exclusion rules.
gantt
    title Project Alpha Schedule
    dateFormat YYYY-MM-DD
    axisFormat %Y-%m-%d
    excludes weekends
-
title: Sets the header for your chart. -
dateFormat: Defines how dates are parsed (e.g.,YYYY-MM-DD). -
axisFormat: Controls how dates appear on the horizontal axis (uses strftime syntax). -
excludes: Optional directive to skip non-working days likeweekendsor specific holidays.
2. Defining Tasks and Durations
Tasks are the building blocks of your Gantt chart. Each task requires a display label, an internal ID (for referencing), and a duration or date range. You can also assign a status to visually distinguish progress.
-
done: Completed work package (grayed out). -
active: Current, in-progress work (highlighted). -
crit: Critical path task (renders in a distinct highlight color, usually red).
gantt
    section Planning
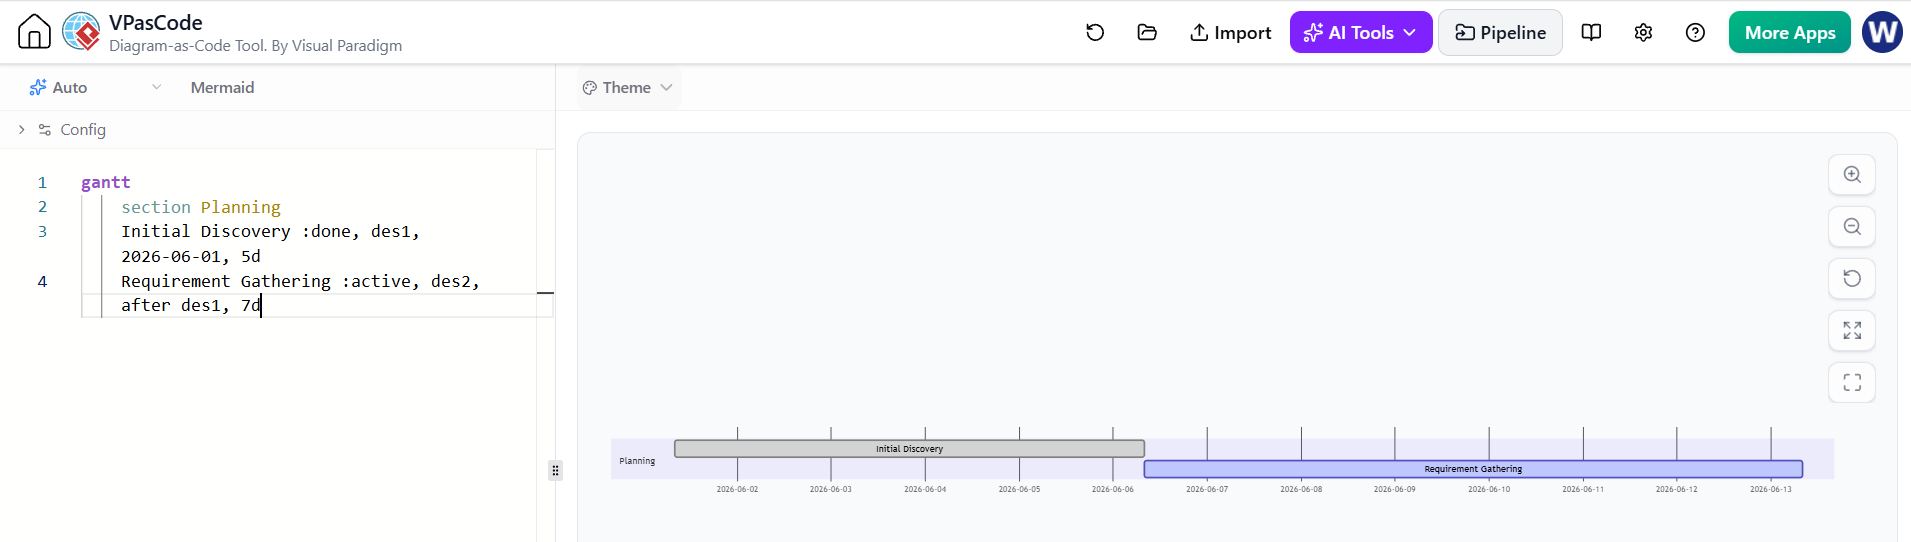
    Initial Discovery :done, des1, 2026-06-01, 5d
    Requirement Gathering :active, des2, after des1, 7d
Syntax Breakdown:
-
des1anddes2are unique IDs. -
after des1creates a dependency, ensuring “Requirement Gathering” starts only after “Initial Discovery” finishes. -
5dand7dspecify durations in days.
3. Implementing Milestones and Dependencies
Milestones are zero-duration points that mark significant project achievements, such as a launch or approval gate. Dependencies are established using task IDs, ensuring visual alignment when predecessors finish.
gantt
    section Release
    Beta Launch :milestone, m1, 2026-07-15, 0d
    Final QA :crit, qa1, after m1, 10d
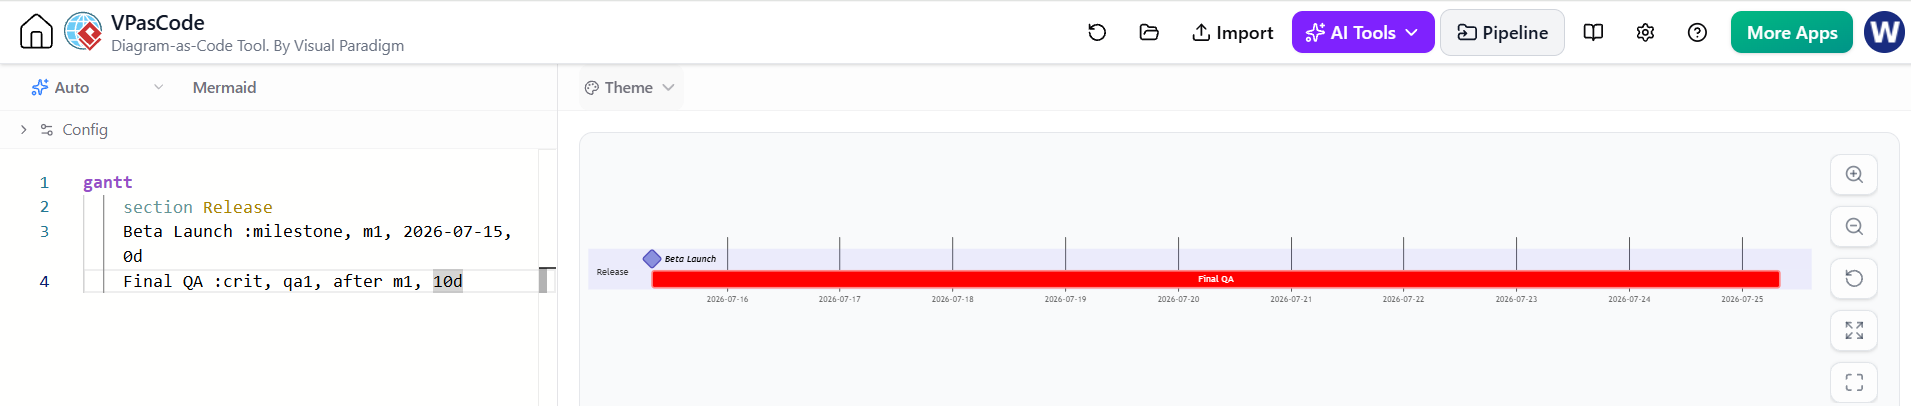
Key Concept: Notice the 0d duration for the milestone. This creates a diamond-shaped marker instead of a bar, clearly indicating a point in time rather than a period of work.
Best Practices for Project Schedules
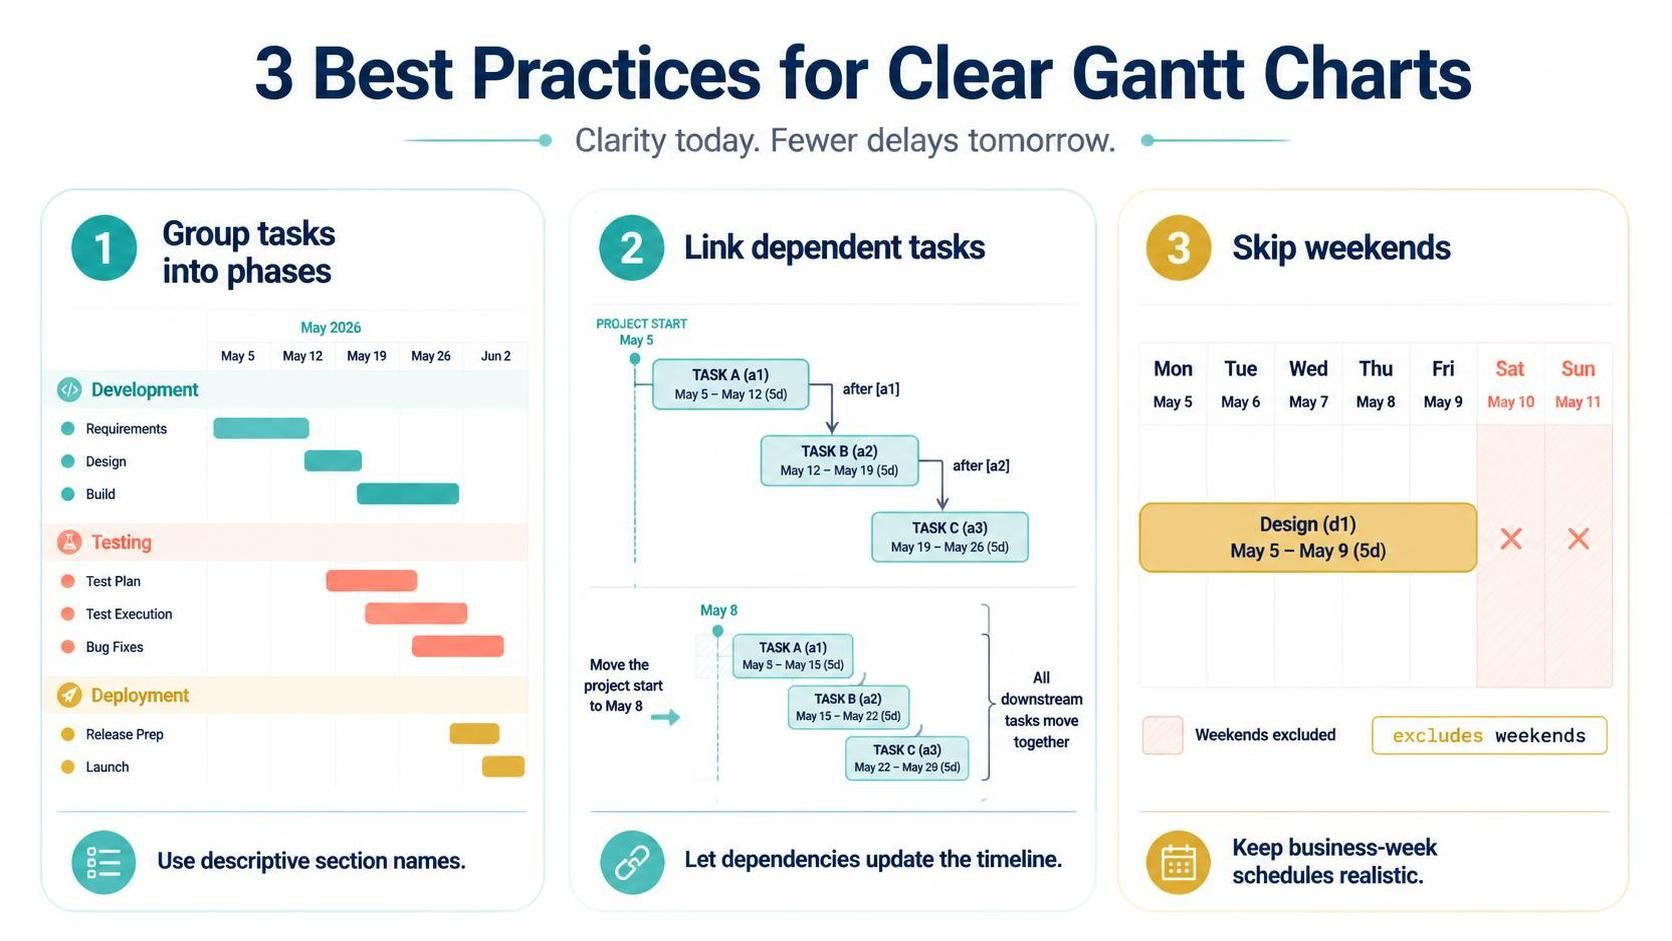
Creating effective Gantt charts goes beyond syntax; it’s about communication. Here are three best practices to keep your charts clean and actionable:
-
Use Descriptive Section Names: Use the
sectionkeyword to group tasks into logical phases (e.g., Development, Testing, Deployment). This creates a vertically segmented grid that is much easier to read than a single long list. -
Leverage the ‘after’ Keyword: Instead of manually calculating start dates, use
after [task_id]. This ensures that if the project start date shifts, your entire timeline updates automatically without manual editing. -
Exclude Non-Working Days: If your project follows a standard business week, include the
excludes weekendsdirective. This keeps your timeline realistic and prevents unrealistic “weekend” work predictions.
Real-World Mermaid Gantt Chart Examples
Example 1: Software Infrastructure Migration Roadmap
This functional blueprint models a multi-stage cloud migration project, utilizing sections to divide architecture planning from implementation and testing.
gantt
    title Cloud Infrastructure Migration Roadmap
    dateFormat YYYY-MM-DD
    axisFormat %m-%d
    excludes weekends

    section Architecture
    Cloud Design   :done, a1, 2026-06-01, 10d
    Security Audit :active, a2, after a1, 5d

    section Migration
    Data Transfer  :crit, m1, after a2, 15d
    App Re-deploy  :m2, after m1, 8d

    section Milestones
    Production Go-Live :milestone, m3, after m2, 0d
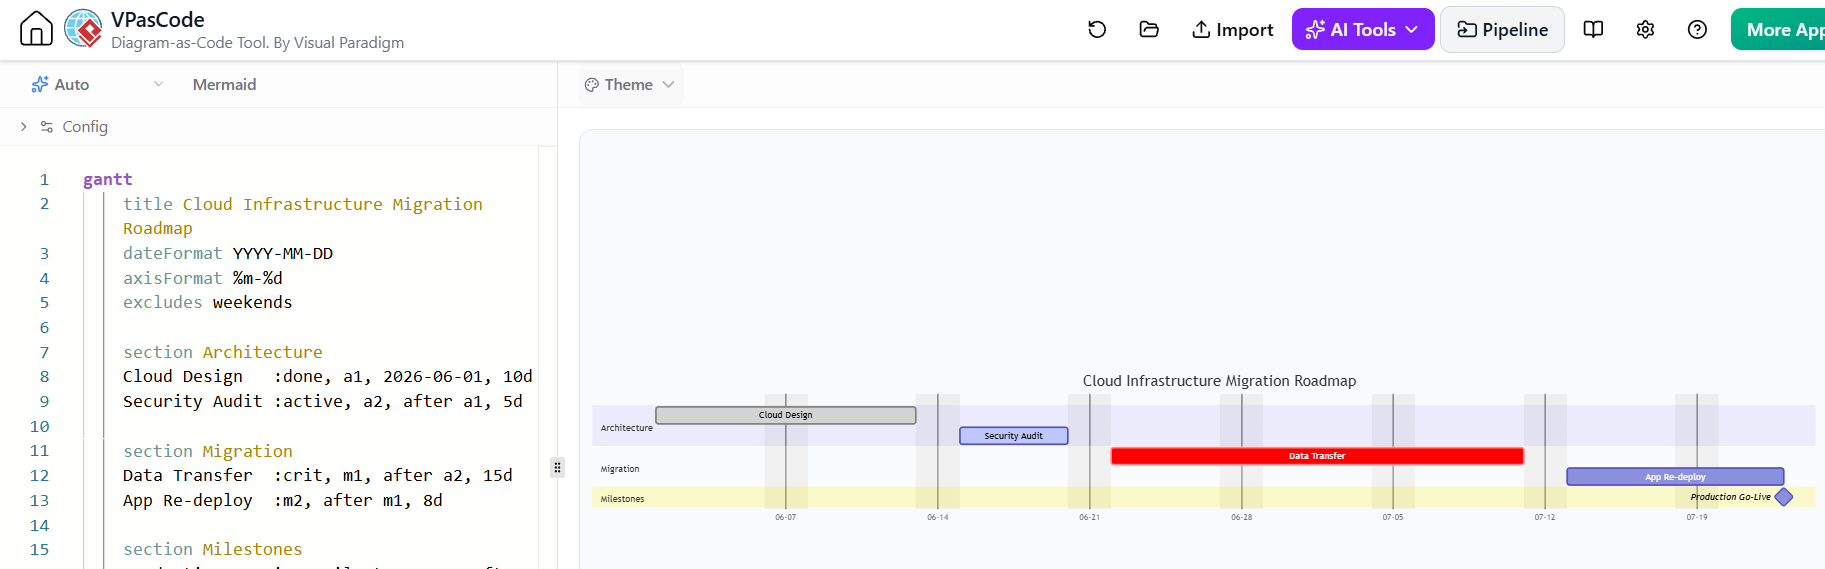
Syntax Breakdown: This chart clearly separates planning, execution, and project milestones. By tagging the Data Transfer task as crit, it receives a distinct highlight, drawing the viewer’s attention to the most high-risk phase of the migration.
Tooling: Visual Paradigm AI + VPasCode Tool
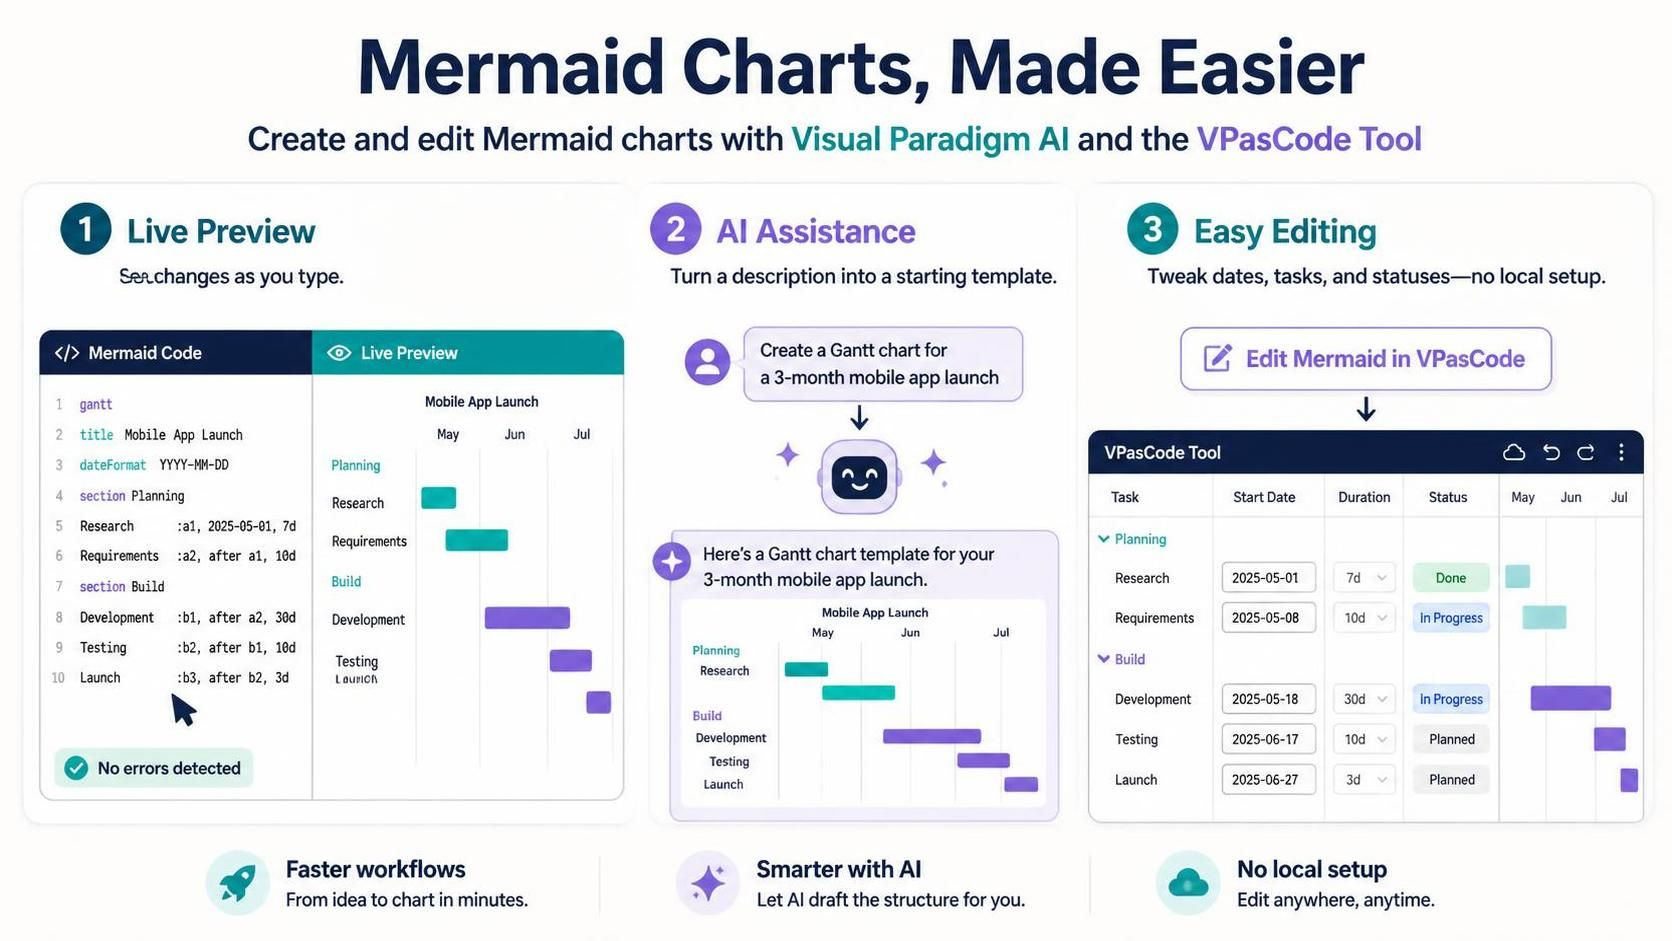
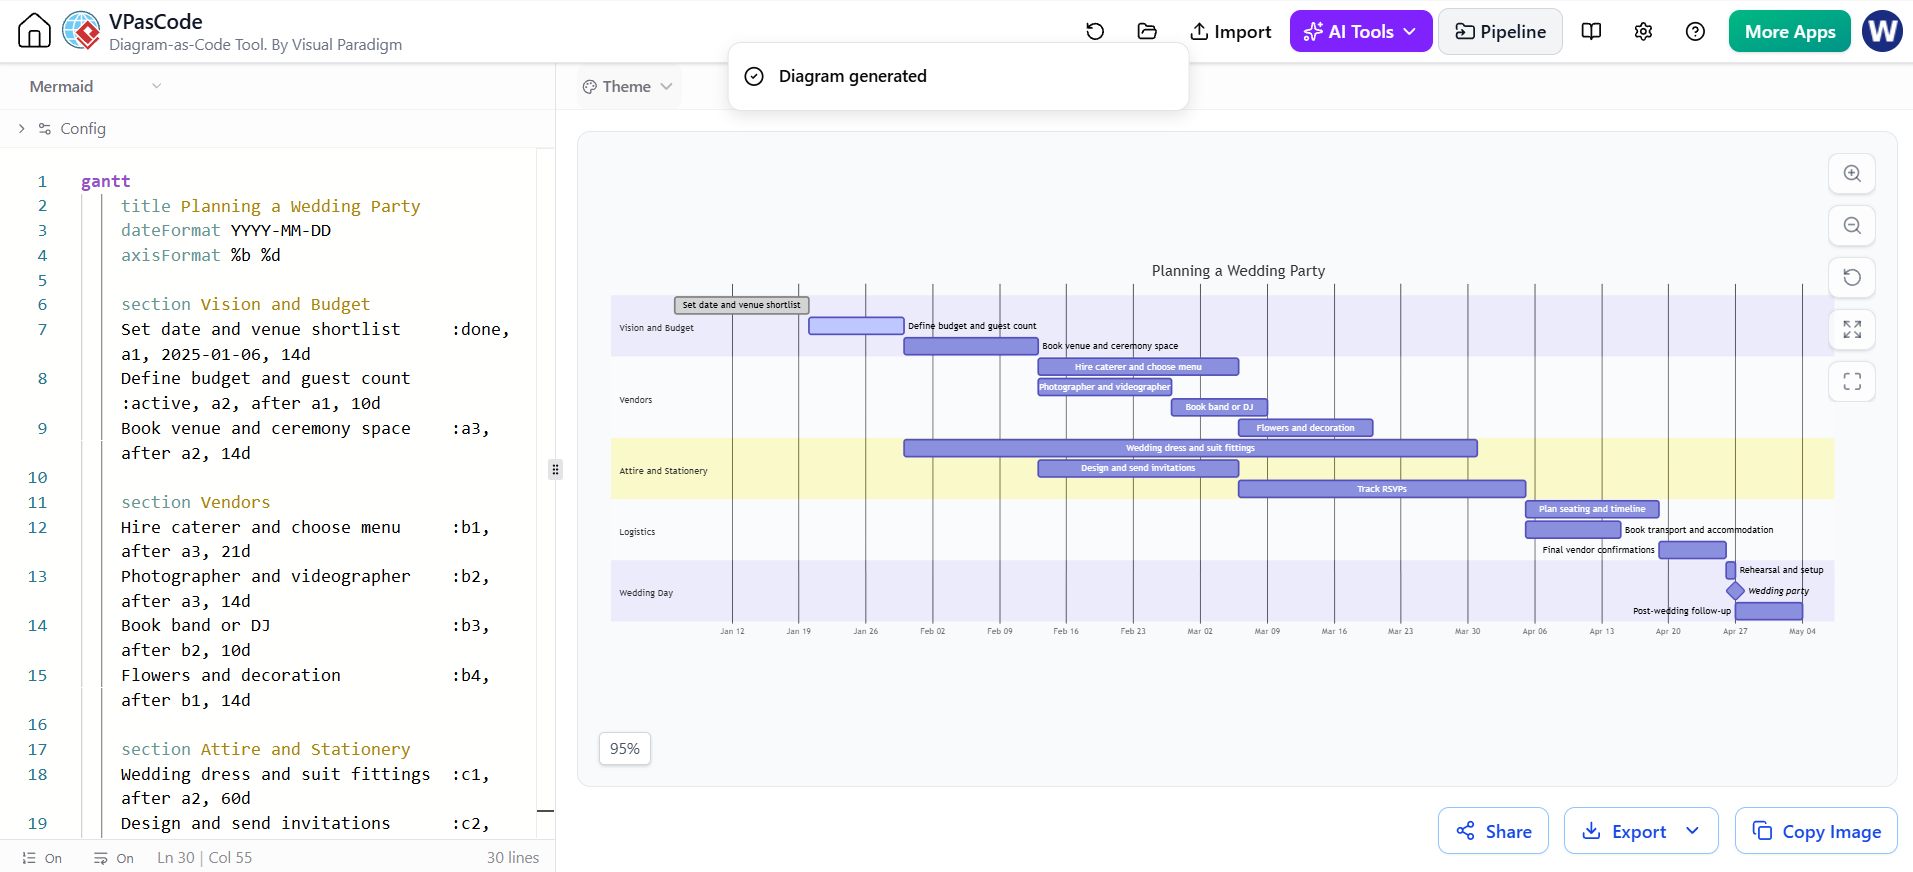
While Mermaid syntax is powerful, visualizing and debugging complex charts can be challenging in plain text. This is where Visual Paradigm AI and the VPasCode Tool shine.
-
Live Preview: VPasCode provides an instant visual feedback loop. As you type your Mermaid code, the chart renders in real-time, allowing you to catch syntax errors immediately.
-
AI Assistance: Visual Paradigm AI can help generate initial chart structures based on natural language descriptions. For example, you can ask it to “Create a Gantt chart for a 3-month mobile app launch,” and it will provide a solid starting template.
-
Easy Editing: The linked “Edit Mermaid in VPasCode” buttons in the examples above allow you to jump directly into an interactive editor to tweak dates, add tasks, or change statuses without setting up a local environment.
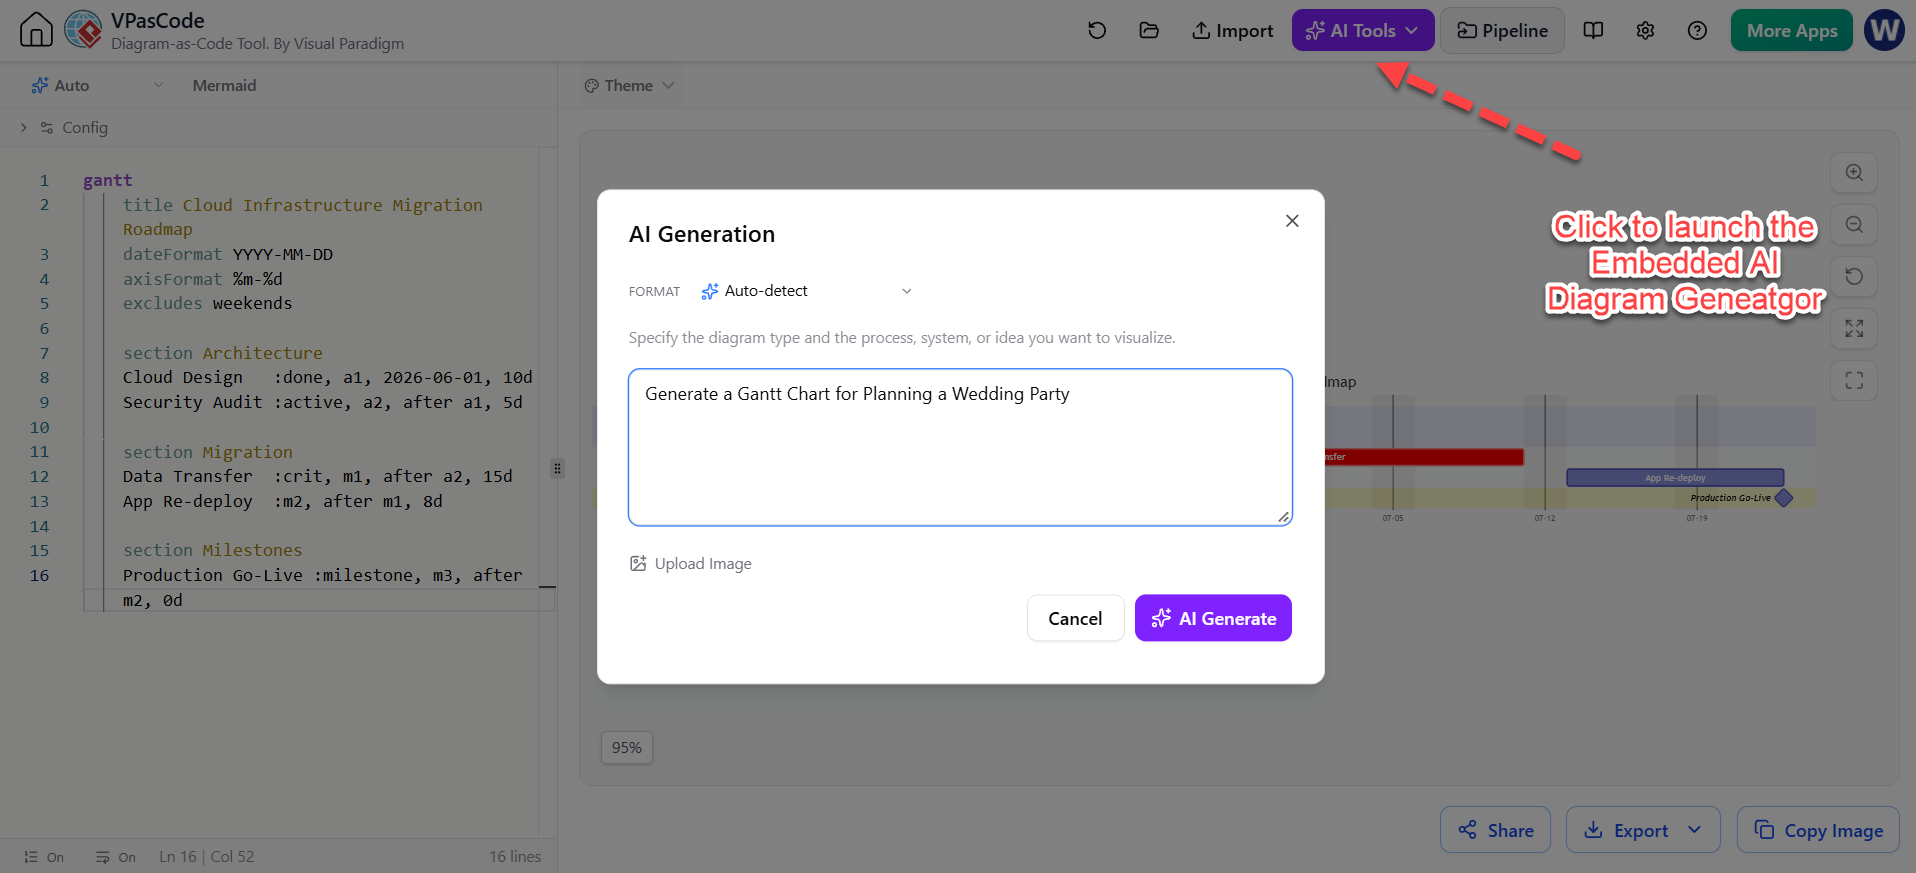
Mermaid – Gantt Chart as Code Example using Embedded AI Assisted Feature
Conclusion
Mermaid.js Gantt charts offer a lightweight, version-control-friendly way to manage project timelines. By mastering the core syntax—initializing timelines, defining tasks with statuses, using sections for organization, and leveraging dependencies—you can create clear, professional roadmaps that keep your team aligned.
Whether you’re documenting a simple sprint plan or a complex infrastructure migration, combining Mermaid’s declarative power with tools like VPasCode ensures your project visuals are always up-to-date and easy to maintain. Start mapping your next project today, and turn textual plans into actionable visual insights.

 English
 Arabic
 Chinese (Simplified)
 Dutch
 French
 German
 Italian
 Japanese
 Korean
 Portuguese
 Russian
 Spanish