


1. The Core Distinction in One Sentence
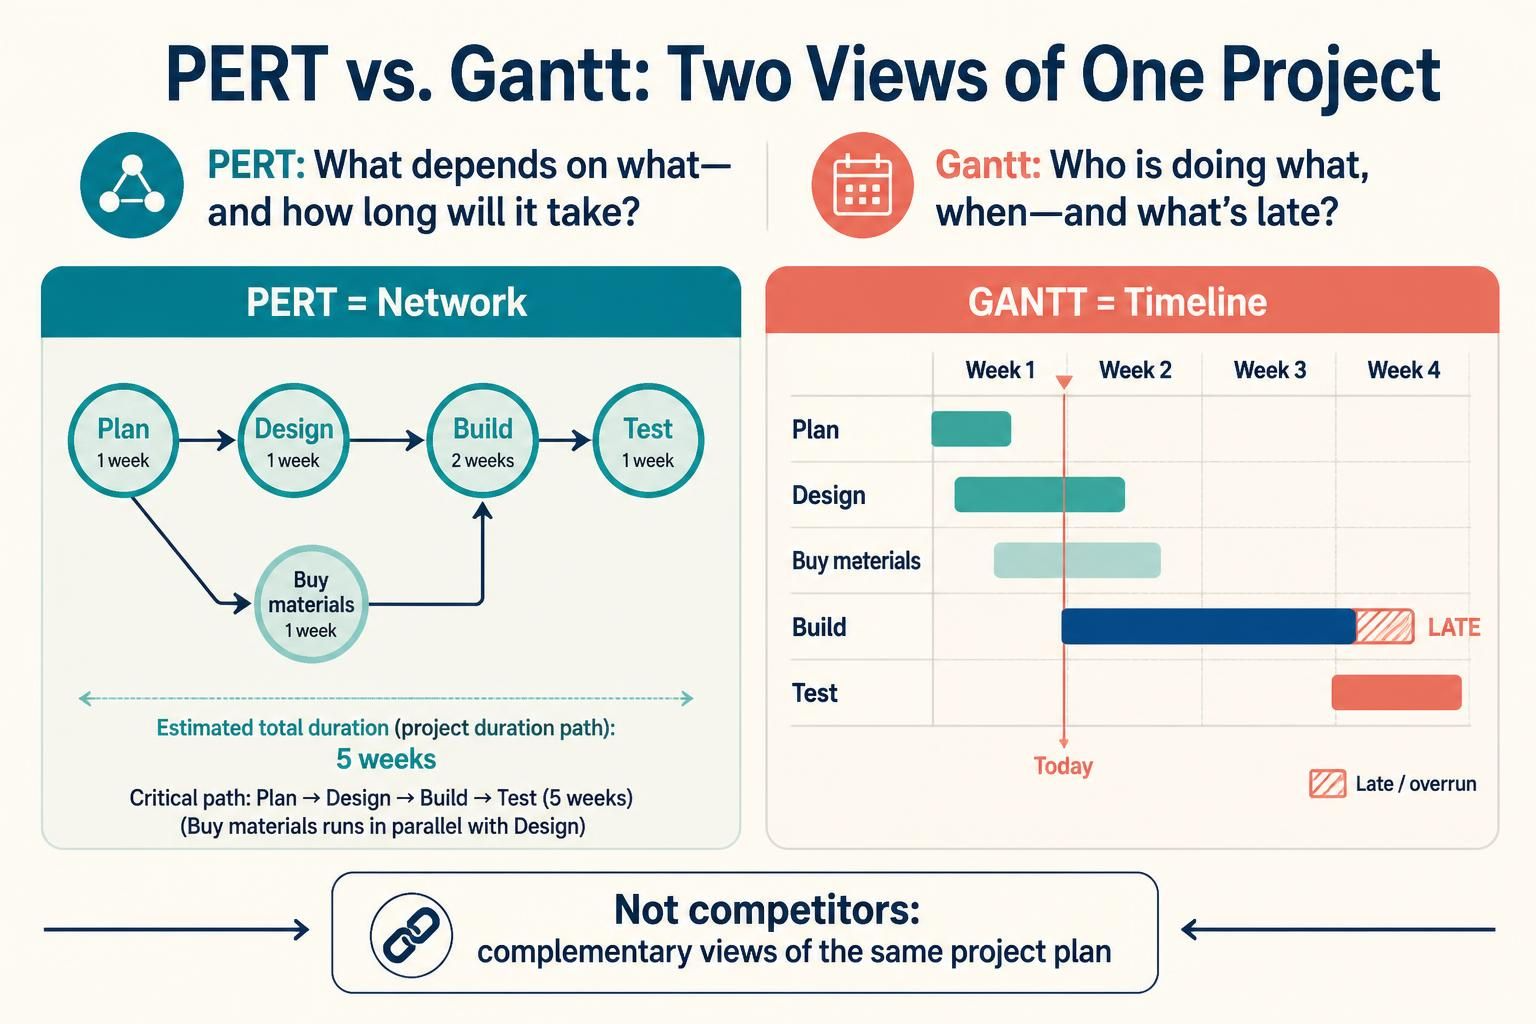
A PERT chart answers “what depends on what, and how long will the whole thing take?” A Gantt chart answers “who is doing what, on which day, and what is late?”
PERT is a network (nodes + arrows), Gantt is a timeline (rows + bars). They are not competitors — they are two views of the same project plan, and mature project teams use both.
2. Defining Both Charts
2.1 PERT (Program Evaluation and Review Technique)
PERT models a project as a directed acyclic graph of tasks and dependencies. Its original purpose (US Navy, Polaris missile program, 1958) was handling uncertainty in durations.
Its signature feature is the three-point estimate applied to each task:

-
$O$ = Optimistic duration
-
$M$ = Most likely duration
-
$P$ = Pessimistic duration
-
$E$ = Expected duration (PERT estimate)
And the standard deviation, used to express risk:
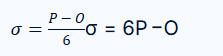
Variance is $\sigma^2$, and along a path the variances add — which is how PERT computes the probability of hitting a deadline.
2.2 Gantt Chart
A Gantt chart is a horizontal bar chart where each row is a task and bar length represents duration on a calendar axis. Introduced by Henry Gantt around 1910–1915.
Core vocabulary:
| Concept | Meaning |
|---|---|
| Bar | Task duration, positioned on a calendar |
| Milestone | Zero-duration diamond marking a date |
| Dependency arrow | Finish-to-Start, Start-to-Start, etc. |
| Baseline bar | The originally approved plan, for comparison |
| % complete fill | Progress on the actual bar |
| Summary row | Rolled-up parent task spanning children |
| Critical path highlight | Red/dark bars on zero-float tasks |
3. Key Concepts Compared
| Concept | PERT Chart | Gantt Chart |
|---|---|---|
| Primary axis | Dependency (network topology) | Time (calendar) |
| Visual form | Node-edge graph | Horizontal bar timeline |
| Duration model | Three-point estimate → expected value | Fixed duration (usually a single number) |
| Uncertainty handling | Native — probability of completion | Optional — contingency buffers, P80/P90 dates |
| Critical path | Central artifact; computed from the network | Displayed, but structurally dependent on PERT/CPM |
| Resource loading | Poor — tasks are non-dimensional | Excellent — rows can be people, teams, machines |
| Progress tracking | Weak — no native progress field | Excellent — % complete, baseline variance |
| Best for | Complex, novel, R&D, high-uncertainty work | Execution, communication, stakeholder reporting |
| Weakness | Unreadable at scale; no calendar sense | Hides dependency risk and uncertainty |
| Audience | Planners, analysts, risk owners | Team, sponsors, clients |
3.1 The Five Numbers Every PERT Node Needs
Forward pass (left to right):
-
ES — Early Start: latest finish of all predecessors
-
EF — Early Finish: $ES + \text{duration}$
-
EF for a node with predecessors = $\max(\text{EF of predecessors})$
Backward pass (right to left):
-
LS — Late Start: $LF – \text{duration}$
-
LF — Late Finish: earliest LS of all successors
Then:

Critical path = the chain of tasks where slack = 0. It is the longest path through the network and therefore the shortest possible project duration. Any delay on the critical path delays the project one-for-one.
3.2 Slack in Plain English
| Slack | Meaning | Manager’s move |
|---|---|---|
| 0 (critical) | Any slip hits the delivery date | Protect it; add resources first here |
| 1–3 days | Near-critical, fragile | Watch daily |
| > 5 days | Genuine buffer | Safe place to absorb delays, or to borrow people from |
The single most valuable insight from PERT: the path that looks longest by task count is often not the critical path. A path of two 20-day tasks beats a path of six 3-day tasks. Gantt charts cannot show you this — only the network can.
3.3 The Critical Chain Caveat
Classic PERT has a known flaw: student syndrome and Parkinson’s law. When every task carries its own padded estimate, people consume the padding, and the project still finishes late. Goldratt’s Critical Chain Method fixes this by stripping task-level padding and pooling it into a project buffer at the end of the chain — visible on a Gantt chart as a single aggregated buffer bar.
3.4 Dependency Types (Both Chart Styles)
| Type | Notation | Example |
|---|---|---|
| Finish-to-Start | FS | Docs finished → code can start |
| Start-to-Start | SS | Testing can start 2 days after coding starts |
| Finish-to-Finish | FF | Documentation finishes no earlier than code |
| Start-to-Finish | SF | Rare; shift handover |
4. Worked Example — Same Project, Both Charts
4.1 Scenario
“Mobile Banking App v2 Launch” — 6 tasks, 1 project.
| Task | Duration (days) | Predecessors |
|---|---|---|
| A — Requirements | 3 | — |
| B — UX Design | 4 | A |
| C — Backend API | 5 | A |
| D — Frontend Build | 6 | B |
| E — Integration Test | 3 | C, D |
| F — Security Audit | 2 | E |
These same durations give you two completely different diagrams: a network view and a calendar view.
4.2 The Network View — PERT Chart
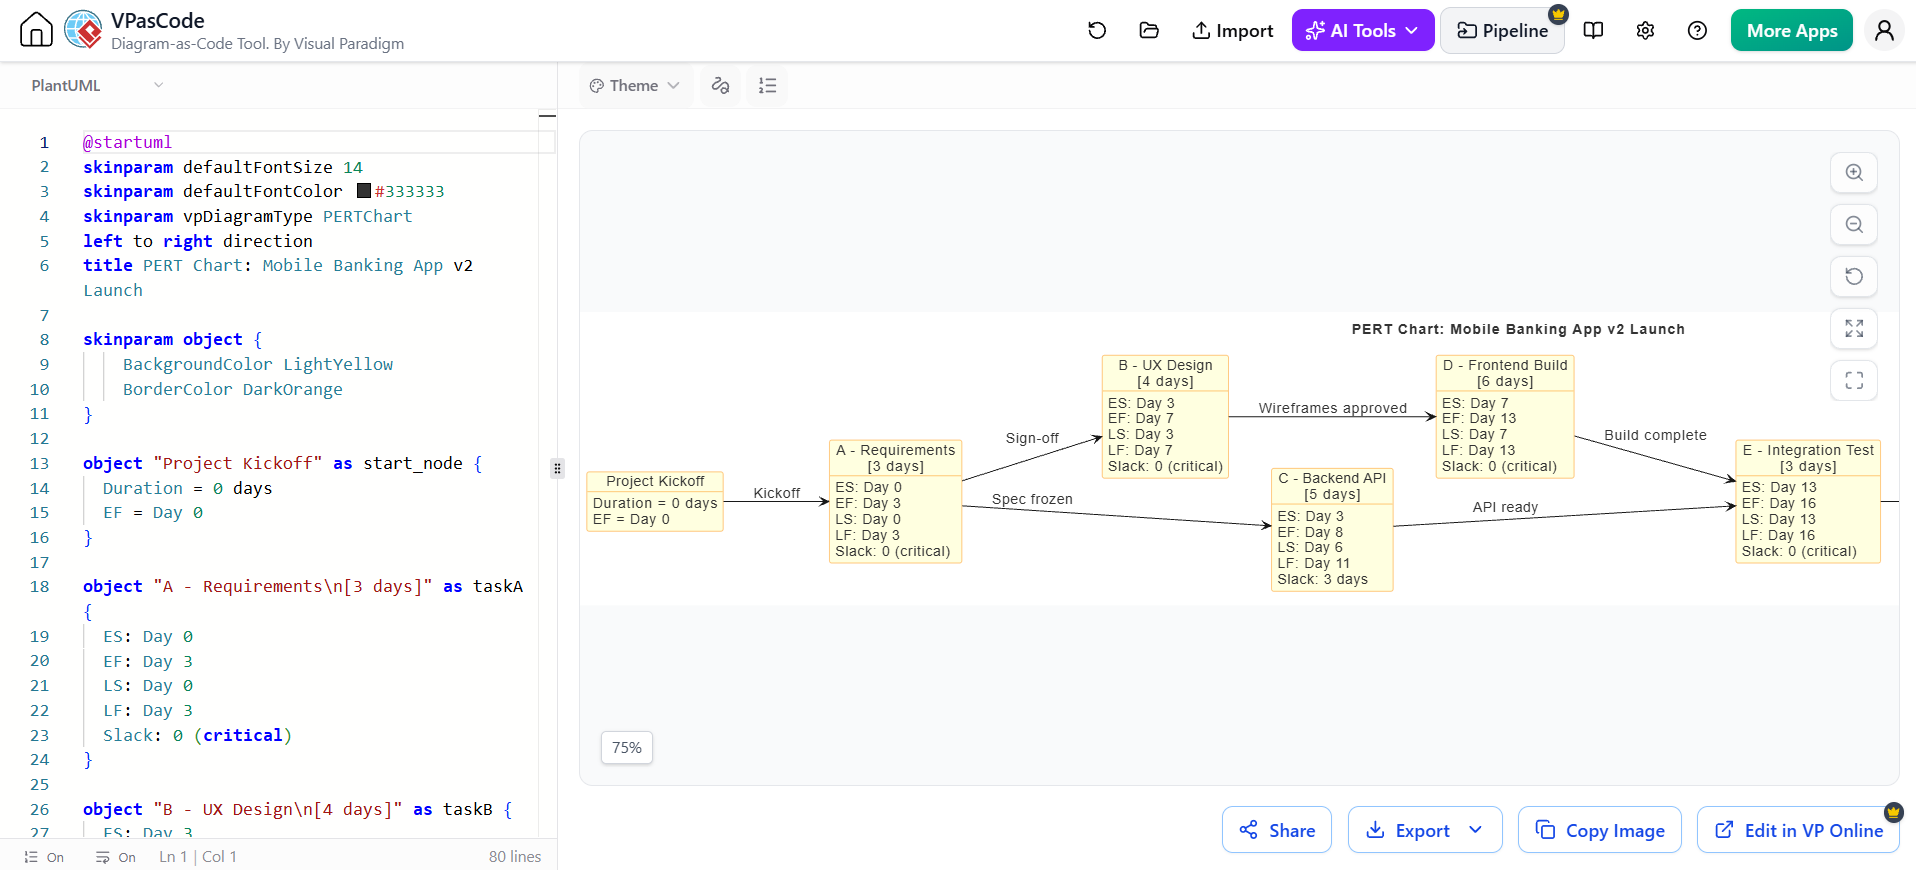
@startuml
skinparam defaultFontSize 14
skinparam defaultFontColor #333333
skinparam vpDiagramType PERTChart
left to right direction
title PERT Chart: Mobile Banking App v2 Launch

skinparam object {
    BackgroundColor LightYellow
    BorderColor DarkOrange
}

object "Project Kickoff" as start_node {
  Duration = 0 days
  EF = Day 0
}

object "A - Requirements\n[3 days]" as taskA {
  ES: Day 0
  EF: Day 3
  LS: Day 0
  LF: Day 3
  Slack: 0 (critical)
}

object "B - UX Design\n[4 days]" as taskB {
  ES: Day 3
  EF: Day 7
  LS: Day 3
  LF: Day 7
  Slack: 0 (critical)
}

object "C - Backend API\n[5 days]" as taskC {
  ES: Day 3
  EF: Day 8
  LS: Day 6
  LF: Day 11
  Slack: 3 days
}

object "D - Frontend Build\n[6 days]" as taskD {
  ES: Day 7
  EF: Day 13
  LS: Day 7
  LF: Day 13
  Slack: 0 (critical)
}

object "E - Integration Test\n[3 days]" as taskE {
  ES: Day 13
  EF: Day 16
  LS: Day 13
  LF: Day 16
  Slack: 0 (critical)
}

object "F - Security Audit\n[2 days]" as taskF {
  ES: Day 16
  EF: Day 18
  LS: Day 16
  LF: Day 18
  Slack: 0 (critical)
}

object "Launch" as end_node {
  Duration = 0 days
  EF = Day 18
}

start_node --> taskA : "Kickoff"
taskA --> taskB : "Sign-off"
taskA --> taskC : "Spec frozen"
taskB --> taskD : "Wireframes approved"
taskC --> taskE : "API ready"
taskD --> taskE : "Build complete"
taskE --> taskF : "Tests passed"
taskF --> end_node : "Audit cleared"
@enduml

Reading it:
-
Critical path: A → B → D → E → F = 18 days. These have zero slack.
-
C has 3 days of slack — it can slip from day 3 to day 6 without delay, because E can’t start until D is done anyway (day 13). C finishes on day 8 and sits idle for 5 days; only its late finish matters.
-
This is the insight a Gantt chart hides. On a bar timeline, C looks like a perfectly healthy task ending day 8. Nothing flags it as the task with the most scheduling freedom in the project.
Pro tip: When a task has slack, ask why. Here, C’s slack is a merge-point artifact — E requires both C and D, so anything not on the critical path automatically inherits float. That float is real, but it evaporates the moment D slips.
4.3 The Calendar View — Gantt Chart
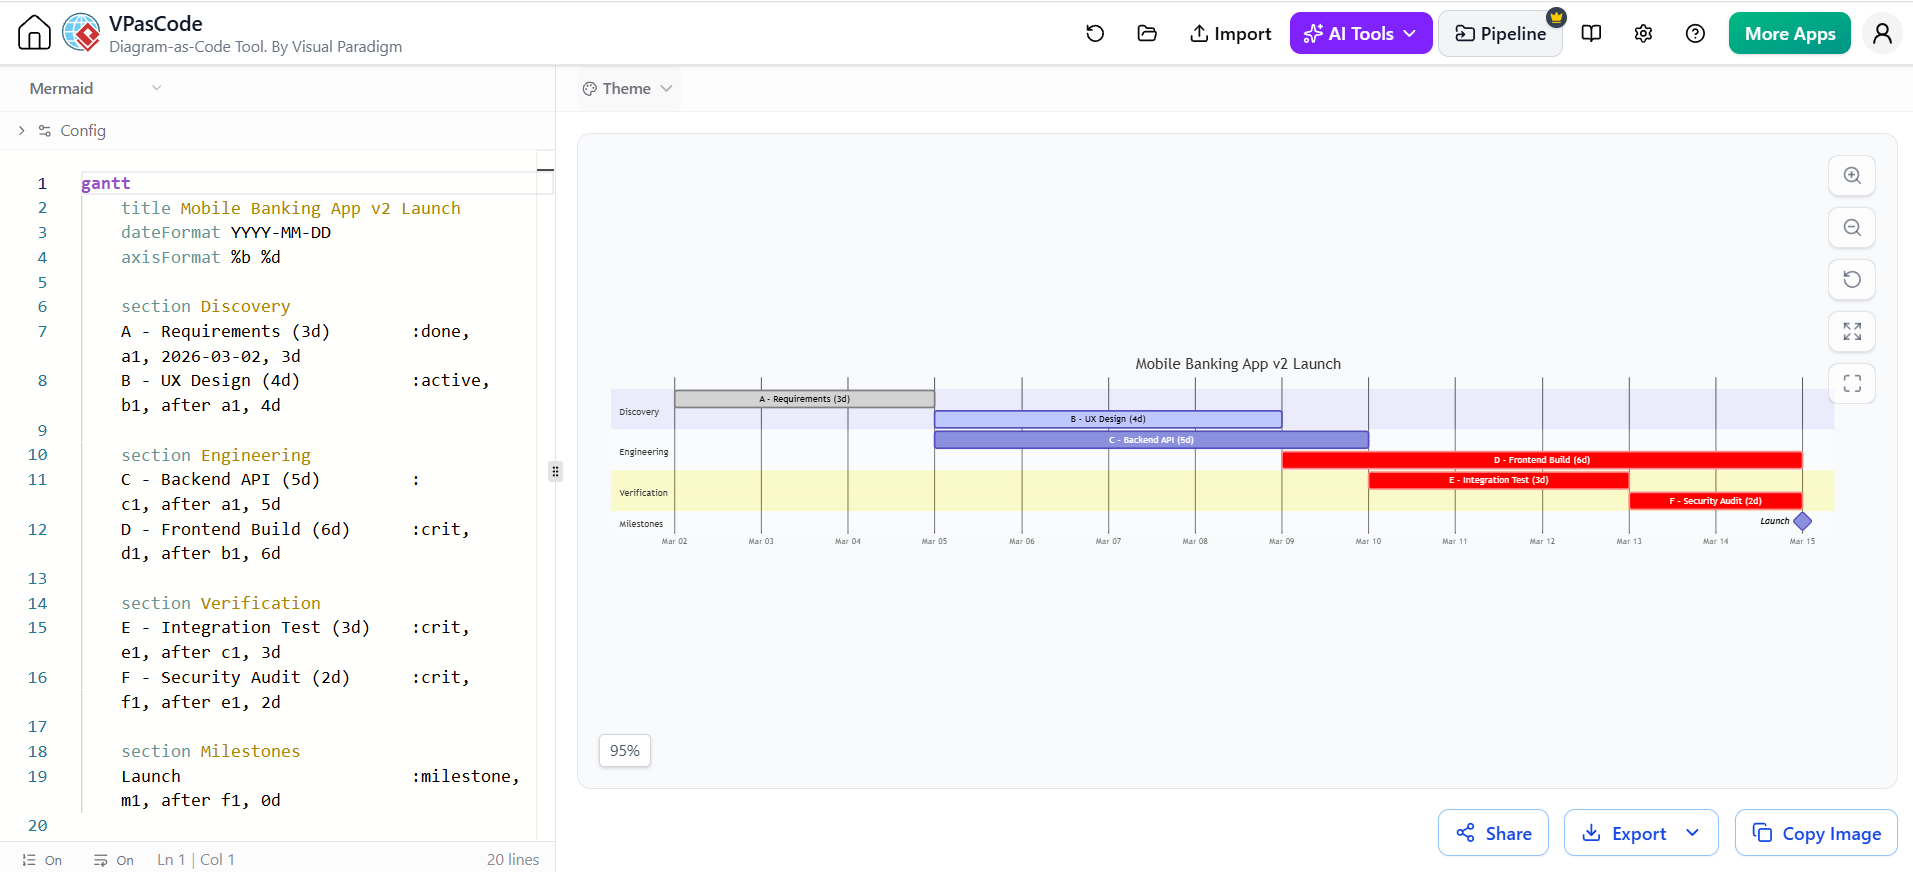
gantt
    title Mobile Banking App v2 Launch
    dateFormat YYYY-MM-DD
    axisFormat %b %d

    section Discovery
    A - Requirements (3d)        :done,    a1, 2026-03-02, 3d
    B - UX Design (4d)           :active,  b1, after a1, 4d

    section Engineering
    C - Backend API (5d)         :         c1, after a1, 5d
    D - Frontend Build (6d)      :crit,    d1, after b1, 6d

    section Verification
    E - Integration Test (3d)    :crit,    e1, after c1, 3d
    F - Security Audit (2d)      :crit,    f1, after e1, 2d

    section Milestones
    Launch                       :milestone, m1, after f1, 0d
Reading it:
-
Dates are concrete — stakeholders can see “March 2 to March 20.”
-
critmarks the critical path (matching the PERT result: D, E, F). -
Progress (
done,active) is visible at a glance. -
What’s missing: you cannot see that C ends on day 8 and could end on day 11. Slack is invisible. Merge-point risk is invisible.
4.4 The Three-Point Estimate in Action
Suppose task D — Frontend Build is genuinely uncertain. The team estimates:
| Estimate | Days |
|---|---|
| Optimistic (O) | 4 |
| Most likely (M) | 6 |
| Pessimistic (P) | 14 |
$$E = \frac{4 + 4(6) + 14}{6} = \frac{42}{6} = 7 \text{ days}$$
$$\ sigma = \frac{14 – 4}{6} = 1.67 \text{ days}$$
Now the project duration is no longer “18 days.” It is a distribution: 18 days mean, with variance accumulated across the critical path. This is what lets you say:
“Our plan is 19 days. We are 84% confident of finishing within 21 days.”
A classic deterministic Gantt chart cannot express that sentence at all.
4.5 Same Project, Projected with Uncertainty
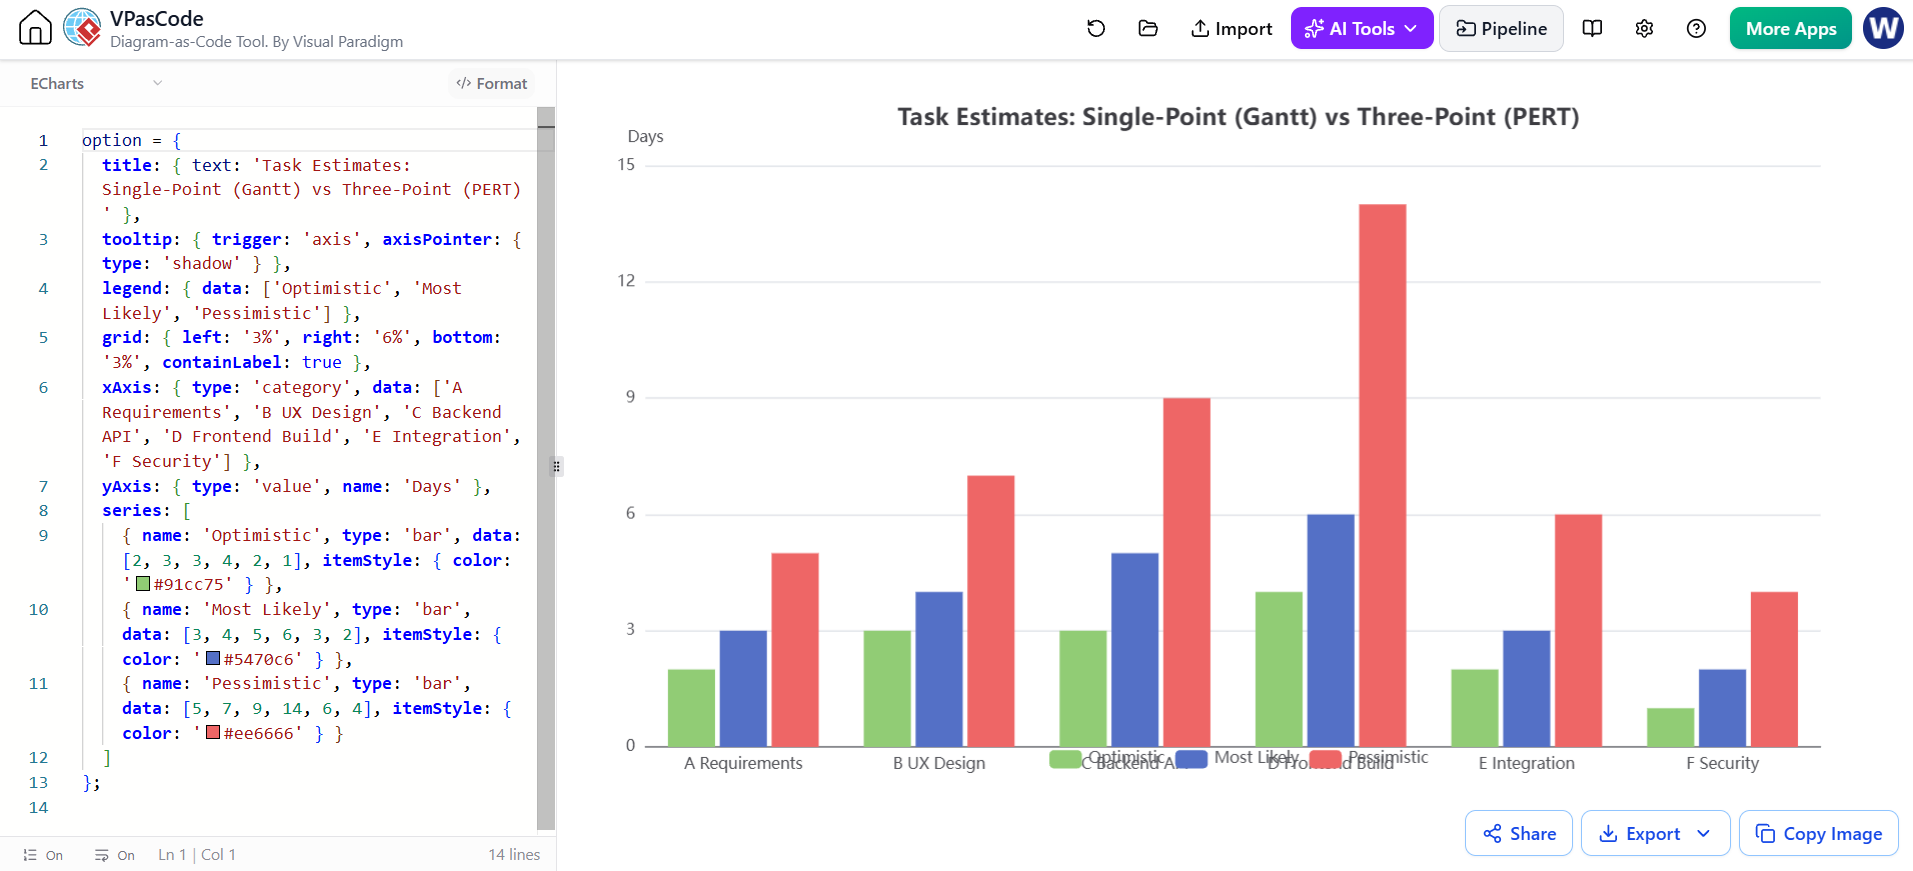
A useful summary of the two PERT outputs versus a single-number Gantt plan:
option = {
  title: { text: 'Task Estimates: Single-Point (Gantt) vs Three-Point (PERT)' },
  tooltip: { trigger: 'axis', axisPointer: { type: 'shadow' } },
  legend: { data: ['Optimistic', 'Most Likely', 'Pessimistic'] },
  grid: { left: '3%', right: '6%', bottom: '3%', containLabel: true },
  xAxis: { type: 'category', data: ['A Requirements', 'B UX Design', 'C Backend API', 'D Frontend Build', 'E Integration', 'F Security'] },
  yAxis: { type: 'value', name: 'Days' },
  series: [
    { name: 'Optimistic', type: 'bar', data: [2, 3, 3, 4, 2, 1], itemStyle: { color: '#91cc75' } },
    { name: 'Most Likely', type: 'bar', data: [3, 4, 5, 6, 3, 2], itemStyle: { color: '#5470c6' } },
    { name: 'Pessimistic', type: 'bar', data: [5, 7, 9, 14, 6, 4], itemStyle: { color: '#ee6666' } }
  ]
};
Note how task D — Frontend Build has the widest spread (4→14). That is where the risk lives, and where a Gantt chart’s single bar of “6” is most misleading. Spread between optimistic and pessimistic is a risk heat map for free.
5. How the Two Charts Fit Together in Real Practice
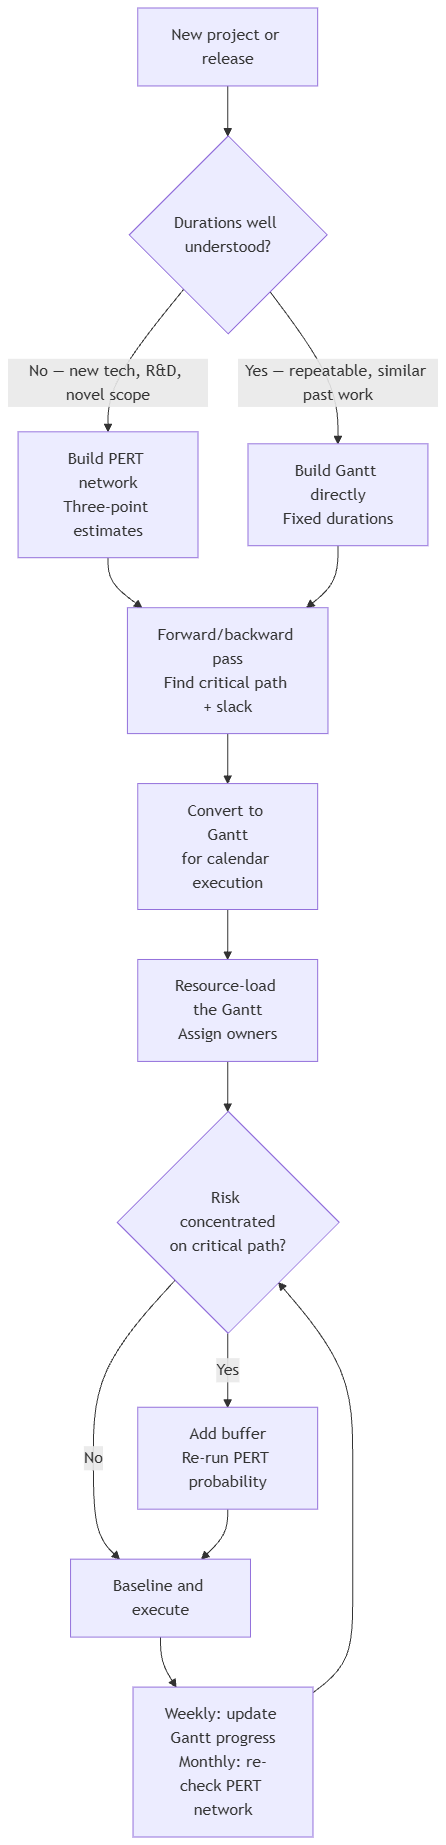
5.1 Decision Flow
flowchart TB
    A["New project or release"] --> B{"Durations well understood?"}
    B -->|"No — new tech, R&D, novel scope"| C["Build PERT network\nThree-point estimates"]
    B -->|"Yes — repeatable, similar past work"| D["Build Gantt directly\nFixed durations"]
    C --> E["Forward/backward pass\nFind critical path + slack"]
    D --> E
    E --> F["Convert to Gantt\nfor calendar execution"]
    F --> G["Resource-load the Gantt\nAssign owners"]
    G --> H{"Risk concentrated\non critical path?"}
    H -->|"Yes"| I["Add buffer\nRe-run PERT probability"]
    H -->|"No"| J["Baseline and execute"]
    I --> J
    J --> K["Weekly: update Gantt progress\nMonthly: re-check PERT network"]
    K --> H
The canonical lifecycle: PERT first (planning & risk), Gantt second (execution & reporting), PERT again whenever the network changes.
5.2 What Each Chart Is Actually Good At
| Question | Ask the… |
|---|---|
| What is the fastest possible delivery date? | PERT |
| Which tasks can be delayed without consequence? | PERT |
| Where do two workstreams merge and risk compounding? | PERT |
| How confident are we in this date? | PERT (three-point) |
| Who is working on what next Tuesday? | Gantt |
| Are we ahead or behind baseline? | Gantt |
| What do I show the steering committee? | Gantt |
| Which task is blocking three others right now? | Gantt with dependency lines |
6. Common Mistakes
PERT mistakes
-
Cycles in the network. PERT requires a DAG. Iterative work (design → build → redesign) must be modeled as rework loops outside the core network, or the math collapses.
-
Three-point estimates invented by one person. O/M/P must come from the people doing the work, or you get fiction with three decimal places.
-
Ignoring merge points. The most dangerous node in any network is a task with several predecessors — it inherits the worst slip of all its feeders. Slack on the incoming path is not protection; it is an illusion.
-
Confusing path length with criticality. Recount again: longest duration, never most tasks.
-
Not updating the network. A PERT chart frozen at kickoff is decoration. Recompute after every scope change.
Gantt mistakes
-
Hiding dependencies. Bars without arrows look organized and communicate nothing about risk.
-
No baseline. A Gantt chart without a baseline can show progress but not slippage — two different things.
-
Treating the bar as truth. A bar says “6 days”; reality is a range. Gantt charts create false precision.
-
Over-decomposition. 400-line Gantt charts get scrolled past. Roll up to summary rows and keep the WBS detail elsewhere.
-
Ignoring the critical path. Coloring nothing red means the reader must do the network analysis mentally — they won’t.
7. Tooling: Visual Paradigm AI Chatbot and VPasCode
7.1 What the AI Chatbot Does Well
Describe your project in plain language and get a rendered chart back. Both diagram types above are produced this way — the PERT chart from a task/duration/predecessor list, the Gantt chart in the same conversation.
Effective prompt pattern for PERT:
“Create a PERT chart for a mobile banking app v2 launch. Tasks and durations: Requirements 3d, UX Design 4d, Backend API 5d, Frontend Build 6d, Integration Test 3d, Security Audit 2d. Dependencies: UX after Requirements, Backend after Requirements, Frontend after UX, Integration after Backend and Frontend, Security after Integration. Show early start, early finish, late start, late finish and slack on each node, and mark the critical path.”
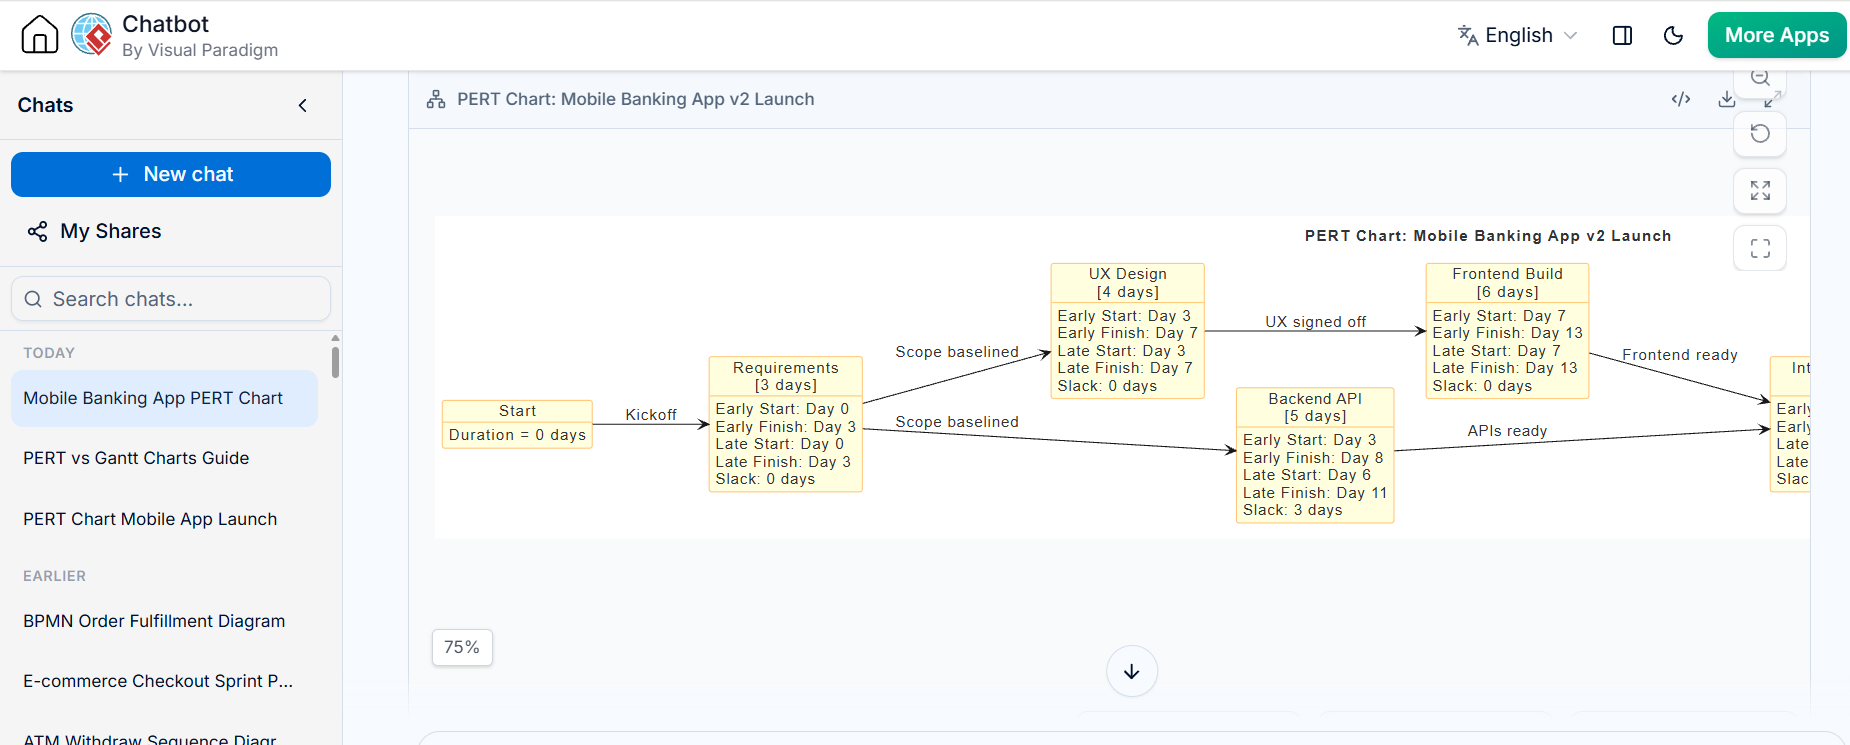
What makes this prompt work: durations are explicit, predecessors are explicit, and the analysis fields are named. Vague prompts (“plan my app launch”) produce plausible-looking but arbitrary numbers.

Effective prompt pattern for Gantt:
“Create a Gantt chart for the same plan starting 2 March 2026. Group tasks by phase — Discovery, Engineering, Verification — highlight the critical path in red, mark Launch as a milestone, and show Requirements as complete and UX Design as in progress.”
Then iterate in conversation, not from scratch. The real value is the follow-up loop:
-
“What is the critical path?”
-
“Which tasks have more than 2 days of slack?”
-
“Backend API just slipped 3 days — recompute the schedule and show the new end date.”
-
“Add a 4-day project buffer at the end.”
-
“Convert only the critical path into a Gantt chart.”
7.2 VPasCode
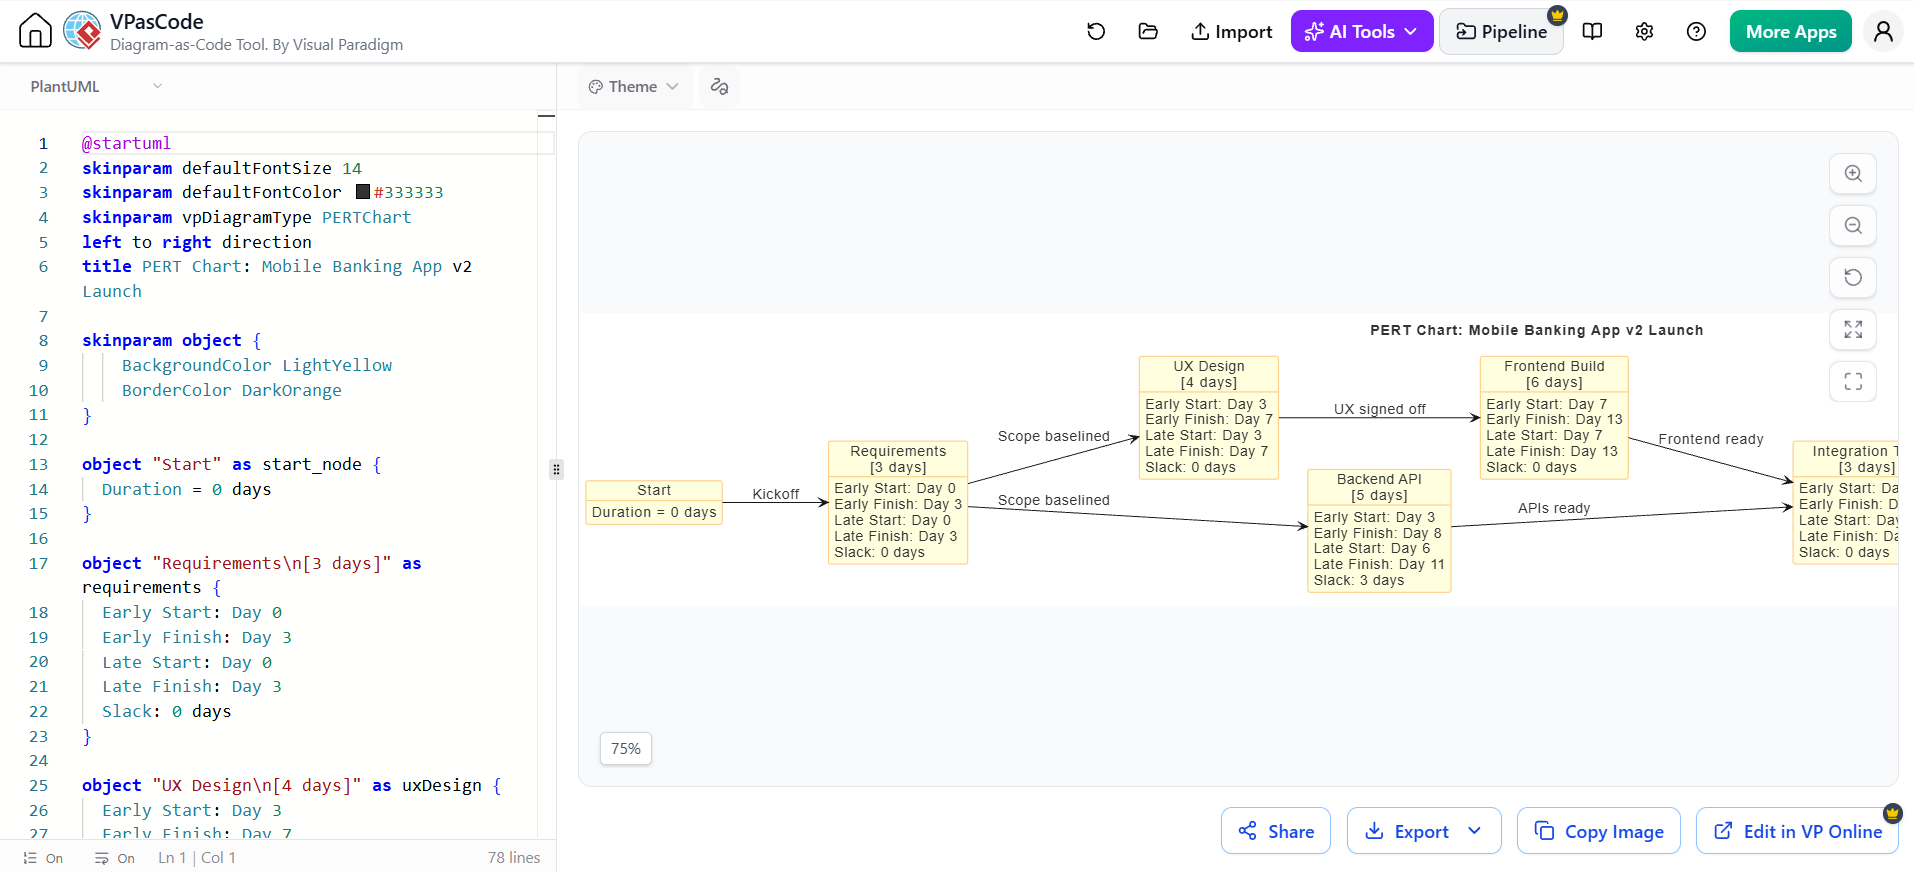
All generated diagram source is available as editable code, which is the point where a conversational tool becomes a production tool:
-
Fork, don’t redraw. Copy the PERT source, change three durations, re-render. No dragging boxes.
-
Version control. Diagram source lives in Git next to the project plan. Diffs show exactly which dependency changed and when.
-
Review. Dependency changes go through pull request like code — appropriate, since the network is the plan’s logic.
-
Batch generation. Generate a PERT chart, a Gantt chart, and a WBS from one parameterized task list, keeping the three views guaranteed consistent.
-
Rapid what-if analysis. Duplicate the source, run a pessimistic variant, compare end dates. This is the cheapest risk analysis available.
Practical workflow:
-
Brainstorm the task list conversationally.
-
Ask for the PERT chart and the analysis fields.
-
Read off the critical path and slack.
-
Request the Gantt version for stakeholder communication.
-
Take the code into VPasCode for versioning and maintenance.
-
On every change, update the code — not the picture.
Note on rendering the diagrams above: the PERT chart uses a node-and-arrow network with computed timing fields on each node; the Gantt chart uses calendar bars with
critandmilestoneflags. Both are plain-text source, so both are reviewable in a diff.
8. One-Page Summary
| PERT | Gantt | |
|---|---|---|
| Question answered | What depends on what? How long, honestly? | Who does what, when? Are we late? |
| Shape | Network graph | Timeline bars |
| Killer feature | Critical path + slack + probability | Calendar + progress + ownership |
| Blind spot | No calendar, no people, no progress | No uncertainty, slack invisible |
| Produce it when | Planning, re-planning, risk review | Execution, reporting, resourcing |
| Kill it when | The team needs dates, not logic | The team needs to reason about risk |
The rule of thumb: PERT to decide. Gantt to deliver. Build the network to find the truth about your schedule, then draw the bars to communicate it. If you only have time for one, do the network — a wrong Gantt chart is confidently wrong, while a rough PERT chart is at least honest about where the risk sits.

 English
 Arabic
 Chinese (Simplified)
 Dutch
 French
 German
 Italian
 Japanese
 Korean
 Portuguese
 Russian
 Spanish