


Introduction
In today’s rapidly evolving business landscape, operational agility is not just an advantage—it is a necessity. Organizations often find themselves trapped in legacy workflows that rely on manual handoffs, siloed data, and outdated decision-making frameworks. The bridge between these inefficient current states and a streamlined future lies in Business Process Model and Notation (BPMN) Gap Analysis.
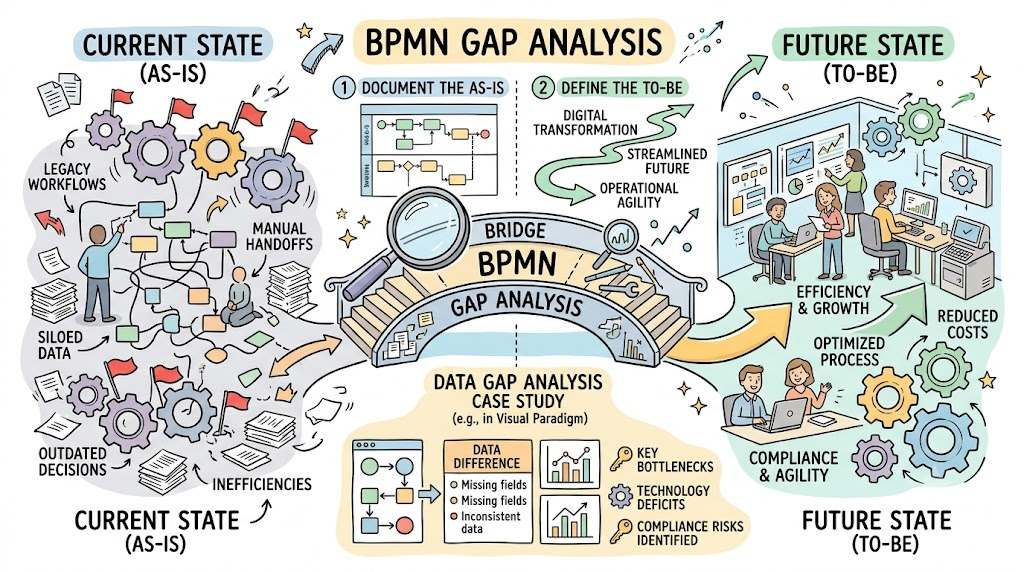
While many organizations document their processes, few effectively leverage those diagrams as diagnostic tools. A true Gap Analysis goes beyond simple documentation; it systematically compares the “AS-IS” reality against a “TO-BE” vision to expose bottlenecks, technology deficits, and compliance risks. This tutorial provides a step-by-step framework for conducting this analysis, using a real-world Data Gap Analysis case study to illustrate how tools like Visual Paradigm can transform static diagrams into dynamic roadmaps for digital transformation. By mastering this methodology, process architects and analysts can move from merely describing work to actively engineering efficiency.
1. Key Concepts of BPMN Gap Analysis
To conduct an effective analysis, one must first understand the specific BPMN elements that serve as indicators of process health. In the Visual Paradigm environment, these elements are not just drawing shapes; they are metadata-rich objects that can be analyzed for performance metrics.
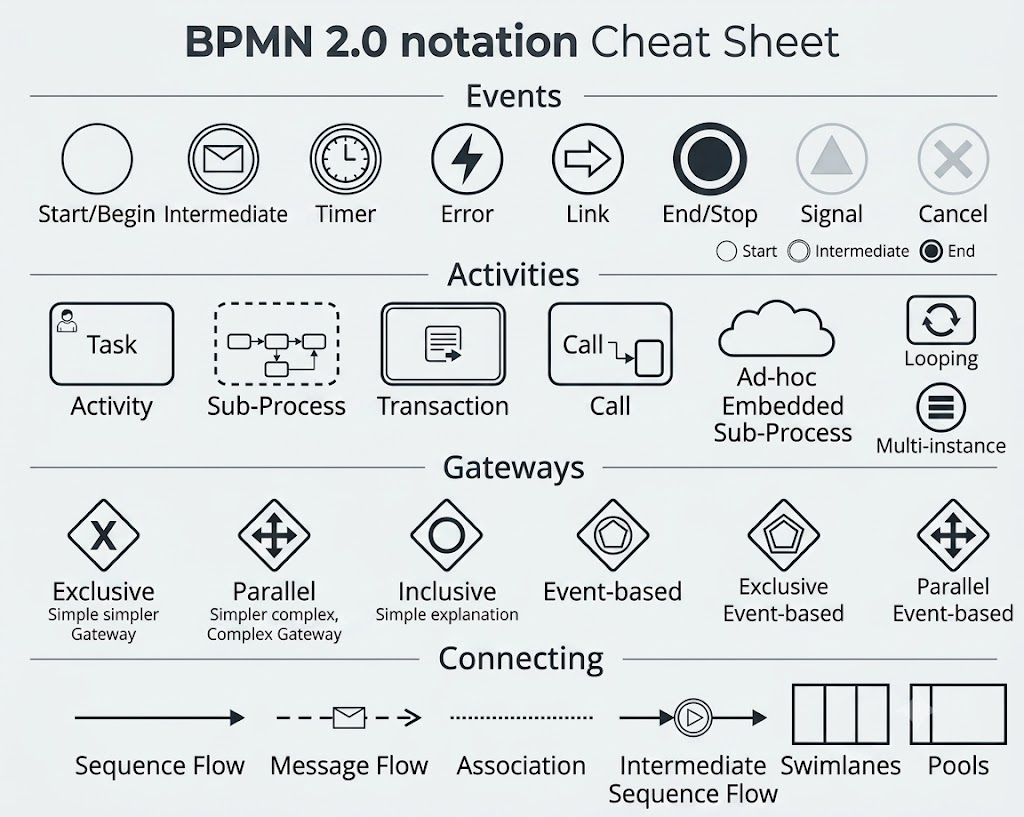
A. Core BPMN Elements Used in Analysis
-
Pools & Lanes: These represent organizational boundaries, departments, or roles (e.g., Compliance Analyst, Risk Manager). In gap analysis, excessive lane switching often indicates poor role definition or unnecessary handoffs.
-
Tasks & Sub-processes: Individual work steps. A critical gap indicator is the transition from manual tasks (user icon) to service/automated tasks (gear/AI icon). Identifying high volumes of manual user tasks highlights automation opportunities.
-
Gateways : Decision points (Exclusive $\times$) or parallel flows (Inclusive/Parallel $+$). Complex gateway logic often signals process ambiguity or risk management gaps.
-
Events (Start, Intermediate, End): Triggers or status updates. Timer Intermediate Events are particularly important in gap analysis as they visually represent bottlenecks, waiting periods, and SLA breaches.
-
Data Objects & Stores: Represent inputs, outputs, reports, and databases. Disconnected data objects or missing links to data stores indicate integration silos.
B. Types of Process Gaps Identified
-
Process/Workflow Gaps: Redundant steps, unnecessary approvals, or uncoordinated handoffs between pools/lanes that increase cycle time without adding value.
-
Automation/Technology Gaps: Reliance on manual data processing, spreadsheet manipulation, or legacy systems instead of automated services, APIs, or AI-driven systems.
-
Data & Integration Gaps: Isolated data silos, missing real-time synchronization, lack of standardized data objects, or disconnected data stores.
-
Control & Compliance Gaps: Inadequate risk-scoring mechanisms, missing audit logs, slow escalation paths for high-risk items, or lack of traceability in decision gateways.
2. Practical Case Study: Data Gap Analysis Process
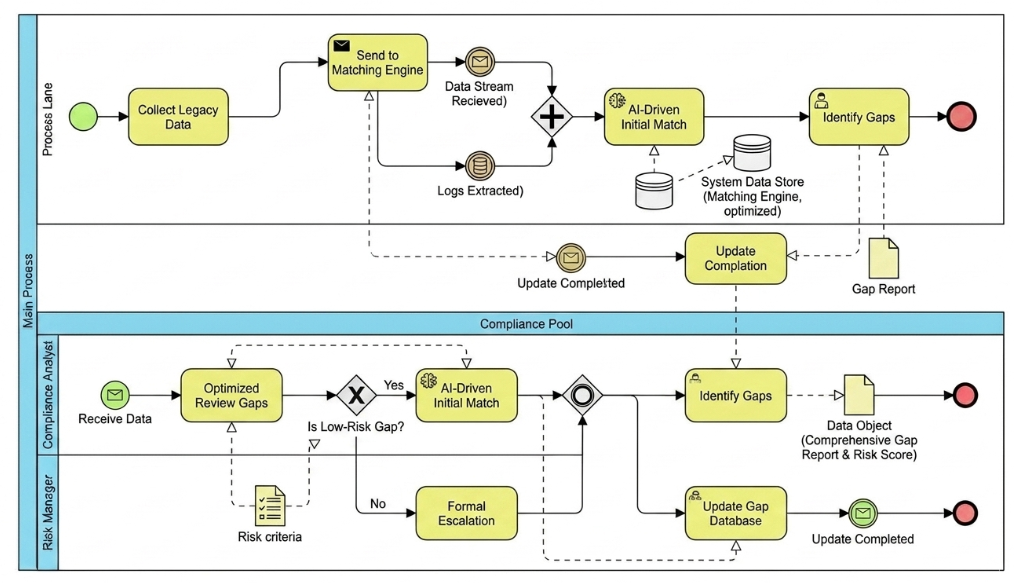
The following diagrams illustrate a real-world transformation from an AS-IS Data Gap Analysis process to an optimized TO-BE state. This case study demonstrates how visual modeling reveals specific inefficiencies and guides targeted improvements.
Comparative Gap Summary
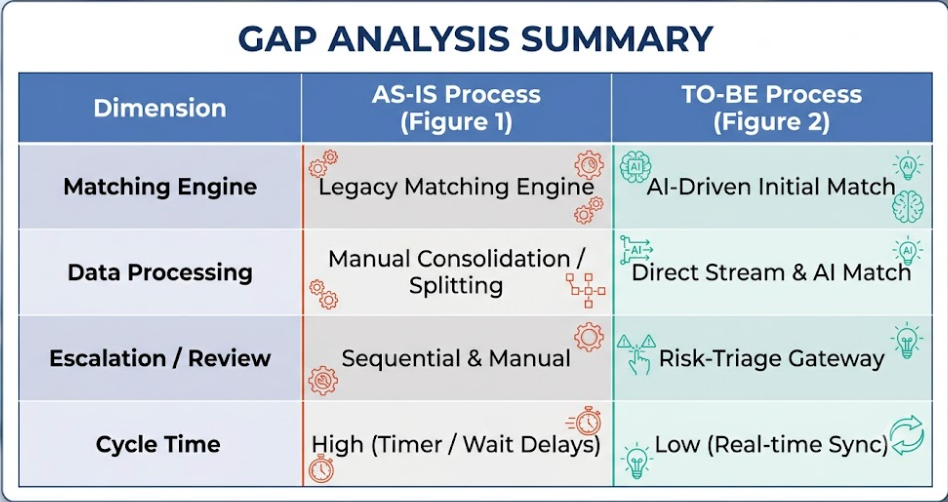
1. AS-IS Process Analysis
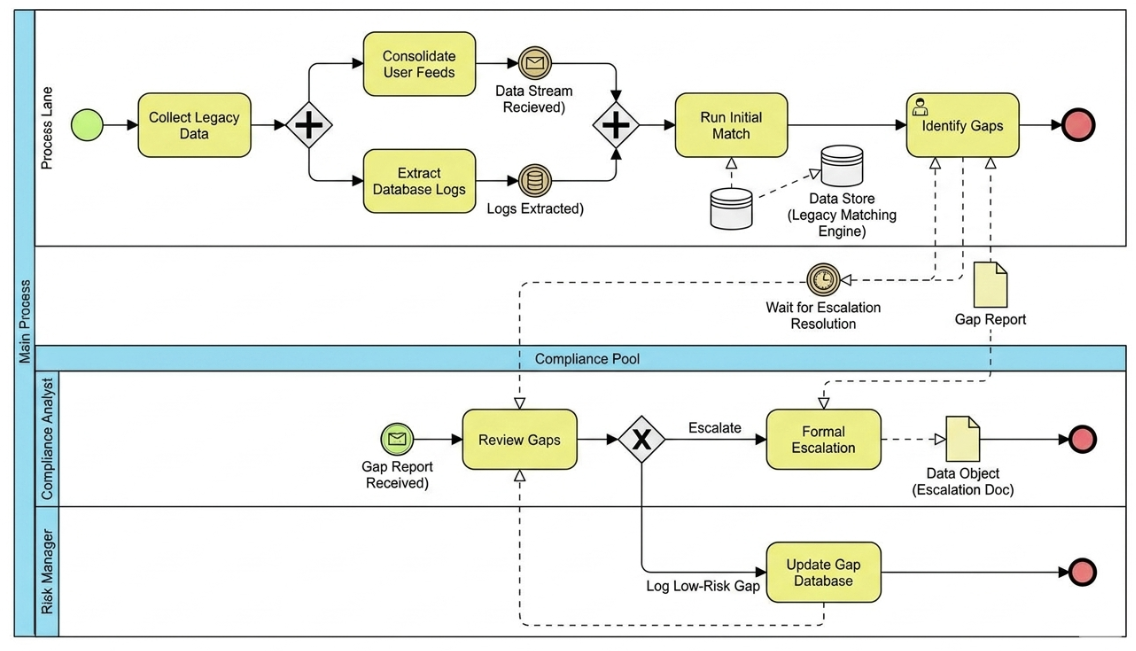
-
Initial Data Ingestion: Uses a parallel gateway (+) where data must be manually split between
Consolidate User FeedsandExtract Database Logsbefore running aLegacy Matching Engine. This creates redundant processing paths. -
Bottlenecks & Delays: After
Identify Gaps, aTimer Intermediate Event(“Wait for Escalation Resolution”) pauses the main process flow while awaiting compliance review. This timer represents a significant cycle time gap. -
Compliance Flow: The Compliance Analyst reviews gaps sequentially. High-risk items are formally escalated, while low-risk items are routed down to the Risk Manager to manually
Update Gap Database. The manual nature of both paths creates operational drag.
2. TO-BE Process Optimizations
-
Automation & AI Integration: Replaces manual consolidation and the legacy matching engine with
Send to Matching Enginepaired directly with anAI-Driven Initial Matchservice task, linked to an optimized system data store. This eliminates the parallel manual split. -
Streamlined Escalation Logic: Instead of pausing the main process with a timer, the Compliance Analyst uses an
Is Low-Risk Gap?exclusive gateway:-
Low Risk (Yes): Processed rapidly through
AI-Driven Initial Matchwithin compliance, bypassing manual review. -
High Risk (No): Directly routed to
Formal Escalationwithout unnecessary intermediate steps.
-
-
Asynchronous Updates: Replaces waiting delays with immediate
Update Compilationmessaging back to the main process, ensuring real-time database sync (Update Gap Database). The timer event is completely eliminated.
3. Real-World Use Cases & Examples
The principles demonstrated in the Data Gap Analysis case study apply across industries. Below are two additional examples of BPMN gap analysis in action.
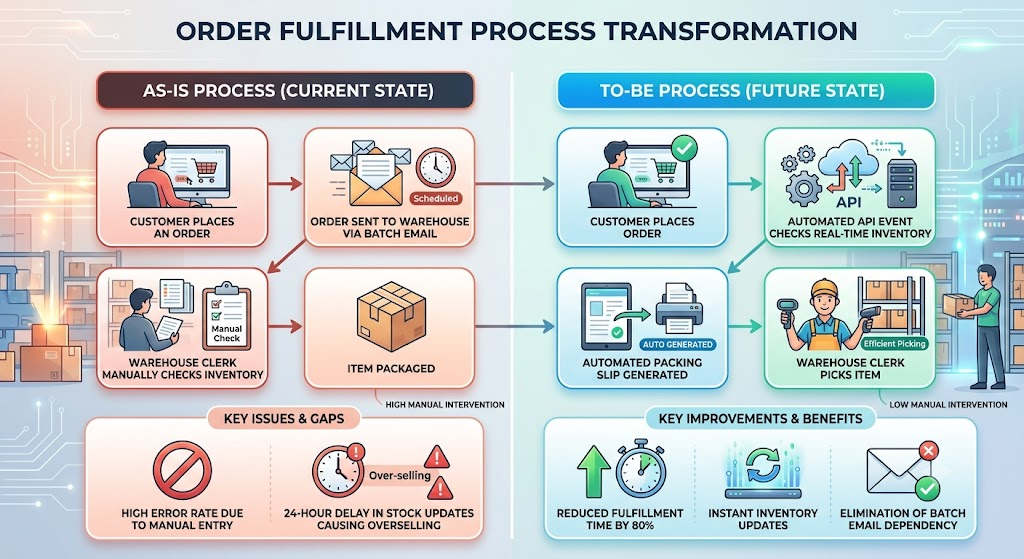
Use Case 1: E-Commerce Order Fulfillment
-
AS-IS:
-
Customer places an order -> Order sent to warehouse via batch email -> Warehouse clerk manually checks inventory -> Item packaged.
-
Gap: High error rate due to manual entry; 24-hour delay in stock updates causing overselling.
-
-
TO-BE:
-
Customer places order -> Automated API Event checks real-time inventory -> Automated packing slip generated -> Warehouse clerk picks item.
-
Improvement: Reduced fulfillment time by 80%; instant inventory updates; elimination of batch email dependency.
-
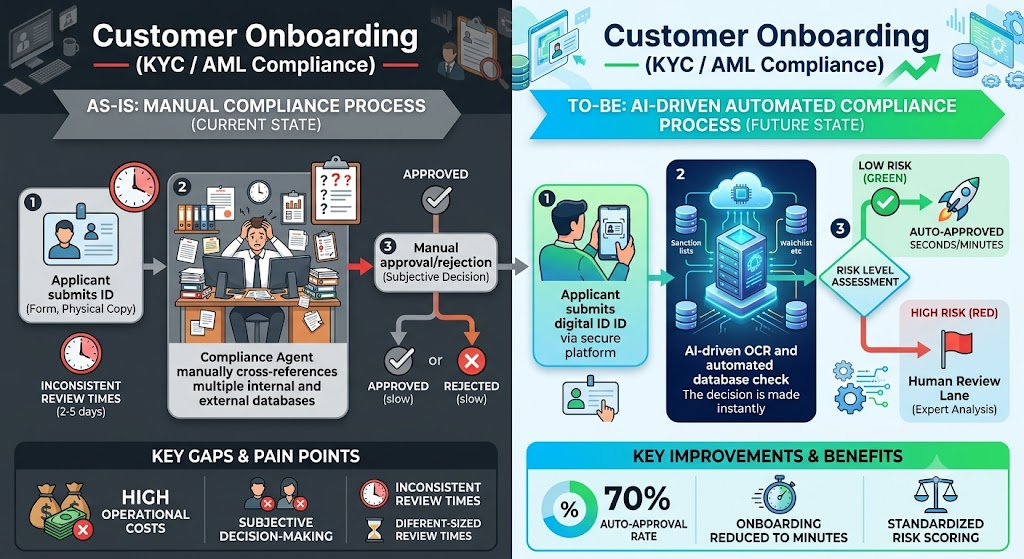
Use Case 2: Customer Onboarding (KYC / AML Compliance)
-
AS-IS:
-
Applicant submits ID -> Compliance Agent manually cross-references databases $\rightarrow$ Manual approval/rejection.
-
Gap: Inconsistent review times (2-5 days); high operational costs; subjective decision-making.
-
-
TO-BE:
-
Applicant submits ID -> AI-driven OCR and automated database check -> Low-risk auto-approved; high-risk flagged for human review lane.
-
Improvement: 70% auto-approval rate; onboarding reduced to minutes; standardized risk scoring.
-
4. How to Conduct a BPMN Gap Analysis Step-by-Step with Visual Paradigm
Visual Paradigm provides a comprehensive ecosystem specifically designed to support this analytical workflow. Below is a practical guide to executing gap analysis using VP’s tooling capabilities.
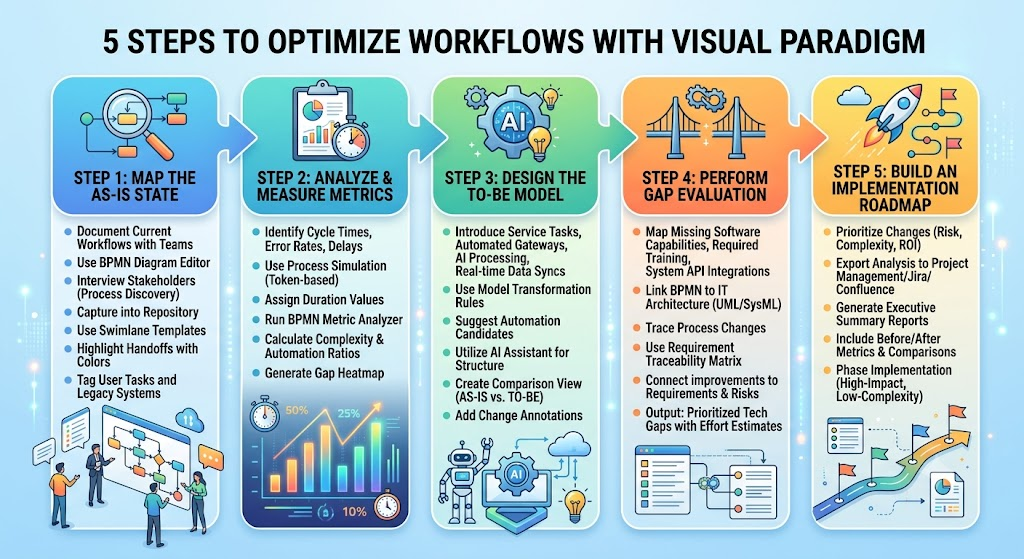
Step 1: Map the AS-IS State
Document current workflows with operational teams using Visual Paradigm’s BPMN Diagram Editor.
-
VP Feature: Use the Process Discovery module to interview stakeholders and capture processes directly into the repository.
-
Best Practice: Highlight handoffs between pools/lanes using distinct colors. Tag manual tasks with the “User Task” stereotype and legacy systems with custom properties.
-
VP Feature: Utilize Swimlane Templates to ensure consistent role representation across diagrams.
Step 2: Analyze & Measure Metrics
Identify cycle times, error rates, intermediate timers/delays, and manual user tasks.
-
VP Feature: Use Process Simulation to run token-based simulations on your AS-IS model. Assign duration values to tasks and timers to quantify bottlenecks.
-
VP Feature: Leverage the BPMN Metric Analyzer to automatically calculate complexity scores, handoff counts, and automation ratios.
-
Output: Generate a Gap Heatmap showing which lanes and tasks contribute most to cycle time.
Step 3: Design the TO-BE Model
Introduce service tasks, automated gateways, AI processing, and real-time data syncs.
-
VP Feature: Use Model Transformation rules to suggest automation candidates based on AS-IS patterns (e.g., flagging all User Tasks connected to Timer Events as automation targets).
-
VP Feature: Employ the AI Assistant to recommend optimal gateway structures and service task integrations based on industry best practices.
-
Best Practice: Create a Comparison View in VP to display AS-IS and TO-BE diagrams side-by-side with change annotations.
Step 4: Perform Gap Evaluation
Map missing software capabilities, required training, and system API integrations needed to bridge the gap.
-
VP Feature: Link BPMN tasks to IT Architecture Models (UML/SysML) to trace process changes to specific system requirements.
-
VP Feature: Use Requirement Traceability Matrix to connect each TO-BE improvement to a business requirement and associated risk mitigation.
-
Output: A prioritized list of technology gaps with effort estimates.
Step 5: Build an Implementation Roadmap
Prioritize changes based on risk, complexity, and ROI.
-
VP Feature: Export analysis results to Project Management modules or integrate with Jira/Confluence for execution tracking.
-
VP Feature: Generate Executive Summary Reports automatically from the model, including before/after metrics and visual comparisons.
-
Best Practice: Phase implementation starting with high-impact, low-complexity gaps identified in Step 2.
Leveraging the Visual Paradigm Ecosystem
Visual Paradigm is uniquely positioned to support end-to-end BPMN Gap Analysis through its integrated platform:
| Capability | Visual Paradigm Tool | Gap Analysis Application |
|---|---|---|
| Process Modeling | BPMN 2.0 Diagram Editor | Create standards-compliant AS-IS/TO-BE models |
| Quantitative Analysis | Process Simulator & Metric Analyzer | Measure cycle times, identify bottlenecks objectively |
| Change Management | Model Comparison & Version Control | Track evolution between AS-IS and TO-BE states |
| Requirements Alignment | Requirement Traceability | Ensure process changes map to business objectives |
| Collaboration | Team Server & Review Module | Gather stakeholder feedback on gap findings |
| Documentation | Report Generator | Produce executive-ready gap analysis reports |
The ecosystem approach ensures that gap analysis is not a one-time exercise but an integrated part of continuous process improvement. Models remain living artifacts that evolve with the organization.
Conclusion
BPMN Gap Analysis transforms process modeling from a documentation exercise into a strategic improvement engine. By systematically comparing AS-IS and TO-BE states, organizations can identify precisely where manual effort, technological debt, and structural inefficiencies reside. The Data Gap Analysis case study demonstrates that even complex compliance processes can be dramatically streamlined through targeted automation, intelligent routing, and real-time data integration.
When executed within the Visual Paradigm ecosystem, this analysis becomes quantitative, traceable, and actionable. The platform’s simulation, metric analysis, and traceability features ensure that gap identification is evidence-based rather than anecdotal. More importantly, the seamless connection between process models, system architecture, and project execution means that identified gaps translate directly into implemented improvements.
Organizations that master BPMN Gap Analysis do not simply optimize individual processes—they build a culture of continuous, data-driven operational excellence. The roadmap from AS-IS to TO-BE becomes clear, measurable, and achievable, turning process diagrams into genuine catalysts for transformation.
Related posts:
 Mastering Repetition in BPMN: A Practical Guide to Loops and Multi-Instance Activities
 AI-Powered Modeling in Agile: How BPMN and UML Are Making a Comeback
 Step-by-Step Guide: Mapping Employee Onboarding Workflows with AI
 🛒 From Cart to Confirmation: A Beginner’s Complete Guide to BPMN Using Visual Paradigm Online’s Free Web-Shop Workflow

 English
 Arabic
 Chinese (Simplified)
 Dutch
Dutch French
 German
 Italian
 Japanese
 Korean
 Portuguese
 Russian
 Spanish